chan, chockalingam and lai-overnight information and intraday trading behavior - evidence from nyse cross
Bạn đang xem bản rút gọn của tài liệu. Xem và tải ngay bản đầy đủ của tài liệu tại đây (111.84 KB, 15 trang )
Journal of Multinational Financial Management
10 (2000) 495–509
Overnight information and intraday trading
behavior: evidence from NYSE cross-listed
stocks and their local market information
Kalok Chan
a
, Mark Chockalingam
b
, Kent W.L. Lai
c,
*
a
Department of Finance, Hong Kong Uni6ersity of Science and Technology, Hong Kong
b
Schering-Plough Health Care, Memphis, TN, USA
c
Department of Accounting and Finance, Lingnan Uni6ersity, Tuen Mun, N.T. Hong Kong
Received 15 July 1999; accepted 4 March 2000
Abstract
In this paper we study how overnight price movements in local markets affect the trading
activity of foreign stocks on the NYSE. We find that local price movements affect not only
the opening returns of foreign stocks, but also their returns in the first 30-min interval. The
magnitude of local price movements is positively related to price volatility of foreign stocks,
and this relation is stronger at the NYSE open and weaker afterward. This result helps
explain why intraday price volatility is high at the open and lower at midday. However, local
price movements cannot account for intraday variations in trading volume. We also find that
trading volume for foreign stocks is strongly correlated with NYSE opening price volatility
and weakly correlated with local market overnight price volatility. We interpret the result as
evidence that the trading activity of foreign stocks on the NYSE is related more to liquidity
trading of US investors and less to local market information. © 2000 Elsevier Science B.V.
All rights reserved.
JEL classification
:
G14 Information and Market Efficiency; G15 International Financial Markets
Keywords
:
Intraday volatility; Market microstructure; Multiple-market trading
www.elsevier.com/locate/econbase
* Corresponding author. Tel.: +852-26168166; fax: +852-24664751.
E-mail address
:
(K.W.L. Lai).
1042-444X/00/$ - see front matter © 2000 Elsevier Science B.V. All rights reserved.
PII: S1042-444X(00)00030-X
K. Chan et al.
/
J. of Multi. Fin. Manag.
10 (2000) 495 – 509
496
1. Introduction
Extensive empirical evidence documents that the stock market is more active at
the beginning of the trading session. Measures of market activity, such as trading
volume, price volatility, and number of transactions, are higher at the open and
close for NYSE stocks (Jain and Joh (1988), Foster and Viswanathan (1993), and
Jang and Lee (1993)). Several studies conjecture that the higher market activity at
the open is due to overnight information that accumulates during the NYSE
nontrading period. For example, Berry and Howe (1994) document that the
number of news announcements released by Reuter’s News Service increases at 8:00
am (EST)—one and a half hours before the NYSE open—indicating an increase in
public information flow before the open. Foster and Viswanathan (1993) show that
informed traders who gather private information during the nontrading period
trade more aggressively after the open if they suspect their information will become
public soon. Brock and Kleidon (1992) and Gerety and Mulherin (1992) argue that
because of the new information that arrives during the nontrading period, the
portfolio that is optimal during the previous close will no longer be optimal when
the market reopens. Therefore, market activity increases immediately after the open
as investors rebalance their portfolios.
In light of the relation between market activity and information flow, many
authors examine internationally cross-listed stocks and check whether their price
behavior is different from that of non-cross-listed stocks, given their different
information-flow patterns (Barclay et al., 1990; Kleidon and Werner, 1993; Chan et
al., 1994; Choe, 1994; Foster and George, 1994). Despite the intuitive appeal that
the trading behavior of these cross-listed stocks in the morning is related to
overnight information released in their local markets, none of these studies directly
tests this possibility.
In this paper we examine the intraday patterns of trading volume and price
volatility for stocks traded on the NYSE and listed on Asia-Pacific and UK
exchanges. We test whether these patterns are related to public information
accumulated overnight. Unlike Berry and Howe (1994) who use the number of
news articles released during the nontrading period, or other researchers who use
close-to-open return volatility, we infer the overnight information flow of these
cross-listed stocks directly from price movements in their local markets. Since most
information generated during the NYSE nontrading period about these foreign
stocks is reflected in local markets, local stock price movement is a good proxy for
overnight information. If the market activity at the open is related to overnight
information, we expect to find a positive relation between the level of market
activity in the morning and the magnitude of local stock price movement.
Furthermore, as information about these foreign stocks (both public and private)
is more likely to arrive during the NYSE overnight period than during the trading
period, market activity is greater in the morning than the mid-day. This suggests
that once we control for the effect of overnight information (local stock price
movements), intraday variations in market activity will be reduced.
K. Chan et al.
/
J. of Multi. Fin. Manag.
10 (2000) 495 – 509
497
Unlike previous studies, we infer overnight information from the local price
movement rather than from the NYSE opening returns. Although the local price
movement and NYSE opening returns are closely related, they are not perfectly
correlated, as the price in one market could move because of the trading activity
there. Furthermore, local trading sessions for Asia-Pacific stocks are closed before
the NYSE opens. Therefore, we examine how local price movements, which are
public information to US investors, affect the trading activity of foreign stocks on
US exchanges.
We find that overnight price movements in local markets affect not only opening
returns of foreign stocks, but also returns during the first 30 minutes. Also, the
magnitude of local price movements is positively related to the price movement of
foreign stocks in the morning. The relation is stronger around the open and weaker
afterward. This diminishing effect of overnight information on intraday price
movements helps explain why price volatility is higher at the open and lower at
midday. On the other hand, local price movements cannot explain intraday
variations in trading volume. This suggests that the trading volume of foreign
stocks on the NYSE is not related to overnight public information. We also find
that trading volume is strongly correlated with NYSE opening price movement and
weakly correlated with local market price movement. We interpret this result as
evidence that the trading activity of foreign stocks on the NYSE is related more to
liquidity trading of US investors and less to local market information.
The paper proceeds as follows. Section 2 discusses the relation between overnight
information and intraday market activity. Section 3 describes the data and sum-
mary statistics. Section 4 presents empirical methodologies and results. Section 5
presents the conclusion.
2. Relation between overnight information and intraday market activity
2
.
1
. Why market acti6ity is higher at the open
Extensive empirical evidence documents that stock market behavior at the
beginning of the NYSE trading session differs from the rest of the day. Wood et al.
(1985), Harris (1986), and Lockwood and Linn (1990) examine intraday stock
returns and find that price volatility is higher near the open and close of the trading
session. Jain and Joh (1988), Foster and Viswanathan (1993), and Jang and Lee
(1993) find that trading volume and number of transactions are also higher at the
open. Several explanations may account for this trading behavior. First, much
public information accumulates overnight and is not reflected in prices during the
NYSE nontrading period. Once the NYSE opens, overnight information is quickly
incorporated into prices, resulting in a large price movement at the open. Berry and
Howe (1994) and Mitchell and Mulherin (1994) examine the effect of public
information on market activity. Using the number of news announcements released
by Reuter’s News Service as a measure of public information flow, Berry and Howe
(1994) document that information flow substantially increases at 8:00 am (EST).
K. Chan et al.
/
J. of Multi. Fin. Manag.
10 (2000) 495 – 509
498
Second, informed traders gather private information during the nontrading
period and may act strategically when trading with liquidity traders. This is
analogous to the interday trading strategies analyzed in Foster and Viswanathan
(1990). In their model, the informed trader receives private information at the
beginning of the week. Since a portion of the private information is made public
each day, the information becomes less valuable through time. The informed trader,
knowing a public signal is forthcoming, trades more aggressively so that more
information is reflected through trading. A similar logic can be applied to intraday
trading. If informed traders receive private information overnight and suspect the
information may be leaked later in the day, they will trade immediately after the
open.
Third, volume at the close and open reflects trades made to rebalance portfolios
before and after the overnight trading halt. Brock and Kleidon (1992) argue that
because of overnight information, portfolios that are optimal during the previous
close will no longer be optimal when the market reopens. Furthermore, portfolios
that are optimal at the close can differ, because of the imminent nontrading period,
from portfolios that are optimal during the continuous trading period. This
inelastic demand to trade induces a surge in trading activity at the open and close.
Fourth, since the NYSE operates continuously during the trading day, but
commences trading with a call auction, these two trading mechanisms could
generate different transitory volatilities. Amihud and Mendelson (1987) and Stoll
and Whaley (1990) document that open-to-open return variances are greater than
close-to-close return variances for stocks traded on the NYSE. This implies that
opening prices contain larger pricing errors than closing prices. However, subse-
quent studies (e.g., Amihud and Mendelson, 1991; Choe and Shin, 1993; Masulis
and Ng, 1995) find similar evidence for stocks traded on other exchanges that have
different trading mechanisms. This suggests that higher transitory volatility at the
open is in fact due to the overnight trading halt. Without trading venues, the
overnight trading halt disturbs the process of price formation until the open
(Grundy and McNichols, 1989; Dow and Gorton, 1993; Leach and Madhavan,
1993). Gerety and Mulherin (1994) find that transitory volatility declines during the
trading day both for the Dow Jones 65 Composite price index and for individual
firms in the Dow Jones 30 index.
2
.
2
. A simple regression framework for understanding the effect of o6ernight
information
As discussed above, one reason for increased market activity at the open is that
overnight information accumulates during the NYSE nontrading period. This is
true even when the overnight information becomes public, since investors experi-
ence uncertainty in interpreting the information. Furthermore, as several re-
searchers (Grundy and McNichols, 1989; Dow and Gorton, 1993; Leach and
Madhavan, 1993) argue, multiple rounds of trading can produce prices that are less
noisy and reveal more information than a single round of trading. Therefore,
overnight information affects market activity at the open, but the effect diminishes
K. Chan et al.
/
J. of Multi. Fin. Manag.
10 (2000) 495 – 509
499
during the day. The diminishing effect of overnight information might explain why
the market activity surges at the open and declines afterward. This can be
illustrated by a simple regression model. Suppose V
~,t
denotes intraday market
activity (either trading volume or price movement) for interval ~ at day t, and F
t
denotes overnight information. If the effect of overnight information on market
activity diminishes during the day, then in a set of regression equations for different
intervals:
V
~,t
=h
~
+i
~
F
t
+
~,t
(1)
the i
~
coefficient is larger for smaller ~. Since the average of V
~,t
is given by
V
(
~
=h
~
+i
~
F
(
(2)
V
(
~
could be higher for earlier intervals (smaller ~), even though the h
~
’s are the
same across all intervals. Equation (2) also suggests that if intraday variations in
V
~,t
are only due to innovations in overnight information, the h
~
intercepts will have
no variations once F
t
is allowed to affect V
~,t
differently at different intervals. Note
that the regression models assume that variations in market activity are solely
caused by overnight information. This can be justified, especially for foreign stocks
that have much information released in local markets overnight. If other variables
contribute to intraday variations in market activity, the h
~
intercept will not be the
same even after controlling for F
t
.
3. Data and summary statistics
We obtain data from the NYSE Trades and Quotes (TAQ) database. It com-
prises all trade records and quotation records on the NYSE, AMEX, and regional
exchanges. The trade records contain the time to the nearest second, date, ticker
symbol, price, and number of shares traded; the quotation records contain the time,
date, ticker symbol, bid and ask price, and number of shares the specialist quotes
for the bid and the ask. We also obtain data from the EXTEL database, which
comprises daily price records for most of the firms in the United Kingdom and
large firms worldwide. The prices are in terms of foreign currencies, and are not
translated into the US dollars. Therefore, the relationship between the price
movement in the US and foreign market is not due to exchange rate fluctuation.
The sample period is the first quarter of 1993. Since we are examining the effect
of overnight local information on NYSE trading activity, we select foreign stocks
whose local trading sessions precede the NYSE. To be included in the analysis, the
foreign stocks must be listed on the NYSE and have at least 20 days of more than
10 quotes a day. Each day, we match the transactions data for foreign stocks with
daily stock prices in local markets. For several foreign stocks that do not have local
stock prices available from EXTEL, we obtain the local data from the New York
Times. Among the 29 European stocks that meet the requirements, 21 are UK. For
convenience, we exclude non-UK European stocks so that the length of overlapping
trading hours on the NYSE and local exchanges is the same for European stocks.
Seven Asia-Pacific stocks meet our selection requirements.
K. Chan et al.
/
J. of Multi. Fin. Manag.
10 (2000) 495 – 509
500
Table 1 presents descriptive statistics for the final sample. Included are average
daily trading volume and countries for foreign stocks. The average daily volume
exhibits large cross-sectional variation across the sample, ranging from 13,013
shares for Hitachi Ltd., to more than 2 million shares for Glaxo Holding Plc. The
Asia-Pacific stocks are from Japan, Hong Kong, Australia, and New Zealand, and
their local trading sessions close before the NYSE opens. The European stocks are
from the United Kingdom, and they trade simultaneously in London and New
York for two hours. Since a portion of the price movement in London is
contemopraneous with that in New York, we partition the results into samples of
Asia-Pacific and UK stocks.
Table 1
Summary statistics for the sample of foreign stocks traded on the NYSE.
Company name CountryObs Daily volumeTicker symbol
Panel A: UK stocks
Attwoods1UKA 71 575
113 977UKAutomated Security Plc2 ASI
British Airways Plc3UKBAB 87 490
BP British Petroleum4 UK 940 143
26 727UKBritish Gas Plc5 BRG
197 4666UKBST British Steel
British Telecommunication7UKBTY 72 451
8 CWP Cable and Wireless Plc UK 25 770
Glaxo Holdings Plc UKGLX9 2 015 439
GRM 49 60310 UKGrand Metropolitan Plc
UK 538 48311 HAN Hanson Plc
Huntingdon Intl. Holdings UK12 29 654HTD
Saatchi & Saatchi Co. Plc UK13 48 167SAA
531 585UKSmithkline Beecham Plc14 SBE
SC15 ‘‘Shell’’ Transport and Trading UK 101 840
16 UKTPH 38 782Tiphook Plc
UKUnilever PlcUN17 172 279
163 511UK18 Vodafone Group PlcVOD
UK 64 88819 WCG Willis Corron Plc
Wellcome Plc UK20 408 669WEL
WME21 Waste Management Plc UK 116 008
Panel B: Asia-Pacific stocks
1 13 013JapanHitachi Ltd.HIT
Hong KongHong Kong Telecommunication 145 994HKT2
Honda Motor Co. Ltd. Japan 12 0003 HMC
NWS News Corporation Ltd.4 Australia 294 339
Telecommunication Corp. of New 75 0695 New ZealandNZT
Zealand
SNE6 38 592JapanSony Corporation
75 300WBK7 AustraliaWestpac Banking Corp
K. Chan et al.
/
J. of Multi. Fin. Manag.
10 (2000) 495 – 509
501
4. Empirical results
4
.
1
. Relation between price mo6ements on the NYSE and local markets
The NYSE trading session (9:30 am–4:00 pm EST) is partitioned into 14 time
intervals: overnight period, open-to-10:00 am period, and twelve successive 30-min
intervals. The overnight return is based on the opening transaction price of that day
and the midpoint of the closing bid-ask quote of the previous day. The return for
the open-to-10:00 am period is computed from the opening price to the midpoint of
the last bid-ask quote of the period. The return for other 30-min intervals is
computed from the midpoint of the last bid-ask quote before the end of the
previous interval to the midpoint of the last bid-ask quote of the interval. Let
RET
i,t
0
denotes the overnight return of foreign stock i on the NYSE at day t, and
RET
i,t
~
denotes the return of intraday interval ~, ~=1, 2, … , 13, and let n
i,t
denotes
the price innovation in the local market for stock i (the price information generated
between the NYSE close and next day opening). The effect of local market
information on intraday returns can be assessed by the regression model:
RET
i,t
~
=h
~
+i
~
n
i,t
+
i,t
~
~= 0, 1, 2, …, 13 (3)
However, the local price innovation (n
i,t
) is not observed. Since the data for local
markets are closing stock prices, we can construct only local close-to-close returns,
which reflect the price reaction to both overnight information released in the local
trading session at day t and to information generated during the US trading session
at day t−1.
1
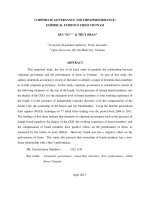
This is demonstrated in Fig. 1. For simplicity, we assume the local
trading session is closed before the US market opens, although later we see that this
assumption is not important. Since local and US trading sessions do not overlap,
information is reflected in the two markets at different times. Information released
during the local trading session is first incorporated into prices in the local market
and then into prices in the US market; the reverse is true for information released
during the US trading session. In general, most of the information about foreign
stocks (e.g., firm-specific and country-specific information) is released in local
markets. However, since US news has global effects, information released in the US
market also affects foreign stocks. As a result, local close-to-close returns reflect not
only overnight information released in the home market at day t, but also
information already incorporated into foreign stock prices in the US market at day
t− 1.
Therefore, the local price innovation (n
i,t
) could be estimated from removing
prior-day US information from local close-to-close returns. Let LRET
i,t
cc
denote
local close-to-close returns at day t; let RET
i,t−1
0c
denote open-to-close returns in the
US market at day t− 1; and, assuming a linear relation between the returns, let
LRET
i,t
cc
=a +bRET
i,t−1
0c
+n
i,t
(4)
1
We cannot obtain opening stock prices for the stocks in their local markets, otherwise the overnight
price innovation for Asian stocks could be directly inferred from the local open-to-close returns.
K. Chan et al.
/
J. of Multi. Fin. Manag.
10 (2000) 495 – 509
502
Fig. 1. Returns for foreign stocks in the Local and US markets.
Thus, local close-to-close returns at day t consist of price adjustments to: (i) US
information at day t−1, captured by RET
i,t−1
0c
and (ii) overnight information
released in the local market at day t (n
i,t
). The innovations n
i,t
can be captured by
estimating Eq. (4) and extracting the residuals. However, instead of estimating the
n
i,t
innovations in Eq. (4) in the first stage and passing them to Eq. (3) for final
estimation, we can obtain more efficient estimates of h
~
and i
~
through a one-step
procedure. Substituting for n
i,t
in Eq. (3) from Eq. (4), we obtain:
RET
i,t
~
=h
~
+i
~
(LRET
i,t
cc
−a −bRET
i,t−1
0c
)+
i,t
~
=h
~
*+ i
~
*LRET
i,t
cc
+k
~
*RET
i,t−1
0c
+
i,t
~
(5)
where h
~
*= h
~
−ai
~
, i
~
*= i
~
, k
~
*=−bi
~
~= 0, 1, 2, …, 13
Therefore, i
~
coefficients can be estimated by including RET
i,t
0c
as an explanatory
variable, which is expected to have negative coefficients. The above relation is
similar even when local and US trading sessions overlap. The only difference is that
since some of the US information at day t −1 is already reflected in local market
returns RET
i,t
0c
is measured from the close of the local market to the close of the US
market. Therefore, for UK stocks whose local trading sessions close two hours after
the NYSE opens, RET
i,t
0c
is measured from 11:30 am (EST) to the NYSE close.
We estimate regression coefficients subject to the constraints implied by Eq. (5).
Note that although the error terms in regression equations may be correlated, there
is no efficiency gain from using seemingly unrelated regression methodology since
the explanatory variable is the same for each regression.
K. Chan et al.
/
J. of Multi. Fin. Manag.
10 (2000) 495 – 509
503
Table 2 reports regression results. The t-statistics appear in parentheses and are
adjusted for heteroskedasticity using White’s (1980) consistent covariance matrix.
Since the estimates of i
~
are not significant for later intervals, results for intervals after
12:30 pm are not reported. As expected, the i
~
coefficient is the highest (with the largest
t-statistic) for the close-to-open return. This indicates that most of the local market
information is incorporated into opening prices. For Asia-Pacific stocks, estimates of
i
~
are positive and significant for the open-10:00 am interval. Since Asia-Pacific
markets are already closed before the NYSE opens, this suggests that not all of the local
market information is incorporated into NYSE opening prices. For UK stocks,
estimates of b are positive and significant up to the 10:30–11:00 am interval. This is
because trading sessions in London and New York overlap for two hours.
4
.
2
. Market acti6ity after controlling for the effect of o6ernight information
When the NYSE opens, US investors react to overnight information, causing
increases in both trading volume and price volatility. This is true even when the
overnight information is public at the open, since investors experience uncertainty in
interpreting the information. However, as trading proceeds, prices become less noisy,
so that trading volume and price volatility decline.
Table 2
Regression of intraday returns for foreign stocks traded on the NYSE on local market returns
a
.
UK stocksAsia-Pacific stocks
Adjusted R
2
Interval a i
~
* Adjusted R
2
i
~
*a
(%) (%)
Close-to-open 0.236 (3.02) 17.300.641 (13.27) 50.29
Open–10:00 15.250.209 (2.30)7.380.104 (4.68)
am
0.050.010 (0.73) 0.027 (1.65)10:00–10:30 1.25
am
0.043 (2.17)10:30–11:00 3.270.003 (0.25) −0.32
am
−0.003 −0.120.009 (0.79) −0.3611:00–11:30
(−0.29)am
−0.07−0.00411:30–12:00 −0.040.007 (0.69)
(−0.68)pm
−0.090.020.020 (2.63) 0.002 (0.37)12:00–12:30
pm
0.308 (5.04) 0.779 (10.35)
a
RET
i,t
~
=h
~
*+i
~
*LRET
i,t
cc
+k
~
*RET
i,t−1
0c
+
i,t
~
, ~=0, 1, 2, …, 13; subject to the constraints: where
h
~
*=h
~
−ai
~
, i
~
*=i
~
, k
~
*=−ai. RET
i,t
~
is the intraday return for interval ~ at day t, LRET
i,t
cc
is the
local market close-to-close return at day t, and RET
i,t−1
0c
is the NYSE open-to-close return (for
Asia-Pacific stocks) or 11:30 am—NYSE close return (for UK stocks) at day t−1. Results for intervals
after 12:30 pm are not reported. The t-statistics that appear in parentheses are adjusted for het-
eroskedasticity using White’s consistent covariance matrix of the coefficient estimates.
K. Chan et al.
/
J. of Multi. Fin. Manag.
10 (2000) 495 – 509
504
To examine the impacts of overnight information on market activity, we regress
the intraday market activity variable (V
i,t
t
) on the local market volatility (n
i,t
) for
different interval ~:
V
i,t
~
=h
~
+i
~
n
i,t
+
i,t
~
(6)
where n
i,t
are the residuals extracted from the regression of local market close-to-
close returns on NYSE open-to-close returns (for Asia-Pacific stocks) or returns
from 11:30 am (EST) to the NYSE close (for UK stocks) of the prior day.
2
Intraday price volatility is measured by the absolute value of the return for the
interval (RET
i,t
~
) while intraday trading volume is measured by number of shares
traded during the interval (VOL
i,t
~
). Regressions are conducted using intraday price
volatility and trading volume alternately as the dependent variable, and they are
estimated for intervals up to 12:30 pm. In the following regressions, we combine the
overnight interval and the opening interval, so that the first interval is from
previous close to 10:00 am. The regressions are estimated based on pooled
cross-sectional and time-series data. To control for cross-sectional variations, we
normalize RET
i,t
~
and VOL
i,t
~
by dividing each observation by average daily price
movement and daily volume for stock i, respectively.
Results for the regression of intraday price movement are reported in Table 3.
We also estimate regression intercepts without admitting n
i,t
as the explanatory
variable so that we can test for intraday variations without controlling for innova-
tions in overnight information. In Model 1 the regression excludes n
i,t
as the
explanatory variable. The regression intercepts (h
~
) decline monotonically during
the morning, dropping from 0.782 at interval 1 to 0.093 at interval six for
Asia-Pacific stocks, and from 0.704 at interval 1 to 0.133 at interval six for UK
stocks. We test whether the h
~
coefficients are the same and reject this for both
groups of stocks (p-valueB 0.001). Overall, the evidence confirms previous studies
that find the intraday price movement for foreign stocks traded on the NYSE is
higher at the open and declines during midday.
In Model 2 the regression includes n
i,t
as the explanatory variable. The coeffi-
cients on n
i,t
are much higher in the first interval than in other intervals.
Furthermore, for UK stocks, i
~
coefficients decline monotonically during the day,
from 14.56 at interval 1 to −0.040 at interval six. A test of the equality of i
~
coefficents is conducted and rejected for both Asia-Pacific stocks (P-valueB 0.001)
and UK stocks (P-value=0.030). The results support the hypothesis that the
reaction of intraday price movement to overnight information is higher at the open
and declines during the day. As expected, this helps explain intraday variations in
price movement. This is confirmed by regression intercepts in Model 2. Although h
~
coefficients seem to differ across intervals, the variations are less pronounced. In
fact, for Asia-Pacific stocks, a test of the equality of h
~
coefficients is not rejected
at the 5% level.
2
This follows previous studies (Stoll and Whaley (1990), Jones et al. (1994), and Huang and Masulis
(1999)) that measure the price volatility based on the absolute returns.
K. Chan et al.
/
J. of Multi. Fin. Manag.
10 (2000) 495 – 509
505
Table 3
Regression of intraday price volatility (RET
i,t
~
) of foreign stocks traded on the NYSE, with and
without controlling for innovations in local market price volatility (n
i,t
).
a
Asia-Pacific stocks UK stocks
Model 2 Model 1 Model 2Model 1
Intercept (h
~
)Intercept (h
~
)Interval
0.242 (3.36)0.782 (17.26) 0.704 (32.85) 0.522 (6.43)Close–10:00 am
10:00–10:30 am 0.248 (24.97)0.163 (12.63) 0.215 (14.30)0.137 (8.14)
0.194 (22.80) 0.169 (10.11)0.114 (7.32)10:30–11:00 am 0.137 (12.89)
0.174 (23.65) 0.154 (12.49)11:00–11:30 am 0.122 (11.63) 0.091 (6.76)
0.145 (20.99) 0.136 (16.95)0.090 (8.29)11:30–12:00 pm 0.098 (10.47)
0.093 (10.82) 0.099 (8.07) 0.133 (18.88) 0.134 (15.48)12:00–12:30 pm
Beta (i
~
) Beta (i
~
)
Close–10:00 am 14.560 (2.09)52.086 (7.03)
2.601 (2.55)2.370 (1.92)10:00–10:30 am
2.053 (1.54)10:30–11:00 am 2.461 (1.93)
1.665 (1.73)2.986 (2.74)11:00–11:30 am
0.989 (0.93) 0.790 (2.08)11:30–12:00 pm
−0.040 (−0.13)−0.571 (−0.69)12:00–12:30 pm
2
(h
i
) 11.5 (P=0.074) 248.3 (PB0.001) 18.7 (P=0.005)93.5 (PB0.001)
26.1 (PB0.001) 14.0 (P=0.030)
2
(i
i
)
a
Model 1: RET
i,t
~
=h
~
, and Model 2: RET
i,t
~
=h
~
+i
~
n
i,t
+
i,t
~
~=1, 2, …, 6 where RET
i,t
~
is the
intraday return for interval ~, and RET
i,t
~
is normalized by dividing each observation by average daily
absolute returns for stock i. n
i,t
is the absolute value of return innovations in the local market; return
innovations are residuals extracted from the regression of local close-to-close return on prior-day NYSE
open-to-close returns (for Asia-Pacific stocks) or 11:30 am—NYSE close return (for UK stocks). The
t-statistics that appear in parentheses are adjusted for heteroskedasticity using White’s consistent
covariance matrix of the coefficient estimates.
Results for the regression of intraday trading volume are reported in Table 4.
When the regressions are estimated without admitting n
i,t
as an explanatory
variable in Model 1, the estimates of h
~
are higher for the first several intervals. A
test of whether h
~
coefficients are the same across intervals can be rejected for both
Asia-Pacific and UK stocks (P-value B 0.001). When we include n
i,t
as an explana-
tory variable in Model 2, the coefficients on n
i,t
do not decline during the day. A
test of the equality of i
~
coefficients cannot be rejected at the 3% level. Since
overnight information does not have differential effects on trading volume during
the morning, it cannot explain intraday variations in trading volume. After allowing
for the explanatory power of overnight information, we can still reject that the
intercepts are equal across the intervals for both groups of stocks.
Overall, evidence indicates that the reaction of intraday price movement on the
NYSE to overnight information from local markets is higher at the open and
declines during the midday. This explains why price movement is higher during the
early morning. After we control for the effect of overnight information, intraday
variations in movement are less pronounced. However, the effect of overnight
K. Chan et al.
/
J. of Multi. Fin. Manag.
10 (2000) 495 – 509
506
information on trading volume does not decline during the day; therefore, intraday
variations in volume remain unexplained.
4
.
3
. Determinants of trading 6olume of foreign stocks
The theories of trading volume suggest that innovations in overnight information
affect trading activity at the open. For foreign stocks, innovations in overnight
information can arise from US and local markets. As the evidence in Table 2
indicates, US opening returns and local market close-to-close returns are not
perfectly correlated. One reason is that the two sets of returns are not measured
over exactly the same interval. Another reason is that the information to which
local and US stock prices react might be different, since the information could be
about liquidity trading, which is market specific. Certainly, in a perfectly integrated
global market, foreign stock price movements in the US and local markets must be
aligned to preclude arbitrage opportunities. However, with transaction costs, their
prices could be slightly different without allowing arbitrage opportunities.
Table 4
Regression of intraday trading volume (VOL
i,t
~
) of foreign stocks traded on the NYSE, with and
without controlling for innovations in local market price volatility (n
i,t
).
a
Asia-Pacific stocks UK stocks
Model 1 Model 2 Model 1 Model 2
Interval Intercept (h
~
) Intercept (h
~
)
0.135 (14.10)0.163 (13.30)h
1
0.091 (3.87) 0.148 (23.34)
0.089 (9.50)0.115 (16.24)0.028 (1.41)h
2
0.088 (8.54)
0.085 (8.50) 0.005 (0.13) 0.098 (13.91) 0.089 (8.63)h
3
0.095 (9.02) 0.016 (0.52)h
4
0.083 (10.43) 0.071 (5.35)
h
5
0.060 (16.09)0.062 (10.08) 0.039 (3.19) 0.056 (12.22)
h
6
0.048 (7.28)0.054 (6.50)0.051 (3.19)0.065 (8.83)
Beta (i
~
)Beta (i
~
)
1.041 (1.70)6.913 (3.22)i
1
5.271 (2.71)i
2
2.039 (3.38)
i
3
0.864 (1.54)7.382 (2.00)
1.149 (0.99)i
4
6.854 (2.20)
0.272 (1.31)i
5
2.191 (2.00)
0.499 (1.24)i
6
1.566 (1.22)
56.6 (PB0.001) 18.4 (P=0.005) 135.6 (PB0.000)
2
(h
i
) 28.4 (PB0.001)
13.4(P=0.037)x
2
(i
i
) 8.9 (P=0.179)
a
Model 1: VOL
i,t
~
=h
~
and Model 2: VOL
i,t
~
=h
~
+i
~
n
i,t
+
i,t
~
, ~=1, 2, …, 6, where VOL
i,t
~
is the
intraday trading volume for interval ~ at day t, and is normalized by dividing each observation by
average daily volume for stock i. n
i,t
is the absolute value of return innovations in local markets; return
innovations are residuals extracted from the regression of local close-to-close returns on prior-day NYSE
open-to-close returns (for Asia-Pacific stocks) or 11:30 am—NYSE close returns (for UK stocks). The
t-statistics that appear in parentheses are adjusted for heteroskedasticity using White’s consistent
covariance matrix of the coefficient estimates.
K. Chan et al.
/
J. of Multi. Fin. Manag.
10 (2000) 495 – 509
507
Table 5
Regression of intraday trading volume (VOL
i,t
~
) of foreign stocks traded on the NYSE on innovations
in local market price volatility (n
i,t
) and opening price volatility (RET
i,t
0
).
a
Asia-Pacific stocks UK stocks
Adjusted R
2
i
I
k
i
k
i
Adjusted R
2
Interval i
i
(%) (%)
5.172 (3.89)Close–10:00 8.892.019 (1.84) 0.727 (1.30) 2.428 (3.15) 1.58
am
3.362 (2.05) 3.60 1.612 (3.30)1.431 (1.70) 3.400 (3.34)10:00–10:30 3.43
am
3.229 (2.77) 5.89 0.633 (1.12)10:30–11:00 1.601 (1.71)1.446 (1.57) 0.40
am
3.771 (2.69) 6.46 1.262 (0.93)1.317 (0.76) −0.90411:00–11:30 0.37
(−0.63)am
11:30–12:00 0.246 (0.40) 1.434 (1.48) 0.99 0.297 (1.34) −0.010 −0.00
pm (−0.02)
−0.743 2.153 (2.55) 0.6312:00–12:30 0.497 (1.23) 0.204 (0.35) −0.09
(−0.84)pm
6.5
2
(i
i
) 12.1
(P=0.062)(P=0.370)
15.7 15.5
2
(k
i
)
(P=0.017)(P=0.015)
a
VOL
i,t
~
=h
~
+i
~
n
i,t
+k
~
RET
i,t
0
+
i,t
~
~=1, 2, …, 6, where VOL
i,t
~
is the intraday trading volume on
the NYSE, RET
i,t
0
is the return measured from close to open, and both VOL
i,t
~
and RET
i,t
~
are
normalized by dividing each observation by average daily volume and absolute daily returns for stock
i, respectively. n
i,t
is the absolute value of return innovations in local markets; return innovations are
the residuals extracted from regression of local market close-to-close return on prior-day NYSE
open-to-close return (for Asia-Pacific stocks) or 11:30 am—close NYSE return (for UK stocks). The
t-statistics that appear in parentheses are adjusted for heteroskedasticity using White’s consistent
covariance matrix of the coefficient estimates.
Given that information in the two markets might be different, we examine how
the trading activity of foreign stocks reacts to either source of information. This is
related to the literature on the relation between volume and price variability (see
Karpoff (1987) and Gallant et al. (1992)). We extend the analysis by examining
whether trading volume on the NYSE is correlated more with overnight price
variability from the US or local markets. Price variability is measured by the
absolute value of the return, and a regression model for trading volume is estimated
for each of the first six intervals:
VOL
i,t
~
=h
~
+i
~
n
i,t
+ k
~
RET
i,t
0
+
i,t
~
~= 1, 2, …, 6 (7)
Similar to previous regressions, the overnight interval is merged with the opening
interval; therefore, VOL
i,t
l
is the volume from the opening and the first 30-min
interval. VOL
i,t
l
is again normalized by dividing each observation by the average
daily share traded for stock i.
K. Chan et al.
/
J. of Multi. Fin. Manag.
10 (2000) 495 – 509
508
Table 5 reports the results. Most of the coefficients associated with innovations
in local price volatility (n
i,t
) are not significant for either Asia-Pacific or UK
stocks, and a x
2
test fails to reject the hypothesis that the i
~
coefficients are jointly
equal to zero. On the other hand, the coefficients associated with opening price
volatility at the NYSE (RET
i,t
0
) are generally positive and significant, and a x
2
test
rejects the hypothesis that the k
~
coefficients are jointly equal to zero (P-value=
0.015 for Asia-Pacific stocks, P-value =0.017 for UK stocks). Overall, results
indicate that the trading volume for foreign stocks on the NYSE is related to
opening price volatility and not local price volatility. Since opening price volatility
represents the incremental information in the US over local price volatility, it likely
reflects information about US investor trading activity. Therefore, our evidence
suggests that trading activity of foreign stocks is affected more by liquidity trading
of US investors than by local market information.
5. Conclusion
We examine trading volume and price volatility for foreign stocks traded on the
NYSE. We find that local price movements affect not only opening returns of
foreign stocks, but also returns in the first 30 min. This suggests that not all local
market information is incorporated into opening prices.
The magnitude of local price movements is positively related to price variability
of foreign stocks, and this relation is stronger at the NYSE open and weaker
afterward. This result helps explain why intraday price volatility is higher at the
open and lower at midday. However, local price movements cannot account for
intraday variations in trading volume. We also find that trading volume for foreign
stocks is strongly correlated with the NYSE opening price volatility and weakly
correlated with local market overnight price volatility. Therefore, our evidence
suggests that the trading activity of foreign stocks is affected more by liquidity
trading of US investors and less by local market information.
References
Amihud, Y., Mendelson, H., 1987. Trading Mechanisms and Stock Returns: An Empirical Investigation.
Journal of Finance 42, 533–553.
Amihud, Y., Mendelson, H., 1991. Volatility and Trading: Evidence from the Japanese Stock Market.
Journal of Finance 46, 1765–1789.
Barclay, M., Litzenberger, R., Warner, J., 1990. Private Information, Trading Volume, and Stock-Re-
turn Variances. Review of Financial Studies 3, 233–253.
Berry, T., Howe, K., 1994. Public Information Arrival. Journal of Finance 49, 1331–1346.
Brock, W., Kleidon, A., 1992. Periodic Market Closure and Trading Volume: A Model of Intraday Bids
and Asks. Journal of Economic Dynamics and Control 16, 451–489.
Chan, K.C., Fong, W., Kho, B., Stulz, R., 1994. Information, Trading and Stock Returns: Lessons from
Dually-Listed Securities. Journal of Banking and Finance 20, 1161–1187.
Choe, H., 1994. Pricing Errors at the Open and Close for Foreign Stocks Traded on the NYSE,
Working Paper, Pennsylvania State University.
K. Chan et al.
/
J. of Multi. Fin. Manag.
10 (2000) 495 – 509
509
Choe, H., Shin, H., 1993. An Analysis of Interday and Intraday Return Volatility—Evidence from the
Korea Stock Exchange. Pacific-Basin Finance Journal 1, 175–188.
Dow, J., Gorton, G., 1993. Trading, Communication and the response of Price to New Information.
Economic Journal 103, 639–646.
Foster, F., Viswanathan, S., 1990. A Theory of the Interday Variations in Volume, Variance, and
Trading Costs in Securities Markets. Review of Financial Studies 3, 593–624.
Foster, F., Viswanathan, S., 1993. Variations in Trading Volume, Return Volatility, and Trading Costs:
Evidence on Recent Price Formation Models. Journal of Finance 48, 157–186.
Foster, M., George, T., 1994. Pricing Errors at the NYSE Open and Close: Evidence from Internation-
ally Cross-Listed Stocks. Journal of Financial Intermediation 5, 95–126.
Gallant, R., Rossi, P., Tauchen, G., 1992. Stock Prices and Volume. Review of Financial Studies 5,
199–242.
Gerety, M., Mulherin, H., 1992. Trading Halts and Market Activity: An Analysis of Volume at the
Open and the Close. Journal of Finance 47, 1765–1784.
Gerety, M., Mulherin, H., 1994. Price Formation on Stock Exchanges: The Evolution of Trading Within
the Day. Review of Financial Studies 7, 609–629.
Grundy, B., McNichols, M., 1989. Trade and Revelation of Information Through Prices and Direct
Disclosure. Review of Financial Studies 2, 495–526.
Harris, L., 1986. A Transactions Data Study of Weekly and Intradaily Patterns in Stock Returns.
Journal of Financial Economics 16, 99–117.
Huang, R., Masulis, R., 1999. Informed Trading Activity and Stock Price Volatility: Evidence from the
London Stock Exchange, Working paper, Vanderbilt University.
Jang, H., Lee, J. 1993, Intraday Behavior of the Bid-Ask Spread and Related Trading Variables,
Working Paper, University of Oklahoma.
Jain, P., Joh, G., 1988. The Dependence Between Hourly Prices and Trading Volume. Journal of
Financial and Quantitative Analysis 23, 269–284.
Jones, C., Kaul, G., Lipson, M., 1994. Transactions, Volume and Volatility. Review of Financial Studies
7, 631–651.
Karpoff, J., 1987. The Relation Between Price Changes and Trading Volume, A Survey. Journal of
Financial and Quantitative Analysis 22, 109–126.
Kleidon, A., Werner, I., 1993. U.K. and U.S. Trading of British Cross-Listed Stocks: An Intraday
Analysis of Market Integration. Review of Financial Studies 9, 619–664.
Leach, C., Madhavan, A., 1993. Price Experimentation and Security Market Structure. Review of
Financial Studies 6, 375–404.
Lockwood, L., Linn, S., 1990. An Examination of Stock Market Return Volatility During Overnight
and Intraday Periods, 1964–1989. Journal of Finance 45, 591–601.
Masulis, R., Ng, V., 1995. Overnight and Daytime Stock Return Dynamics on the London Stock
Exchange: The Impacts of ‘Big Bang’ and the 1987 Stock-Market Crash. Journal of Business and
Economics Statistics 13, 365–378.
Mitchell, M., Mulherin, J., 1994. The Impact of Public Information on the Stock Market. Journal of
Finance 47, 923–950.
Stoll, H., Whaley, R., 1990. Stock Market Structure and Volatility. Review of Financial Studies 3,
37–71.
White, H., 1980. A Heteroskedasticity-Consistent Covariance Matrix Estimator and Direct Test for
Heteroskedasticity. Econometrica 48, 817–838.
Wood, R., McInish, T., Ord, J., 1985. An Investigation of Transactions Data for NYSE Stocks. Journal
of Finance 40, 723–739.
.