- Trang chủ >>
- Khoa Học Tự Nhiên >>
- Vật lý
barkana, loeb. the first sources of light and the reionization of the universe
Bạn đang xem bản rút gọn của tài liệu. Xem và tải ngay bản đầy đủ của tài liệu tại đây (1.74 MB, 114 trang )
IN THE BEGINNING: THE FIRST SOURCES
OF LIGHT AND THE REIONIZATION
OF THE UNIVERSE
Rennan BARKANA, Abraham LOEB
Institute for Advanced Study, Olden Lane, Princeton, NJ 08540, USA
Department of Astronomy, Harvard University, 60 Garden St., Cambridge, MA 02138, USA
AMSTERDAM } LONDON } NEW YORK } OXFORD } PARIS } SHANNON } TOKYO
R. Barkana, A. Loeb / Physics Reports 349 (2001) 125}238 125
Physics Reports 349 (2001) 125–238
In the beginning: the ÿrst sources of light and
the reionization of the universe
Rennan Barkana
a; ∗; 1
, Abraham Loeb
b
a
Institute for Advanced Study, Olden Lane, Princeton, NJ 08540, USA
b
Department of Astronomy, Harvard University, 60 Garden St., Cambridge, MA 02138, USA
Received October 2000; editor: M:P: Kamionkowski
Contents
1. Preface: the frontier of small-scale
structure 128
2. Hierarchical formation of cold dark matter
halos
133
2.1. The expanding universe 133
2.2. Linear gravitational growth 135
2.3. Formation of non-linear objects 137
2.4. The abundance of dark matter halos 139
3. Gas infall and cooling in dark matter halos 144
3.1. Cosmological Jeans mass 144
3.2. Response of baryons to non-linear
dark matter potentials 147
3.3. Molecular chemistry, photo-
dissociation, and cooling 148
4. Fragmentation of the ÿrst gaseous objects 153
4.1. Star formation 153
4.2. Black hole formation 161
5. Galaxy properties 164
5.1. Formation and properties of galactic
disks 164
5.2. Phenomenological prescription for star
formation 165
6. Radiative feedback from the ÿrst sources
of light
166
6.1. Escape of ionizing radiation from
galaxies 166
6.2. Propagation of ionization fronts in the
IGM 168
6.3. Reionization of the IGM 171
6.4. Photo-evaporation of gaseous halos
after reionization 181
6.5. Suppression of the formation of low
mass galaxies 184
7. Feedback from galactic outows 185
7.1. Propagation of supernova outows in
the IGM 185
7.2. Eect of outows on dwarf galaxies
and on the IGM 192
8. Properties of the expected source
population 195
8.1. The cosmic star formation history 195
8.2. Number counts 199
8.3. Distribution of disk sizes 211
∗
Corresponding author.
E-mail address: (R. Barkana).
1
Present address: Canadian Institute for Theoretical Astrophysics, 60 St. George Street #1201A, Toronto, Ont,
M5S 3H8, Canada.
0370-1573/01/$ - see front matter
c
2001 Elsevier Science B.V. All rights reserved.
PII: S 0370-1573(01)00019-9
R. Barkana, A. Loeb / Physics Reports 349 (2001) 125–238 127
8.4. Gravitational lensing 212
9. Observational probes of the epoch of
reionization 215
9.1. Spectral methods of inferring the
reionization redshift 215
9.2. Eect of reionization on CMB
anisotropies 223
9.3. Remnants of high-redshift systems in
the local universe 225
10. Challenges for the future 228
Acknowledgements 228
References 228
Abstract
The formation of the ÿrst stars and quasars marks the transformation of the universe from its smooth
initial state to its clumpy current state. In popular cosmological models, the ÿrst sources of light began to
form at a redshift z =30 and reionized most of the hydrogen in the universe by z=7. Current observations
are at the threshold of probing the hydrogen reionization epoch. The study of high-redshift sources is
likely to attract major attention in observational and theoretical cosmology over the next decade.
c
2001
Elsevier Science B.V. All rights reserved.
PACS: 98.62.Ai; 98.65.Dx; 98.62.Ra; 97.20.Wt
128 R. Barkana, A. Loeb / Physics Reports 349 (2001) 125–238
1. Preface: the frontier of small-scale structure
The detection of cosmic microwave background (CMB) anisotropies (Bennett et al., 1996;
de Bernardis et al., 2000; Hanany et al., 2000) conÿrmed the notion that the present large-scale
structure in the universe originated from small-amplitude density uctuations at early times. in-
ferred density uctuations Due to the natural instability of gravity, regions that were denser than
average collapsed and formed bound objects, ÿrst on small spatial scales and later on larger
and larger scales. The present-day abundance of bound objects, such as galaxies and X-ray
clusters, can be explained based on an appropriate extrapolation of the detected anisotropies
to smaller scales. Existing observations with the Hubble Space Telescope (e.g., Steidel et al.,
1996; Madau et al., 1996; Chen et al., 1999; Clements et al., 1999) and ground-based telescopes
(Lowenthal et al., 1997; Dey et al., 1998; Hu et al., 1998, 1999; Spinrad et al., 1998; Steidel
et al., 1999), have constrained the evolution of galaxies and their stellar content at z
66. How-
ever, in the bottom-up hierarchy of the popular cold dark matter (CDM) cosmologies, galaxies
were assembled out of building blocks of smaller mass. The elementary building blocks, i.e.,
the ÿrst gaseous objects to form, acquired a total mass of order the Jeans mass (
∼10
4
M
),
below which gas pressure opposed gravity and prevented collapse (Couchman and Rees, 1986;
Haiman and Loeb, 1997; Ostriker and Gnedin, 1996). In variants of the standard CDM model,
these basic building blocks ÿrst formed at z
∼ 15–30.
An important qualitative outcome of the microwave anisotropy data is the conÿrmation that
the universe started out simple. It was by and large homogeneous and isotropic with small uc-
tuations that can be described by linear perturbation analysis. The current universe is clumsy
and complicated. Hence, the arrow of time in cosmic history also describes the progression
from simplicity to complexity (see Fig. 1). While the conditions in the early universe can be
summarized on a single sheet of paper, the mere description of the physical and biological
structures found in the present-day universe cannot be captured by thousands of books in our
libraries. The formation of the ÿrst bound objects marks the central milestone in the transition
from simplicity to complexity. Pedagogically, it would seem only natural to attempt to under-
stand this epoch before we try to explain the present-day universe. Historically, however, most
of the astronomical literature focused on the local universe and has only been shifting recently
to the early universe. This violation of the pedagogical rule was forced upon us by the limited
state of our technology; observation of earlier cosmic times requires detection of distant sources,
which is feasible only with large telescopes and highly-sensitive instrumentation.
For these reasons, advances in technology are likely to make the high redshift universe
an important frontier of cosmology over the coming decade. This eort will involve large
(30 m) ground-based telescopes and will culminate in the launch of the successor to the Hubble
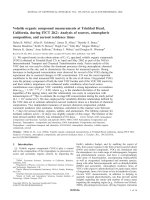
Space Telescope, called Next Generation Space Telescope (NGST). Fig. 2 shows an artist’s
illustration of this telescope which is currently planned for launch in 2009. NGST will image
the ÿrst sources of light that formed in the universe. With its exceptional sub-nJy (1 nJy =
10
−32
erg cm
−2
s
−1
Hz
−1
) sensitivity in the 1–3:5 m infrared regime, NGST is ideally suited
for probing optical-UV emission from sources at redshifts
¿10, just when popular cold dark
matter models for structure formation predict the ÿrst baryonic objects to have collapsed.
The study of the formation of the ÿrst generation of sources at early cosmic times (high
redshifts) holds the key to constraining the power-spectrum of density uctuations on small
R. Barkana, A. Loeb / Physics Reports 349 (2001) 125–238 129
Fig. 1. Milestones in the evolution of the universe from simplicity to complexity. The “end of the dark ages”
bridges between the recombination epoch probed by microwave anisotropy experiments (z
∼ 10
3
) and the horizon
of current observations (z
∼ 5–6).
scales. Previous research in cosmology has been dominated by studies of large-scale structure
(LSS); future studies are likely to focus on small-scale structure (SSS).
The ÿrst sources are a direct consequence of the growth of linear density uctuations. As such,
they emerge from a well-deÿned set of initial conditions and the physics of their formation can
be followed precisely by computer simulation. The cosmic initial conditions for the formation
of the ÿrst generation of stars are much simpler than those responsible for star formation in
the Galactic interstellar medium at present. The cosmic conditions are fully speciÿed by the
primordial power spectrum of Gaussian density uctuations, the mean density of dark matter,
the initial temperature and density of the cosmic gas, and the primordial composition according
130 R. Barkana, A. Loeb / Physics Reports 349 (2001) 125–238
Fig. 2. Artist’s illustration of one of the current designs (GSFC) of the next generation space telescope. More
details about the telescope can be found at http:==ngst.gsfc.nasa.gov=.
to Big-Bang nucleosynthesis. The chemistry is much simpler in the absence of metals and the
gas dynamics is much simpler in the absence of both dynamically signiÿcant magnetic ÿelds
and feedback from luminous objects.
The initial mass function of the ÿrst stars and black holes is therefore determined by a simple
set of initial conditions (although subsequent generations of stars are aected by feedback from
photoionization heating and metal enrichment). While the early evolution of the seed density
uctuations can be fully described analytically, the collapse and fragmentation of non-linear
structure must be simulated numerically. The ÿrst baryonic objects connect the simple initial
state of the universe to its complex current state, and their study with hydrodynamic simulations
(e.g., Abel et al., 1998a; Abel et al., 2000; Bromm et al., 1999) and with future telescopes
such as NGST oers the key to advancing our knowledge on the formation physics of stars
and massive black holes.
The ÿrst light from stars and quasars ended the “dark ages”
2
of the universe and initiated a
“renaissance of enlightenment” in the otherwise fading glow of the microwave background (see
Fig. 1). It is easy to see why the mere conversion of trace amounts of gas into stars or black
holes at this early epoch could have had a dramatic eect on the ionization state and temperature
of the rest of the gas in the universe. Nuclear fusion releases
∼7×10
6
eV per hydrogen atom, and
2
The use of this term in the cosmological context was coined by Sir Martin Rees.
R. Barkana, A. Loeb / Physics Reports 349 (2001) 125–238 131
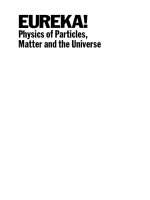
Fig. 3. Optical spectrum of the highest-redshift known quasar at z =5:8, discovered by the Sloan Digital Sky Survey
(Fan et al., 2000).
thin-disk accretion onto a Schwarzschild black hole releases ten times more energy; however,
the ionization of hydrogen requires only 13:6 eV. It is therefore sucient to convert a small
fraction,
∼10
−5
of the total baryonic mass into stars or black holes in order to ionize the rest of
the universe. (The actual required fraction is higher by at least an order of magnitude (Bromm
et al., 2000) because only some of the emitted photons are above the ionization threshold of
13.6 eV and because each hydrogen atom recombines more than once at redshifts z
¿7). Recent
calculations of structure formation in popular CDM cosmologies imply that the universe was
ionized at z
∼ 7–12 (Haiman and Loeb, 1998, 1999b, c; Gnedin and Ostriker, 1997; Chiu and
Ostriker, 2000; Gnedin, 2000a) and has remained ionized ever since. Current observations are
at the threshold of probing this epoch of reionization, given the fact that galaxies and quasars
at redshifts
∼6 are being discovered (Fan et al., 2000; Stern et al., 2000). One of these sources
is a bright quasar at z =5:8 whose spectrum is shown in Fig. 3. The plot indicates that there
is transmitted ux short-ward of the Ly wavelength at the quasar redshift. The optical depth
at these wavelengths of the uniform cosmic gas in the intergalactic medium is however (Gunn
and Peterson, 1965),
s
=
e
2
f
n
HI
(z
s
)
m
e
cH (z
s
)
≈ 6:45 × 10
5
x
HI
b
h
0:03
m
0:3
−1=2
1+z
s
10
3=2
; (1)
where H
≈ 100h km s
−1
Mpc
−1
1=2
m
(1 + z
s
)
3=2
is the Hubble parameter at the source redshift z
s
,
f
=0:4162 and
=1216
A, are the oscillator strength and the wavelength of the Ly transition;
n
HI
(z
s
) is the neutral hydrogen density at the source redshift (assuming primordial abundances);
m
and
b
are the present-day density parameters of all matter and of baryons, respectively;
and x
HI
is the average fraction of neutral hydrogen. In the second equality we have implicitly
considered high redshifts (see Eqs. (9) and (10) in Section 2.1). Modeling of the transmitted
ux (Fan et al., 2000) implies
s
¡ 0:5orx
HI
610
−6
, i.e., the low-density gas throughout the
universe is fully ionized at z =5:8! One of the important challenges for future observations will
132 R. Barkana, A. Loeb / Physics Reports 349 (2001) 125–238
Fig. 4. Stages in the reionization of hydrogen in the intergalactic medium.
be to identify when and how the intergalactic medium was ionized. Theoretical calculations
(see Section 6.3.1) imply that such observations are just around the corner.
Fig. 4 shows schematically the various stages in a theoretical scenario for the history of
hydrogen reionization in the intergalactic medium. The ÿrst gaseous clouds collapse at redshifts
∼20–30 and fragment into stars due to molecular hydrogen (H
2
) cooling. However, H
2
is fragile
and can be easily dissociated by a small ux of UV radiation. Hence the bulk of the radiation
that ionized the universe is emitted from galaxies with a virial temperature
¿
10
4
K, where
atomic cooling is eective and allows the gas to fragment (see the end of Section 3.3 for an
alternative scenario).
Since recent observations conÿne the standard set of cosmological parameters to a relatively
narrow range, we assume a CDM cosmology with a particular standard set of parameters in
the quantitative results in this review. For the contributions to the energy density, we assume
ratios relative to the critical density of
m
=0:3,
=0:7, and
b
=0:045, for matter, vacuum
(cosmological constant), and baryons, respectively. We also assume a Hubble constant H
0
=
100h km s
−1
Mpc
−1
with h =0:7, and a primordial scale invariant (n = 1) power spectrum with
8
=0:9, where
8
is the root-mean-square amplitude of mass uctuations in spheres of radius
8h
−1
Mpc. These parameter values are based primarily on the following observational results:
CMB temperature anisotropy measurements on large scales (Bennett et al., 1996) and on the
scale of
∼1
◦
(Lange et al., 2000; Balbi et al., 2000); the abundance of galaxy clusters locally
(Viana and Liddle 1999; Pen, 1998; Eke et al., 1996) and as a function of redshift (Bahcall and
Fan, 1998; Eke et al., 1998); the baryon density inferred from big bang nucleosynthesis (see
the review by Tytler et al., 2000); distance measurements used to derive the Hubble constant
R. Barkana, A. Loeb / Physics Reports 349 (2001) 125–238 133
(Mould et al., 2000; Jha et al., 1999; Tonry et al., 1997; but see Theureau et al., 1997; Parodi
et al., 2000); and indications of cosmic acceleration from distances based on type Ia supernovae
(Perlmutter et al., 1999; Riess et al., 1998).
This review summarizes recent theoretical advances in understanding the physics of the ÿrst
generation of cosmic structures. Although the literature on this subject extends all the way back
to the 1960s (Saslaw and Zipoy, 1967; Peebles and Dicke, 1968; Hirasawa, 1969; Matsuda
et al., 1969; Hutchins, 1976; Silk, 1983; Palla et al., 1983; Lepp and Shull, 1984; Couchman,
1985; Couchman and Rees, 1986; Lahav, 1986), this review focuses on the progress made over
the past decade in the modern context of CDM cosmologies.
2. Hierarchical formation of cold dark matter halos
2.1. The expanding universe
The modern physical description of the universe as a whole can be traced back to Einstein,
who argued theoretically for the so-called “cosmological principle”: that the distribution of
matter and energy must be homogeneous and isotropic on the largest scales. Today isotropy
is well established (see the review by Wu et al., 1999) for the distribution of faint radio
sources, optically-selected galaxies, the X-ray background, and most importantly the cosmic
microwave background (henceforth, CMB; see, e.g., Bennett et al., 1996). The constraints on
homogeneity are less strict, but a cosmological model in which the universe is isotropic but
signiÿcantly inhomogeneous in spherical shells around our special location is also excluded
(Goodman, 1995).
In general relativity, the metric for a space which is spatially homogeneous and isotropic is
the Robertson–Walker metric, which can be written in the form
ds
2
=dt
2
− a
2
(t)
dR
2
1 − kR
2
+ R
2
(dÂ
2
+ sin
2
 d
2
)
; (2)
where a(t) is the cosmic scale factor which describes expansion in time, and (R; Â; ) are
spherical comoving coordinates. The constant k determines the geometry of the metric; it is
positive in a closed universe, zero in a at universe, and negative in an open universe. Observers
at rest remain at rest, at ÿxed (R; Â; ), with their physical separation increasing with time in
proportion to a(t). A given observer sees a nearby observer at physical distance D receding at
the Hubble velocity H(t)D, where the Hubble constant at time t is H(t)=dlna(t)=dt. Light
emitted by a source at time t is observed at t = 0 with a redshift z =1=a(t)
− 1, where we set
a(t =0)
≡ 1.
The Einstein ÿeld equations of general relativity yield the Friedmann equation (e.g., Weinberg,
1972; Kolb and Turner, 1990)
H
2
(t)=
8G
3
−
k
a
2
; (3)
which relates the expansion of the universe to its matter-energy content. For each component
of the energy density , with an equation of state p = p(), the density varies with a(t)
134 R. Barkana, A. Loeb / Physics Reports 349 (2001) 125–238
according to the equation of energy conservation
d(R
3
)=−pd(R
3
) : (4)
With the critical density
C
(t) ≡
3H
2
(t)
8G
; (5)
deÿned as the density needed for k = 0, we deÿne the ratio of the total density to the critical
density as
≡
C
: (6)
With
m
,
, and
r
denoting the present contributions to from matter (including cold dark
matter as well as a contribution
b
from baryons), vacuum density (cosmological constant),
and radiation, respectively, the Friedmann equation becomes
H (t)
H
0
=
m
a
3
+
+
r
a
4
+
k
a
2
1=2
; (7)
where we deÿne H
0
and
0
=
m
+
+
r
to be the present values of H and , respectively,
and we let
k
≡−
k
H
2
0
=1−
0
: (8)
In the particularly simple Einstein–de Sitter model (
m
=1,
=
r
=
k
= 0), the scale factor
varies as a(t)
˙ t
2=3
. Even models with non-zero
or
k
approach the Einstein–de Sitter
behavior at high redshifts, i.e., when
(1 + z)
max[(1 −
m
−
)=
m
; (
=
m
)
1=3
] (9)
(as long as
r
can be neglected). The Friedmann equation implies that models with
k
=0
converge to the Einstein–de Sitter limit faster than do open models. E.g., for
m
=0:3 and
=0:7 Eq. (9) corresponds to the condition z1:3, which is easily satisÿed by the reionization
redshift. In this high-z regime, H (t)
≈ 2=(3t), and the age of the universe is
t
≈
2
3H
0
√
m
(1 + z)
−3=2
=5:38 × 10
8
1+z
10
−3=2
yr ; (10)
where in the last expression we assumed our standard cosmological parameters (see the end of
Section 1).
In the standard hot Big-Bang model, the universe is initially hot and the energy density is
dominated by radiation. The transition to matter domination occurs at z
∼ 10
4
, but the universe
R. Barkana, A. Loeb / Physics Reports 349 (2001) 125–238 135
remains hot enough that the gas is ionized, and electron–photon scattering eectively couples
the matter and radiation. At z
∼ 1200 the temperature drops below ∼3300 K and protons and
electrons recombine to form neutral hydrogen. The photons then decouple and travel freely until
the present, when they are observed as the CMB.
2.2. Linear gravitational growth
Observations of the CMB (e.g., Bennett et al., 1996) show that the universe at recombination
was extremely uniform, but with spatial uctuations in the energy density and gravitational
potential of roughly one part in 10
5
. Such small uctuations, generated in the early universe,
grow over time due to gravitational instability, and eventually lead to the formation of galaxies
and the large scale structure observed in the present universe.
As in the previous section, we distinguish between ÿxed and comoving coordinates. Using
vector notation, the ÿxed coordinate r corresponds to a comoving position x = r=a. In a homo-
geneous universe with density , we describe the cosmological expansion in terms of an ideal
pressure-less uid of particles each of which is at ÿxed x, expanding with the Hubble ow
v = H (t)r where v =dr=dt. Onto this uniform expansion we impose small perturbations, given
by a relative density perturbation
(x)=
(r)
− 1 ; (11)
where the mean uid density is , with a corresponding peculiar velocity u
≡ v − Hr. Then
the uid is described by the continuity and Euler equations in comoving coordinates (Peebles,
1980, 1993)
9
9t
+
1
a
∇ · [(1 + )u]=0; (12)
9u
9t
+ H u +
1
a
(u
· ∇)u = −
1
a
∇: (13)
The potential is given by the Poisson equation, in terms of the density perturbation
∇
2
=4G a
2
: (14)
This uid description is valid for describing the evolution of collisionless cold dark matter
particles until dierent particle streams cross. This “shell-crossing” typically occurs only after
perturbations have grown to become non-linear, and at that point the individual particle trajec-
tories must in general be followed. Similarly, baryons can be described as a pressure-less uid
as long as their temperature is negligibly small, but non-linear collapse leads to the formation
of shocks in the gas.
For small perturbations
1, the uid equations can be linearized and combined to yield
9
2
9t
2
+2H
9
9t
=4G : (15)
136 R. Barkana, A. Loeb / Physics Reports 349 (2001) 125–238
This linear equation has in general two independent solutions, only one of which grows with
time. Starting with random initial conditions, this “growing mode” comes to dominate the density
evolution. Thus, until it becomes non-linear, the density perturbation maintains its shape in
comoving coordinates and grows in proportion to a growth factor D(t). The growth factor is in
general given by (Peebles, 1980)
D(t)
˙
(
a
3
+
k
a +
m
)
1=2
a
3=2
a
a
3=2
da
(
a
3
+
k
a +
m
)
3=2
; (16)
where we neglect
r
when considering halos forming at z10
4
. In the Einstein–de Sitter model
(or, at high redshift, in other models as well) the growth factor is simply proportional to a(t).
The spatial form of the initial density uctuations can be described in Fourier space, in terms
of Fourier components
k
=
d
3
x(x)e
−ik·x
: (17)
Here we use the comoving wavevector k, whose magnitude k is the comoving wavenumber
which is equal to 2 divided by the wavelength. The Fourier description is particularly simple for
uctuations generated by ination (e.g., Kolb and Turner, 1990). Ination generates perturbations
given by a Gaussian random ÿeld, in which dierent k-modes are statistically independent, each
with a random phase. The statistical properties of the uctuations are determined by the variance
of the dierent k-modes, and the variance is described in terms of the power spectrum P(k)as
follows:
k
∗
k
=(2)
3
P(k)
(3)
(k − k
) ; (18)
where
(3)
is the three-dimensional Dirac delta function.
In standard models, ination produces a primordial power-law spectrum P(k)
˙ k
n
with n ∼ 1.
Perturbation growth in the radiation-dominated and then matter-dominated universe results in a
modiÿed ÿnal power spectrum, characterized by a turnover at a scale of order the horizon cH
−1
at matter-radiation equality, and a small-scale asymptotic shape of P(k) ˙ k
n−4
. On large scales
the power spectrum evolves in proportion to the square of the growth factor, and this simple
evolution is termed linear evolution. On small scales, the power spectrum changes shape due
to the additional non-linear gravitational growth of perturbations, yielding the full, non-linear
power spectrum. The overall amplitude of the power spectrum is not speciÿed by current models
of ination, and it is usually set observationally using the CMB temperature uctuations or local
measures of large-scale structure.
Since density uctuations may exist on all scales, in order to determine the formation of
objects of a given size or mass it is useful to consider the statistical distribution of the smoothed
density ÿeld. Using a window function W (y) normalized so that
d
3
y W (y) = 1, the smoothed
density perturbation ÿeld,
d
3
y(x + y)W (y), itself follows a Gaussian distribution with zero
mean. For the particular choice of a spherical top-hat, in which W = 1 in a sphere of radius
R and is zero outside, the smoothed perturbation ÿeld measures the uctuations in the mass in
spheres of radius R. The normalization of the present power spectrum is often speciÿed by the
R. Barkana, A. Loeb / Physics Reports 349 (2001) 125–238 137
value of
8
≡ (R =8h
−1
Mpc). For the top-hat, the smoothed perturbation ÿeld is denoted
R
or
M
, where the mass M is related to the comoving radius R by M =4
m
R
3
=3, in terms of
the current mean density of matter
m
. The variance
M
2
is
2
(M )=
2
(R)=
∞
0
dk
2
2
k
2
P(k)
3j
1
(kR)
kR
2
; (19)
where j
1
(x) = (sin x − x cos x)=x
2
. The function (M ) plays a crucial role in estimates of the
abundance of collapsed objects, as described below.
2.3. Formation of non-linear objects
The small density uctuations evidenced in the CMB grow over time as described in the
previous subsection, until the perturbation becomes of order unity, and the full non-linear
gravitational problem must be considered. The dynamical collapse of a dark matter halo can
be solved analytically only in cases of particular symmetry. If we consider a region which
is much smaller than the horizon cH
−1
, then the formation of a halo can be formulated as
a problem in Newtonian gravity, in some cases with minor corrections coming from General
Relativity. The simplest case is that of spherical symmetry, with an initial (t = t
i
t
0
) top-hat
of uniform overdensity
i
inside a sphere of radius R. Although this model is restricted in its
direct applicability, the results of spherical collapse have turned out to be surprisingly useful in
understanding the properties and distribution of halos in models based on cold dark matter.
The collapse of a spherical top-hat is described by the Newtonian equation (with a correction
for the cosmological constant)
d
2
r
dt
2
= H
2
0
r −
GM
r
2
; (20)
where r is the radius in a ÿxed (not comoving) coordinate frame, H
0
is the present Hubble
constant, M is the total mass enclosed within radius r, and the initial velocity ÿeld is given by
the Hubble ow dr=dt =H(t)r. The enclosed grows initially as
L
=
i
D(t)=D(t
i
), in accordance
with linear theory, but eventually grows above
L
. If the mass shell at radius r is bound (i.e.,
if its total Newtonian energy is negative) then it reaches a radius of maximum expansion and
subsequently collapses. At the moment when the top-hat collapses to a point, the overdensity
predicted by linear theory is (Peebles, 1980)
L
=1:686 in the Einstein–de Sitter model, with
only a weak dependence on
m
and
. Thus a top-hat collapses at redshift z if its linear
overdensity extrapolated to the present day (also termed the critical density of collapse) is
crit
(z)=
1:686
D(z)
; (21)
where we set D(z =0)=1.
Even a slight violation of the exact symmetry of the initial perturbation can prevent the
top-hat from collapsing to a point. Instead, the halo reaches a state of virial equilibrium by
violent relaxation (phase mixing). Using the virial theorem U =
−2K to relate the potential
138 R. Barkana, A. Loeb / Physics Reports 349 (2001) 125–238
energy U to the kinetic energy K in the ÿnal state, the ÿnal overdensity relative to the critical
density at the collapse redshift is
c
=18
2
178 in the Einstein–de Sitter model, modiÿed in
a universe with
m
+
= 1 to the ÿtting formula (Bryan and Norman, 1998)
c
=18
2
+82d − 39d
2
; (22)
where d
≡
z
m
− 1 is evaluated at the collapse redshift, so that
z
m
=
m
(1 + z)
3
m
(1 + z)
3
+
+
k
(1 + z)
2
: (23)
A halo of mass M collapsing at redshift z thus has a (physical) virial radius
r
vir
=0:784
M
10
8
h
−1
M
1=3
m
z
m
c
18
2
−1=3
1+z
10
−1
h
−1
kpc ; (24)
and a corresponding circular velocity,
V
c
=
GM
r
vir
1=2
=23:4
M
10
8
h
−1
M
1=3
m
z
m
c
18
2
1=6
1+z
10
1=2
km s
−1
: (25)
In these expressions we have assumed a present Hubble constant written in the form H
0
=
100h km s
−1
Mpc
−1
. We may also deÿne a virial temperature
T
vir
=
m
p
V
2
c
2k
B
=1:98 × 10
4
0:6
M
10
8
h
−1
M
2=3
m
z
m
c
18
2
1=3
1+z
10
K ; (26)
where is the mean molecular weight and m
p
is the proton mass. Note that the value of
depends on the ionization fraction of the gas; =0:59 for a fully ionized primordial gas,
=0:61 for a gas with ionized hydrogen but only singly ionized helium, and =1:22 for
neutral primordial gas. The binding energy of the halo is approximately
3
E
b
=
1
2
GM
2
r
vir
=5:45 × 10
53
M
10
8
h
−1
M
5=3
m
z
m
c
18
2
1=3
1+z
10
h
−1
erg : (27)
Note that the binding energy of the baryons is smaller by a factor equal to the baryon fraction
b
=
m
.
Although spherical collapse captures some of the physics governing the formation of halos,
structure formation in cold dark matter models proceeds hierarchically. At early times, most of
the dark matter is in low-mass halos, and these halos continuously accrete and merge to form
high-mass halos. Numerical simulations of hierarchical halo formation indicate a roughly uni-
versal spherically-averaged density proÿle for the resulting halos (Navarro et al., 1997, hereafter
3
The coecient of 1=2 in Eq. (27) would be exact for a singular isothermal sphere, (r) ˙ 1=r
2
.
R. Barkana, A. Loeb / Physics Reports 349 (2001) 125–238 139
NFW), though with considerable scatter among dierent halos (e.g., Bullock et al., 2000). The
NFW proÿle has the form
(r)=
3H
2
0
8G
(1 + z)
3
m
z
m
c
c
N
x(1 + c
N
x)
2
; (28)
where x = r=r
vir
, and the characteristic density
c
is related to the concentration parameter
c
N
by
c
=
c
3
c
3
N
ln(1 + c
N
) − c
N
=(1 + c
N
)
: (29)
The concentration parameter itself depends on the halo mass M, at a given redshift z.
We note that the dense, cuspy halo proÿle predicted by CDM models is not apparent in the
mass distribution derived from measurements of the rotation curves of dwarf galaxies (e.g., de
Blok and McGaugh, 1997; Salucci and Burkert, 2000), although observational and modeling
uncertainties may preclude a ÿrm conclusion at present (van den Bosch et al., 2000; Swaters
et al., 2000).
2.4. The abundance of dark matter halos
In addition to characterizing the properties of individual halos, a critical prediction of any
theory of structure formation is the abundance of halos, i.e., the number density of halos as
a function of mass, at any redshift. This prediction is an important step toward inferring the
abundances of galaxies and galaxy clusters. While the number density of halos can be measured
for particular cosmologies in numerical simulations, an analytic model helps us gain physical
understanding and can be used to explore the dependence of abundances on all the cosmological
parameters.
A simple analytic model which successfully matches most of the numerical simulations was
developed by Press and Schechter (1974). The model is based on the ideas of a Gaussian
random ÿeld of density perturbations, linear gravitational growth, and spherical collapse. To
determine the abundance of halos at a redshift z,weuse
M
, the density ÿeld smoothed on a
mass scale M, as deÿned in Section 2.2. Although the model is based on the initial conditions,
it is usually expressed in terms of redshift-zero quantities. Thus, we use the linearly extrapolated
density ÿeld, i.e., the initial density ÿeld at high redshift extrapolated to the present by simple
multiplication by the relative growth factor (see Section 2.2). Similarly, in this section the
‘present power spectrum’ refers to the initial power spectrum, linearly extrapolated to the present
without including non-linear evolution. Since
M
is distributed as a Gaussian variable with zero
mean and standard deviation (M ) (which depends only on the present power spectrum, see
Eq. (19)), the probability that
M
is greater than some equals
∞
d
M
1
√
2(M )
exp
−
2
M
2
2
(M )
=
1
2
erfc
√
2
: (30)
140 R. Barkana, A. Loeb / Physics Reports 349 (2001) 125–238
The fundamental ansatz is to identify this probability with the fraction of dark matter particles
which are part of collapsed halos of mass greater than M , at redshift z. There are two additional
ingredients: First, the value used for is
crit
(z) given in Eq. (21), which is the critical density
of collapse found for a spherical top-hat (extrapolated to the present since (M ) is calculated
using the present power spectrum); and second, the fraction of dark matter in halos above M
is multiplied by an additional factor of 2 in order to ensure that every particle ends up as part
of some halo with M¿0. Thus, the ÿnal formula for the mass fraction in halos above M at
redshift z is
F(¿M
|z) = erfc
crit
(z)
√
2
: (31)
This ad-hoc factor of 2 is necessary, since otherwise only positive uctuations of
M
would
be included. Bond et al. (1991) found an alternate derivation of this correction factor, using a
dierent ansatz. In their derivation, the factor of 2 has a more satisfactory origin, namely the
so-called “cloud-in-cloud” problem: For a given mass M , even if
M
is smaller than
crit
(z),
it is possible that the corresponding region lies inside a region of some larger mass M
L
¿M,
with
M
L
¿
crit
(z). In this case the original region should be counted as belonging to a halo
of mass M
L
. Thus, the fraction of particles which are part of collapsed halos of mass greater
than M is larger than the expression given in Eq. (30). Bond et al. showed that, under certain
assumptions, the additional contribution results precisely in a factor of 2 correction.
Dierentiating the fraction of dark matter in halos above M yields the mass distribution.
Letting dn be the comoving number density of halos of mass between M and M +dM ,we
have
dn
dM
=
2
m
M
−d(ln )
dM
c
e
−
2
c
=2
; (32)
where
c
=
crit
(z)=(M ) is the number of standard deviations which the critical collapse over-
density represents on mass scale M . Thus, the abundance of halos depends on the two functions
(M ) and
crit
(z), each of which depends on the energy content of the universe and the values
of the other cosmological parameters. We illustrate the abundance of halos for our standard
choice of the CDM model with
m
=0:3 (see the end of Section 1).
Fig. 5 shows (M ) and
crit
(z), with the input power spectrum computed from Eisenstein
and Hu (1999). The solid line is (M ) for the cold dark matter model with the parameters
speciÿed above. The horizontal dotted lines show the value of
crit
(z)atz =0; 2; 5; 10; 20 and 30,
as indicated in the ÿgure. From the intersection of these horizontal lines with the solid line we
infer, e.g., that at z =5a1
− uctuation on a mass scale of 2 ×10
7
M
will collapse. On the
other hand, at z = 5 collapsing halos require a 2
− uctuation on a mass scale of 3 ×10
10
M
,
since (M ) on this mass scale equals about half of
crit
(z = 5). Since at each redshift a ÿxed
fraction (31:7%) of the total dark matter mass lies in halos above the 1
− mass, Fig. 5 shows
that most of the mass is in small halos at high redshift, but it continuously shifts toward higher
characteristic halo masses at lower redshift. Note also that (M ) attens at low masses because
of the changing shape of the power spectrum. Since
→∞as M → 0, in the cold dark matter
R. Barkana, A. Loeb / Physics Reports 349 (2001) 125–238 141
Fig. 5. Mass uctuations and collapse thresholds in cold dark matter models. The horizontal dotted lines show the
value of the extrapolated collapse overdensity
crit
(z) at the indicated redshifts. Also shown is the value of (M )
for the cosmological parameters given in the text (solid curve), as well as (M ) for a power spectrum with a cuto
below a mass M =1:7
× 10
8
M
(short-dashed curve), or M =1:7 × 10
11
M
(long-dashed curve). The intersection
of the horizontal lines with the other curves indicate, at each redshift z, the mass scale (for each model) at which
a1
− uctuation is just collapsing at z (see the discussion in the text).
model all the dark matter is tied up in halos at all redshifts, if suciently low-mass halos are
considered.
Also shown in Fig. 5 is the eect of cutting o the power spectrum on small scales. The
short-dashed curve corresponds to the case where the power spectrum is set to zero above a
comoving wavenumber k = 10 Mpc
−1
, which corresponds to a mass M =1:7 × 10
8
M
. The
long-dashed curve corresponds to a more radical cuto above k = 1 Mpc
−1
, or below M =1:7 ×
10
11
M
. A cuto severely reduces the abundance of low-mass halos, and the ÿnite value of
(M = 0) implies that at all redshifts some fraction of the dark matter does not fall into halos.
At high redshifts where
crit
(z)(M = 0), all halos are rare and only a small fraction of the
dark matter lies in halos. In particular, this can aect the abundance of halos at the time of
reionization, and thus the observed limits on reionization constrain scenarios which include a
small-scale cuto in the power spectrum (Barkana et al., 2000).
In Figs. 6 –9 we show explicitly the properties of collapsing halos which represent 1
− ,
2
−, and 3 − uctuations (corresponding in all cases to the curves in order from bottom to
top), as a function of redshift. No cuto is applied to the power spectrum. Fig. 6 shows the
halo mass, Fig. 7 the virial radius, Fig. 8 the virial temperature (with in Eq. (26) set equal
to 0:6, although low temperature halos contain neutral gas) as well as circular velocity, and
Fig. 9 shows the total binding energy of these halos. In Figs. 6 and 8, the dashed curves indicate
the minimum virial temperature required for ecient cooling (see Section 3.3) with primordial
atomic species only (upper curve) or with the addition of molecular hydrogen (lower curve).
142 R. Barkana, A. Loeb / Physics Reports 349 (2001) 125–238
Fig. 6. Characteristic properties of collapsing halos: Halo mass. The solid curves show the mass of collapsing halos
which correspond to 1
− ,2− , and 3 − uctuations (in order from bottom to top). The dashed curves show
the mass corresponding to the minimum temperature required for ecient cooling with primordial atomic species
only (upper curve) or with the addition of molecular hydrogen (lower curve).
Fig. 7. Characteristic properties of collapsing halos: Halo virial radius. The curves show the virial radius of collapsing
halos which correspond to 1
− ,2− , and 3 − uctuations (in order from bottom to top).
Fig. 9 shows the binding energy of dark matter halos. The binding energy of the baryons is a
factor
∼
b
=
m
∼ 15% smaller, if they follow the dark matter. Except for this constant factor,
the ÿgure shows the minimum amount of energy that needs to be deposited into the gas in
order to unbind it from the potential well of the dark matter. For example, the hydrodynamic
energy released by a single supernovae,
∼10
51
erg, is sucient to unbind the gas in all 1 −
halos at z
¿5 and in all 2 − halos at z¿12.
At z =5, the halo masses which correspond to 1
−,2−, and 3− uctuations are 1:8×10
7
,
3:0
×10
10
, and 7:0 ×10
11
M
, respectively. The corresponding virial temperatures are 2:0 ×10
3
,
2:8
× 10
5
, and 2:3 × 10
6
K. The equivalent circular velocities are 7.5, 88, and 250 km s
−1
.At
z = 10, the 1
−,2−, and 3 − uctuations correspond to halo masses of 1:3 ×10
3
,5:7×10
7
,
and 4:8
× 10
9
M
, respectively. The corresponding virial temperatures are 6.2, 7:9 × 10
3
, and
1:5
× 10
5
K. The equivalent circular velocities are 0.41, 15, and 65 km s
−1
. Atomic cooling is
ecient at T
vir
¿10
4
K, or a circular velocity V
c
¿17 km s
−1
. This corresponds to a 1:2 −
uctuation and a halo mass of 2:1
×10
8
M
at z =5,anda2:1 − uctuation and a halo mass
of 8:3
×10
7
M
at z = 10. Molecular hydrogen provides ecient cooling down to T
vir
∼ 300 K,
or a circular velocity V
c
∼ 2:0kms
−1
. This corresponds to a 0:76 − uctuation and a halo
mass of 3:5
× 10
5
M
at z =5,anda1:3 − uctuation and a halo mass of 1:4 × 10
5
M
at
z = 10.
In Fig. 10 we show the halo mass function dn=dln(M) at several dierent redshifts: z =0
(solid curve), z = 5 (dotted curve), z = 10 (short-dashed curve), z = 20 (long-dashed curve), and
R. Barkana, A. Loeb / Physics Reports 349 (2001) 125–238 143
Fig. 8. Characteristic properties of collapsing halos: Halo virial temperature and circular velocity. The solid curves
show the virial temperature (or, equivalently, the circular velocity) of collapsing halos which correspond to 1
− ,
2
− , and 3 − uctuations (in order from bottom to top). The dashed curves show the minimum temperature
required for ecient cooling with primordial atomic species only (upper curve) or with the addition of molecular
hydrogen (lower curve).
Fig. 9. Characteristic properties of collapsing halos: Halo binding energy. The curves show the total binding energy
of collapsing halos which correspond to 1
− ,2− , and 3 − uctuations (in order from bottom to top).
Fig. 10. Halo mass function at several redshifts: z = 0 (solid curve), 5 (dotted curve), 10 (short-dashed curve), 20
(long-dashed curve), and 30 (dot–dashed curve).
144 R. Barkana, A. Loeb / Physics Reports 349 (2001) 125–238
z = 30 (dot–dashed curve). Note that the mass function does not decrease monotonically with
redshift at all masses. At the lowest masses, the abundance of halos is higher at z¿0 than
at z =0.
3. Gas infall and cooling in dark matter halos
3.1. Cosmological Jeans mass
The Jeans length
J
was originally deÿned (Jeans, 1928) in Newtonian gravity as the critical
wavelength that separates oscillatory and exponentially growing density perturbations in an
inÿnite, uniform, and stationary distribution of gas. On scales ‘ smaller than
J
, the sound
crossing time, ‘=c
s
is shorter than the gravitational free-fall time, (G)
−1=2
, allowing the build-up
of a pressure force that counteracts gravity. On larger scales, the pressure gradient force is too
slow to react to a build-up of the attractive gravitational force. The Jeans mass is deÿned as
the mass within a sphere of radius
J
=2, M
J
=(4=3)(
J
=2)
3
. In a perturbation with a mass
greater than M
J
, the self-gravity cannot be supported by the pressure gradient, and so the gas is
unstable to gravitational collapse. The Newtonian derivation of the Jeans instability suers from
a conceptual inconsistency, as the unperturbed gravitational force of the uniform background
must induce bulk motions (compare Binney and Tremaine, 1987). However, this inconsistency
is remedied when the analysis is done in an expanding universe.
The perturbative derivation of the Jeans instability criterion can be carried out in a cosmo-
logical setting by considering a sinusoidal perturbation superposed on a uniformly expanding
background. Here, as in the Newtonian limit, there is a critical wavelength
J
that separates
oscillatory and growing modes. Although the expansion of the background slows down the
exponential growth of the amplitude to a power-law growth, the fundamental concept of a min-
imum mass that can collapse at any given time remains the same (see, e.g. Kolb and Turner,
1990; Peebles, 1993).
We consider a mixture of dark matter and baryons with density parameters
z
dm
=
dm
=
c
and
z
b
=
b
=
c
, where
dm
is the average dark matter density,
b
is the average baryonic density,
c
is the critical density, and
z
dm
+
z
b
=
z
m
is given by Eq. (23). We also assume spatial
uctuations in the gas and dark matter densities with the form of a single spherical Fourier
mode on a scale much smaller than the horizon,
dm
(r; t) −
dm
(t)
dm
(t)
=
dm
(t)
sin(kr)
kr
; (33)
b
(r; t) −
b
(t)
b
(t)
=
b
(t)
sin(kr)
kr
; (34)
where
dm
(t) and
b
(t) are the background densities of the dark matter and baryons,
dm
(t) and
b
(t) are the dark matter and baryon overdensity amplitudes, r is the comoving radial coordinate,
and k is the comoving perturbation wavenumber. We adopt an ideal gas equation-of-state for
R. Barkana, A. Loeb / Physics Reports 349 (2001) 125–238 145
the baryons with a speciÿc heat ratio =5=3. Initially, at time t = t
i
, the gas temperature is
uniform T
b
(r; t
i
)=T
i
, and the perturbation amplitudes are small
dm;i
;
b;i
1. We deÿne the
region inside the ÿrst zero of sin(kr)=(kr), namely 0 ¡kr¡, as the collapsing “object”.
The evolution of the temperature of the baryons T
b
(r; t) in the linear regime is determined
by the coupling of their free electrons to the cosmic microwave background (CMB) through
Compton scattering, and by the adiabatic expansion of the gas. Hence, T
b
(r; t) is generally
somewhere between the CMB temperature, T
˙ (1 + z)
−1
and the adiabatically scaled temper-
ature T
ad
˙ (1 + z)
−2
. In the limit of tight coupling to T
, the gas temperature remains uniform.
On the other hand, in the adiabatic limit, the temperature develops a gradient according to the
relation
T
b
˙
(−1)
b
: (35)
The evolution of dark matter overdensity,
dm
(t), in the linear regime is described by the
equation (see Section 9:3:2 of Kolb and Turner, 1990),
dm
+2H
˙
dm
=
3
2
H
2
(
b
b
+
dm
dm
) ; (36)
whereas the evolution of the overdensity of the baryons,
b
(t), is described by
b
+2H
˙
b
=
3
2
H
2
(
b
b
+
dm
dm
) −
k
B
T
i
m
p
k
a
2
a
i
a
(1+ÿ)
b
+
2
3
ÿ[
b
−
b;i
]
: (37)
Here, H (t)= ˙a=a is the Hubble parameter at a cosmological time t, and =1:22 is the mean
molecular weight of the neutral primordial gas in atomic units. The parameter ÿ distinguishes
between the two limits for the evolution of the gas temperature. In the adiabatic limit ÿ =1, and
when the baryon temperature is uniform and locked to the background radiation, ÿ = 0. The last
term on the right hand side (in square brackets) takes into account the extra pressure gradient
force in
∇(
b
T )=(T∇
b
+
b
∇T ), arising from the temperature gradient which develops in
the adiabatic limit. The Jeans wavelength
J
=2=k
J
is obtained by setting the right hand side
of Eq. (37) to zero, and solving for the critical wavenumber k
J
. As can be seen from Eq. (37),
the critical wavelength
J
(and therefore the mass M
J
) is in general time-dependent. We infer
from Eq. (37) that as time proceeds, perturbations with increasingly smaller initial wavelengths
stop oscillating and start to grow.
To estimate the Jeans wavelength, we equate the right hand side of Eq. (37) to zero. We
further approximate
b
∼
dm
, and consider suciently high redshifts at which the universe is
matter-dominated and at (Eqs. (9) and (10) in Section 2.1). We also assume
b
m
, where
m
=
dm
+
b
is the total matter density parameter. Following cosmological recombination at
z
≈ 10
3
, the residual ionization of the cosmic gas keeps its temperature locked to the CMB
temperature (via Compton scattering) down to a redshift of (p. 179 of Peebles, 1993)
1+z
t
≈ 137(
b
h
2
=0:022)
2=5
: (38)
In the redshift range between recombination and z
t
, ÿ = 0 and
k
J
≡ (2=
J
)=[2k
B
T
(0)=3m
p
]
−1=2
m
H
0
; (39)
146 R. Barkana, A. Loeb / Physics Reports 349 (2001) 125–238
so that the Jeans mass is therefore redshift independent and obtains the value (for the total mass
of baryons and dark matter)
M
J
≡
4
3
J
2
3
(0)=1:35 × 10
5
m
h
2
0:15
−1=2
M
: (40)
Based on the similarity of M
J
to the mass of a globular cluster, Peebles and Dicke (1968)
suggested that globular clusters form as the ÿrst generation of baryonic objects shortly after
cosmological recombination. Peebles and Dicke assumed a baryonic universe, with a non-linear
uctuation amplitude on small scales at z
∼ 10
3
, a model which has by now been ruled out.
The lack of a dominant mass of dark matter inside globular clusters (Moore, 1996; Heggie
and Hut, 1995) makes it unlikely that they formed through direct cosmological collapse, and
more likely that they resulted from fragmentation during the process of galaxy formation.
Furthermore, globular clusters have been observed to form in galaxy mergers (e.g., Miller
et al., 1997).
At z
6z
t
, the gas temperature declines adiabatically as [(1 + z)=(1 + z
t
)]
2
(i.e., ÿ = 1) and the
total Jeans mass obtains the value,
M
J
=5:73 × 10
3
m
h
2
0:15
−1=2
b
h
2
0:022
−3=5
1+z
10
3=2
M
: (41)
Note that we have neglected Compton drag, i.e., the radiation force which suppresses gravita-
tional growth of structure in the baryon uid as long as the electron abundance is suciently
high to keep the baryons dynamically coupled to the photons. After cosmological recombination,
the net friction force on the predominantly neutral uid decreases dramatically, allowing the
baryons to fall into dark matter potential wells, and essentially erasing the memory of Compton
drag by z
∼ 100 (e.g., Section 5:3:1. of Hu, 1995).
It is not clear how the value of the Jeans mass derived above relates to the mass of collapsed,
bound objects. The above analysis is perturbative (Eqs. (36), (37) are valid only as long as
b
and
dm
are much smaller than unity), and thus can only describe the initial phase of the
collapse. As
b
and
dm
grow and become larger than unity, the density proÿles start to evolve
and dark matter shells may cross baryonic shells (Haiman et al., 1996a,b) due to their dierent
dynamics. Hence the amount of mass enclosed within a given baryonic shell may increase with
time, until eventually the dark matter pulls the baryons with it and causes their collapse even
for objects below the Jeans mass.
Even within linear theory, the Jeans mass is related only to the evolution of perturbations at
a given time. When the Jeans mass itself varies with time, the overall suppression of the growth
of perturbations depends on a time-averaged Jeans mass. Gnedin and Hui (1998) showed that
the correct time-averaged mass is the ÿltering mass M
F
=(4=3) (2a=k
F
)
3
, in terms of the
comoving wavenumber k
F
associated with the “ÿltering scale”. The wavenumber k
F
is related
to the Jeans wavenumber k
J
by
1
k
2
F
(t)
=
1
D(t)
t
0
dt
a
2
(t
)
D(t
)+2H (t
)
˙
D(t
)
k
2
J
(t
)
t
t
dt
a
2
(t
)
; (42)
R. Barkana, A. Loeb / Physics Reports 349 (2001) 125–238 147
where D(t) is the linear growth factor (Section 2.2). At high redshift (where
z
m
→ 1), this
relation simpliÿes to (Gnedin, 2000b)
1
k
2
F
(t)
=
3
a
a
0
da
k
2
J
(a
)
1 −
a
a
: (43)
Then the relationship between the linear overdensity of the dark matter
dm
and the linear
overdensity of the baryons
b
, in the limit of small k, can be written as (Gnedin and Hui,
1998)
b
dm
=1−
k
2
k
2
F
+ O(k
4
) : (44)
Linear theory speciÿes whether an initial perturbation, characterized by the parameters k,
dm;i
,
b;i
and t
i
, begins to grow. To determine the minimum mass of non-linear baryonic objects
resulting from the shell-crossing and virialization of the dark matter, we must use a dierent
model which examines the response of the gas to the gravitational potential of a virialized dark
matter halo.
3.2. Response of baryons to non-linear dark matter potentials
The dark matter is assumed to be cold and to dominate gravity, and so its collapse and
virialization proceeds unimpeded by pressure eects. In order to estimate the minimum mass of
baryonic objects, we must go beyond linear perturbation theory and examine the baryonic mass
that can accrete into the ÿnal gravitational potential well of the dark matter.
For this purpose, we assume that the dark matter had already virialized and produced a
gravitational potential (r) at a redshift z
vir
(with → 0 at large distances, and ¡0 inside
the object) and calculate the resulting overdensity in the gas distribution, ignoring cooling
(an assumption justiÿed by spherical collapse simulations which indicate that cooling becomes
important only after virialization; see Haiman et al., 1996a,b).
After the gas settles into the dark matter potential well, it satisÿes the hydrostatic equilibrium
equation,
∇p
b
= −
b
∇; (45)
where p
b
and
b
are the pressure and mass density of the gas. At z 6 100 the gas temperature is
decoupled from the CMB, and its pressure evolves adiabatically (ignoring atomic or molecular
cooling),
p
b
p
b
=
b
b
5=3
; (46)
where a bar denotes the background conditions. We substitute Eq. (46) into (45) and get the
solution,
b
b
=
1 −
2
5
m
p
k
B
T
3=2
; (47)
148 R. Barkana, A. Loeb / Physics Reports 349 (2001) 125–238
where
T =p
b
m
p
=(k
B
b
) is the background gas temperature. If we deÿne T
vir
= −
1
3
m
p
=k
B
as the virial temperature for a potential depth −, then the overdensity of the baryons at the
virialization redshift is
b
=
b
b
− 1=
1+
6
5
T
vir
T
3=2
− 1 : (48)
This solution is approximate for two reasons: (i) we assumed that the gas is stationary through-
out the entire region and ignored the transitions to infall and the Hubble expansion at the
interface between the collapsed object and the background intergalactic medium (henceforth
IGM), and (ii) we ignored entropy production at the virialization shock surrounding the object.
Nevertheless, the result should provide a better estimate for the minimum mass of collapsed
baryonic objects than the Jeans mass does, since it incorporates the non-linear potential of the
dark matter.
We may deÿne the threshold for the collapse of baryons by the criterion that their mean
overdensity,
b
, exceeds a value of 100, amounting to ¿50% of the baryons that would assemble
in the absence of gas pressure, according to the spherical top-hat collapse model (Section 2.3).
Eq. (48) then implies that T
vir
¿ 17:2
T .
As mentioned before, the gas temperature evolves at z
6160 according to the relation
T ≈
170[(1 + z)=100]
2
K. This implies that baryons are overdense by
b
¿ 100 only inside ha-
los with a virial temperature T
vir
¿2:9 × 10
3
[(1 + z)=100]
2
K. Based on the top-hat model
(Section 2.3), this implies a minimum halo mass for baryonic objects of
M
min
=5:0 × 10
3
m
h
2
0:15
−1=2
b
h
2
0:022
−3=5
1+z
10
3=2
M
; (49)
where we set =1:22 and consider suciently high redshifts so that
z
m
≈ 1. This minimum
mass is coincidentally almost identical to the naive Jeans mass calculation of linear theory in
Eq. (41) despite the fact that it incorporates shell crossing by the dark matter, which is not
accounted for by linear theory. Unlike the Jeans mass, the minimum mass depends on the
choice for an overdensity threshold (taken arbitrarily as
b
¿ 100 in Eq. (49)). To estimate the
minimum halo mass which produces any signiÿcant accretion we set, e.g.,
b
= 5, and get a
mass which is lower than M
min
by a factor of 27.
Of course, once the ÿrst stars and quasars form they heat the surrounding IGM by either
outows or radiation. As a result, the Jeans mass which is relevant for the formation of new
objects changes (Ostriker and Gnedin, 1996; Gnedin, 2000a). The most dramatic change occurs
when the IGM is photo-ionized and is consequently heated to a temperature of
∼(1–2) ×10
4
K.
As we discuss in Section 6.5, this heating episode had a dramatic impact on galaxy formation.
3.3. Molecular chemistry, photo-dissociation, and cooling
Before metals are produced, the primary molecule which acquires sucient abundance to
aect the thermal state of the pristine cosmic gas is molecular hydrogen, H
2
. The dominant H
2
R. Barkana, A. Loeb / Physics Reports 349 (2001) 125–238 149
Table 1
Reaction rates for hydrogen species
Reaction Rate coecient Ref.
(cm
3
s
−1
)
(1) H + e
−
→ H
+
+2e
−
5:85 × 10
−11
T
1=2
exp(−157; 809:1=T )(1 + T
1=2
5
)
−1
Haiman et al. (1996a,b)
(2) H
+
+e
−
→ H+h 8:40 × 10
−11
T
−1=2
T
−0:2
3
(1 + T
0:7
6
)
−1
Haiman et al. (1996a,b)
(3) H + e
−
→ H
−
+ h See expression in reference Abel et al. (1997)
(4) H + H
−
→ H
2
+e
−
1:30 × 10
−9
Haiman et al. (1996a,b)
(5) H
−
+H
+
→ 2H 7:00 × 10
−7
T
−1=2
Haiman et al. (1996a,b)
(6) H
2
+e
−
→ H+H
−
2:70 × 10
−8
T
−3=2
exp(−43; 000=T ) Haiman et al. (1996a,b)
(7) H
2
+H→ 3H See expression in reference Haiman et al. (1996a,b)
(8) H
2
+H
+
→ H
+
2
+H 2:40 × 10
−9
exp(−21; 200=T ) Haiman et al. (1996a,b)
(9) H
2
+e
−
→ 2H + e
−
4:38 × 10
−10
exp(−102; 000=T )T
0:35
Haiman et al. (1996a,b)
(10) H
−
+e
−
→ H+2e
−
4:00 × 10
−12
T exp(−8750=T ) Haiman et al. (1996a,b)
(11) H
−
+H→ 2H + e
−
5:30 × 10
−20
T exp(−8750=T ) Haiman et al. (1996a,b)
(12) H
−
+H
+
→ H
+
2
+e
−
See expression in reference Haiman et al. (1996a,b)
Table 2
Reaction rates for deuterium species
Rate coecient
Reaction (cm
3
s
−1
) Ref.
(1) D
+
+e
−
→ D+h 8:40 × 10
−11
T
−1=2
T
−0:2
3
(1 + T
0:7
6
)
−1
Galli and Palla (1998)
(2) D + H
+
→ D
+
+H 3:70 × 10
−10
T
0:28
exp(−43=T ) Haiman et al. (1996a,b)
(3) D
+
+H→ D+H
+
3:70 × 10
−10
T
0:28
Haiman et al. (1996a,b)
(4) D
+
+H
2
→ H
+
+HD 2:10 × 10
−9
Haiman et al. (1996a,b)
(5) HD + H
+
→ H
2
+D
+
1:00 × 10
−9
exp(−464=T ) Haiman et al. (1996a,b)
formation process is
H+e
−
→ H
−
+ h ; (50)
H
−
+H→ H
2
+e
−
; (51)
where free electrons act as catalysts. The complete set of chemical reactions leading to the
formation of H
2
is summarized in Table 1, together with the associated rate coecients (see
also Haiman et al., 1996a,b; Abel et al., 1997; Galli and Palla, 1998; and the review by Abel
and Haiman, 2000). Table 2 shows the same for deuterium mediated reactions. Due to the
low gas density, the chemical reactions are slow and the molecular abundance is far from its
value in chemical equilibrium. After cosmological recombination the fractional H
2
abundance
is small,
∼10
−6
relative to hydrogen by number (Lepp and Shull, 1984; Shapiro et al., 1994).
At redshifts z
100, the gas temperature in most regions is too low for collisional ionization
to be eective, and free electrons (over and above the residual electron fraction) are mostly
produced through photoionization of neutral hydrogen by UV or X-ray radiation.