Astm a 598 a 598m 02 (2015)
Bạn đang xem bản rút gọn của tài liệu. Xem và tải ngay bản đầy đủ của tài liệu tại đây (450.01 KB, 17 trang )
Designation: A598/A598M − 02 (Reapproved 2015)
Standard Test Method for
Magnetic Properties of Magnetic Amplifier Cores1
This standard is issued under the fixed designation A598/A598M; the number immediately following the designation indicates the year
of original adoption or, in the case of revision, the year of last revision. A number in parentheses indicates the year of last reapproval.
A superscript epsilon (´) indicates an editorial change since the last revision or reapproval.
1. Scope
1.9 This test method shall be used in conjunction with
Practice A34/A34M.
1.1 This test method covers the determination of the magnetic performance of fully processed cores for magnetic
amplifier-type applications.
1.10 Explanations of symbols and abbreviated definitions
appear in the text of this test method. The official symbols and
definitions are listed in Terminology A340.
1.2 Tests may be conducted at excitation frequencies of 60,
400, 1600 Hz, or higher frequencies.
1.11 The values and equations stated in customary (cgs-emu
and inch-pound) or SI units are to be regarded separately as
standard. Within this test method, SI units are shown in
brackets. The values stated in each system may not be exact
equivalents; therefore, each system shall be used independently
of the other. Combining values from the two systems may
result in nonconformance with this test method.
1.3 Permissible core sizes for this test method are limited
only by the available power supplies and the range and
sensitivity of the instrumentation.
1.4 At specified values of full-wave sinusoidal-current
excitation, Hmax, this test method provides procedures of
determining the corresponding value of maximum induction,
Bmax.
1.12 This standard does not purport to address all of the
safety concerns, if any, associated with its use. It is the
responsibility of the user of this standard to establish appropriate safety and health practices and determine the applicability of regulatory limitations prior to use.
1.5 At specified values of half-wave sinusoidal-current
excitation, this test method provides procedures for determining the residual induction, Br.
1.6 At increased specified values of half-wave sinusoidalcurrent excitation, this test method provides procedures for
determining the dc reverse biasing magnetic field strength, H1,
required to reset the induction in the core material past Br to a
value where the total induction change, ∆B1, becomes approximately one third of the induction change, 2 Bp. It also provides
procedures for determining the additional dc reset magnetic
field strength, ∆H, which, combined with H1, is the value
required to reset the induction in the core material past Br to a
value where the total induction change, ∆B2, becomes approximately two thirds of the induction change 2 Bp.
2. Referenced Documents
2.1 ASTM Standards:2
A34/A34M Practice for Sampling and Procurement Testing
of Magnetic Materials
A340 Terminology of Symbols and Definitions Relating to
Magnetic Testing
A596/A596M Test Method for Direct-Current Magnetic
Properties of Materials Using the Ballistic Method and
Ring Specimens
1.7 This test method specifies procedures for determining
core gain from the corresponding biasing and induction
changes, ∆H and ∆B.
3. Terminology
1.8 This test method covers test procedures and requirements for evaluation of finished cores which are to be used in
magnetic-amplifier-type applications. It is not a test for basicmaterial magnetic properties.
3.1 Definitions—Below is a list of symbols and definitions
as used in this test method. The official list of symbols and
definitions may be found in Terminology A340. (See Table 1
where indicated).
3.2 Symbols:
1
This test method is under the jurisdiction of ASTM Committee A06 on
Magnetic Properties and is the direct responsibility of Subcommittee A06.01 on Test
Methods.
Current edition approved April 1, 2015. Published April 2015. Originally
approved in 1969. Last previous edition approved in 2007 as A598/A598M–02
(2007). DOI: 10.1520/A0598_A0598M-02R15.
2
For referenced ASTM standards, visit the ASTM website, www.astm.org, or
contact ASTM Customer Service at For Annual Book of ASTM
Standards volume information, refer to the standard’s Document Summary page on
the ASTM website.
Copyright © ASTM International, 100 Barr Harbor Drive, PO Box C700, West Conshohocken, PA 19428-2959. United States
1
A598/A598M − 02 (2015)
TABLE 1 Standard Values of ∆B, ∆B1, and ∆B2 for the Commonly Used Materials
∆ B1 (for Test of 10.5)
∆ B2 (for Test of 10.4)
∆ B or
(∆B2 − ∆B1)
Core Material A
Supermendur
Oriented silicon-iron
50 % nickel-iron:
Oriented
Nonoriented
79 % nickel-iron
Supermalloy
A
kG
Tesla
kG
Tesla
kG
Tesla
14
10
1.4
1.0
28
20
2.8
2.0
14
10
1.4
1.0
10
8
5
5
1.0
0.8
0.5
0.5
20
16
10
10
2.0
1.6
1.0
1.0
10
8
5
5
1.0
0.8
0.5
0.5
Values for other materials may be used by mutual agreement between seller and purchaser.
A
A1
A2
A3
A4
Bmax−Br
Bm
Bp
Br
∆B
∆B1
∆B2
CM
D1 and D2
D3 to D6
d
Eavg
f
G
N1
= cross-sectional area of test specimen core
material, cm2 [m2].
= ac ammeter for primary circuit, half-wave,
average-responsive, A.
= dc ammeter for H1 biasing winding, A.
= dc ammeter for H2 biasing winding, A.
= dc milliammeter for ac voltage calibrator, V.
= change in test specimen induction, under halfwave sinusoidal-current excitation specified
for this measurement.
= maximum induction in a sine-current SCM ac
flux-current loop Gauss [Tesla] (Note 1).
= maximum value of induction in the sinecurrent half-wave CM flux-current loop, for the
reset test Gauss [Tesla] (Note 1).
= residual induction in an ac sine-current fluxcurrent loop Gauss [Tesla].
= change in magnetic induction Gauss [Tesla]
(Table 1).
= change in induction in the flux-current loop
during H1 test Gauss [Tesla] (Table 1).
= change of induction in the flux current loop
during H2 test Gauss [Tesla] (Table 1).
= cyclic magnetization (see Terminology A340).
= solid state diodes or other rectifiers.
= silicon diodes.
= lamination thickness, cm [m].
= average value of voltage waveform, V.
= frequency of test, Hz.
= core gain ∆ B2 − B1/H2, − H1,
N2
N3
N4
SCM
NOTE 1—Note that Hmax and Bmax, as used in this test method, are
maximum points on the sine-current SCM or corresponding half-wave
CM flux-current loops. Also, that Hp and Bp are maximum points on a CM
flux-current loop corresponding to the ac half-wave sine current which is
established in the exciting winding, N1, and held constant, during the dc
current measurements for H1, H2, or ∆H. These definitions are different
from those used for the same symbols in Terminology A340 for use with
dc or sinusoidal-flux ac measurements.
4. Summary of Test Method
4.1 This test method uses the procedures commonly referred
to as the “Constant Current Flux Reset Test Method”
(C.C.F.R.). For graphic representation of the magnetic amplifier core test see Appendix X3.
4.2 Under its provision, a specific predetermined value of
sinusoidal-current excitation, Hmax, (Table 2) is established and
the corresponding induction change is measured to determine
the value of maximum induction which is then designated
Bmax.
4.3 The excitation is then changed to a unidirectional
half-wave sinusoidal current of the same magnitude as that
used for determining maximum induction. The change in
induction under this excitation then is measured to determine
the property designated (Bmax − Br), or the change between the
maximum and residual values of induction.
F G
Gauss T
.
Oe A/m
Hc
Hmax
Hp
H1
H2
∆H
= test winding primary, ac excitation winding,
turns.
= test winding primary, dc H1 biasing winding,
turns.
= test winding primary, dc H2 biasing winding,
turns.
= test winding secondary, ∆ B pickup winding,
turns.
= symmetrical cyclic magnetization (see Terminology A340).
= coercive field strength in an SCM flux-current
loop Oe [A/m].
= maximum magnetic field strength in a sinecurrent SCM ac flux-current loop, Oe [A/m]
(Note 1).
= maximum value of the sine-current ac magnetic field strength for the CM reset tests, Oe
[A/m] (Note 1).
= dc biasing (reset) magnetic field strength for
the H1 test point, Oe [A/m].
= dc biasing (reset) magnetic field strength for
the H2 test point, Oe [A/m].
= change in dc biasing (reset) magnetic field
strength, Oe [A/m].
4.4 The ac half-wave sinusoidal-current excitation, as measured in the ac exciting winding, is then increased to a new
value, designated Hp (Table 2), which causes the ac induction
in the test specimen to rise to a new value which is designated
Bp. A dc reverse-polarity magnetic field strength is then
applied. The opposing dc magnetic field strength resets the flux
or induction in the core material, between each half cycle of ac
magnetization, to a value that provides the specified ∆B1
induction change (Table 1). This dc excitation, designated H1,
is the value required to reset past Br to a point that provides the
specified change in induction of ∆B1 which is approximately
2
A598/A598M − 02 (2015)
TABLE 2 Standard Values of Peak Sine Current Magnetic Field Strength to Be Established for Testing the Commonly Used Materials
Core Material A
Supermendur
Oriented silicon-iron
50 % nickel-iron
79 % nickel-iron
Supermalloy
A
Half-Wave CM Value of Hmax,
(for Measurement of Bmax −
Br in Test of 10.3)
Full-Wave SCM Value of Hmax,
(for Measurement of Bmax
in Test of 10.2)
Half-Wave CM Value of Hp, (for
Determining H1 and H2 or ∆H
in Testing of 10.4 and 10.5 and
adjustments of 10.1)
Oe
A/m
Oe
A/m
Oe
A/m
3
3
1
0.5
0.25
240
240
80
40
20
3
3
1
0.5
0.25
240
240
80
40
20
6
6
2
1
0.5
480
480
160
80
40
Values for other materials may be used by mutual agreement between seller and purchaser.
equal to one third of 2 Bp. This value of H1 has some
correlation to the coercive field strength, Hc, of the material.
4.9 Heat treatment appropriate to the core material and core
construction may be required before test.
4.5 Holding the same increased value of ac half-wave
sinusoidal-current excitation, as described in 4.4, the dc
reverse-polarity excitation is increased by the amount ∆H and
the total value of dc reverse biasing (H1 + ∆H) is designated
H2. It is the value of dc reverse biasing required to reset the flux
between ac magnetizing cycles to a value which provides the
specified total change in induction of ∆B2 (Table 1) that is
approximately equal to two thirds of 2 Bp.
5. Significance and Use
4.6 From the change in dc bias ∆H and the changes in
induction ∆B corresponding to the change between the H1 and
H2 operating points, the core gain may be determined. It is
usually reported as a ∆H value for the core. When required for
special reasons, it may be reported in terms of core gain, G (see
11.5).
6.1 Sinusoidal Voltage Supply—The source of excitation
shall be an ac source of sinusoidal voltage which shall have
sufficient power to magnetize the largest core to be examined
to the levels of excitation as specified in Table 2. Its harmonic
distortion under load shall be less than 3 %. Its frequency
should be constant to within 1 % or less. Standard test
frequencies are 60, 400, and 1600 Hz.
5.1 The method of excitation simulates, to a practical
degree, the operation of a magnetic core in a self-saturating
magnetic amplifier. The properties measured are related to the
quality of performance of the cores in magnetic amplifiers and
are useful for the specification of materials for such cores.
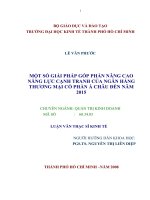
6. Apparatus (see Fig. 1)
4.7 It is standard practice to assign values to the change of
induction ∆B1 and ∆B2 (Table 1). This in turn determines the
magnitude of the H1 and H2 biasing values corresponding to
these changes of induction.
6.2 Series Impedance, Z1, or Resistor, R1—This impedance
should provide a voltage drop much larger than the voltage
appearing across the excitation winding. Then, the distortion of
current waveform as a result of the nonlinear impedance of the
core will be minimized. It may be a power resistor for small
size cores. For larger cores, a series resonant circuit may be
used, which reduces the voltage requirements of the power
4.8 The normal test specimen may have any size or shape.
When used specifically to evaluate materials for core
construction, it is limited in size, weight, and method of
manufacture.
FIG. 1 Basic Diagram for Magnetic Amplifier Core Test
3
A598/A598M − 02 (2015)
mating that of cores tested by this test method, with a test
method for determining the average voltage (see 9.2).
source. The voltage across this impedance or a reactive element
in Z1 must be greater than 25 times the average voltage induced
in the excitation turns, N1.
6.7 DC Power Supply for H1—This power supply shall
provide sufficient voltage to overcome the voltage drop across
impedance, Z2, and sufficient current capacity to saturate any
core to be tested. The rms value of the ac ripple of the dc
power-supply voltage shall not exceed 0.25 % of the test
voltage required under the conditions of maximum or minimum dc load currents.
6.3 Diodes (Note 2), D1 and D1 may be fast solid state
devices (Note 3), high-vacuum rectifiers, or Schottky rectifiers.
NOTE 2—During the interval between half-wave pulses, when the
excitation should be nominally zero, the average leakage current shall be
less than 0.1 % of the peak value of excitation current during a pulse.
NOTE 3—In the case of solid-state devices, a capacitative charging pulse
of reverse current is sometimes observed, particularly at the higher
frequencies. Its integrated value, in ampere-seconds, at any test frequency
shall be limited to 1.0 % of the ampere-seconds of the exciting half-wave.
6.8 DC Power Supply for ∆H—This power supply shall
provide sufficient voltage to overcome the voltage drop of
impedance, Z3, and sufficient current capacity to provide ∆H
for any core to be tested. Its rms ripple voltage shall not exceed
0.25 % of the test voltage required under the conditions of
maximum or minimum dc load currents.
6.4 The test fixture shall be composed of four sets of
windings enclosing the core and a means of compensating for
air-flux effect in induced voltage in N4.
6.4.1 The exciting winding N1 shall contain as small a
number of turns as practical to limit the exciting-current
waveform distortion (see 6.1).
6.4.2 The B-coil, pickup winding, N4, may contain any
convenient number of turns. This winding shall be maintained
in a fixed position in relation to the excitation windings to
eliminate variations in the air-cored inductive or capacitive
coupling between them. Compensation for such coupling may
be accomplished with the air-cored bucking transformer, T1.
6.9 AC Blocking Impedances, Z2 and Z3—These impedances are dc current-passing elements that reduce the ac
loading effects of the H1 and ∆H windings and their dc power
supplies to acceptable limits. Minimum values for impedances
Z2 or Z3 may be calculated from the equation of 11.6.
6.10 Ammeters:
6.10.1 Ammeter, A1—This ammeter is normally a dc instrument of the d’Arsonval indicating type or a dc digital voltmeter
reading voltage across a precision resistor. It shall have a
full-scale accuracy of at least 61.0 % and shall be capable of
calibration as a full-wave or half-wave peak-indicating ammeter.
6.10.2 Ammeters, A2 and A3—These instruments are dc
ammeters or dc digital voltmeters reading voltages across
precision resistors and must have a full-scale accuracy of at
least 60.5 %. For measurement of properties of very-high-gain
cores, these ammeters must have an accuracy of at least
60.25 % of full scale.
NOTE 4—The coils of the test fixture, including the air-cored bucking
transformer, T1, if used, shall be initially adjusted such that the voltage
coupling between the exciting and pickup windings will be minimized
when no specimen is in place, and maximum full-wave exciting current
for a given-size core is applied. The cancellation will be considered
adequate when the flux voltmeter indicates the equivalent of 15 G [0.0015
T] or less for that size core. The pickup circuit should be shielded from
stray fields, when this cannot be accomplished an adjustable coil may be
used to buck out voltages picked up from external fields (see 10.1).
6.4.3 The dc reset windings shall use a small number of
turns to help minimize the ac transformer loading of the test
core. The impedances, Z2 and Z3, described in 6.9 and 11.5 also
help to limit this loading effect to acceptable values.
6.11 Resistor, R1—This resistor compensates for the ammeter’s impedance and nonequality of the two diodes. It is
adjusted to provide equal values of crest current, in the two half
waves, when full-wave excitation is being used.
6.5 Flux Voltmeter:
6.5.1 The flux voltmeter must respond to the true average
value of the pickup-winding voltage. The average value of the
voltage waveform is directly proportional to the total change of
magnetic flux in the core. The flux-voltmeter accuracy shall be
1 % or better.
6.12 Switch, S1—This switch provides means for applying
either full- or half-wave excitation to the core while maintaining full-wave loading on the power source.
7. Sampling
NOTE 5—For medium- or small-size cores, the ordinary rectifier ac
voltmeters are not sensitive enough to accurately measure Bmax − Br, and
conventional average-responsive vacuum-tube voltmeters are subject to
excessive errors as a result of the extremely peaked nature of the voltage
waveform and to the high ratio of peak to average values. Therefore,
special instruments must be used. Some typical schemes appear in
Appendix X1.
7.1 Unless otherwise agreed upon, test specimens that
represent a lot or more than one core shall be selected in
accordance with Practice A34/A34M.
8. Test Specimen
8.1 The test specimen may be a core or lamination stack of
any size or shape which has been designated for use in
magnetic-amplifier applications.
6.5.2 The input impedance of the flux voltmeter as connected to the pickup winding of the core shall exceed the value
of Z for any coil load as specified in 11.6.
9. Calibration of Test Equipment
6.6 Calibration Source—An adequate means shall be provided to calibrate the flux voltmeter. A source of accurately
known ac voltage, or the output of a core whose saturation has
been carefully measured by dc ballistic methods may be used.
The reference voltage calibrator shown in Appendix X2
provides a suitable voltage source having a waveform approxi-
9.1 The individual instruments used to measure the three
excitation currents must be calibrated against suitable dc
reference standards according to good laboratory practice.
9.1.1 Ammeter A1, used to measure the full-wave and
half-wave ac magnetizing currents, is an average-responsive
4
A598/A598M − 02 (2015)
material during cyclic changes from maximum to residual
induction and is the measure for the quanitity Bmax − Br.
ammeter connected in such a manner that for both measurements it sees only the positive unidirectional half-cycle current
wave trains. This dc instrument is calibrated to indicate the
average value of the ac half-wave where Idc = Iavg, and the peak
of the current wave trains is obtained as follows:
10.4 With switch S1 remaining in the half-wave excitation
position, readjust the excitation current, Ip (as calculated for
10.1), to a value that provides the peak magnetic field strength
specified in Table 1 which is to be maintained during measurements for the parameters, H1, ∆H, and ∆B. Then adjust the dc
level (form the H1 power supply) in winding N2 until the flux
voltmeter indicates the voltage that is induced when the desired
∆B1 (as shown in Table 1) has been established. This reverse dc
biasing current, I2, in amperes is used to calculate the value of
H1 in oersteds or A/m (see 11.3).
I p 5 πI avg
where:
= peak value of half-wave ac exciting current, A and
Ip
Iavg = average value of ac half-wave exciting current, A.
9.1.2 Ammeters A2 and A3 are dc instruments used to
measure direct current. They require accurate calibration but
no conversion factors.
10.5 With switch S1 remaining in the half-wave position and
excitation current, Ip, and reverse-biasing current, I2, held to
the values given in 10.4, adjust the dc current level (from the
∆H power supply) in winding N3 until the flux voltmeter
indicates the voltage which is induced when the desired
∆B2 (as shown in Table 1), has been established. This reverse
dc biasing current, I3, in amperes is used to calculate the value
of ∆H oersteds or A/m (see 11.3). This current represents the
change in reverse dc biasing current (or biasing field ∆H
oersteds or A/m) which causes the induction resulting from the
ac excitation to change by the value of ∆B G.
9.2 The ac fluxmeter may be calibrated by either a reference
core or a reference-voltage calibrator.
9.2.1 A reference core is one whose flux change is known or
can be measured. Such measurements can be made by dc
ballistic methods.3 A supermalloy core or suitable equivalent
prepared from 0.001-in. [25-µm] thick material excited to a
peak excitation of 10 Oe [796 A/m] is suggested. This
reference core is placed in the test fixture and excited with the
magnetic field strength for which the flux change is known.
The ac flux voltmeter is then calibrated in terms of the known
flux change.
9.2.2 The reference-voltage calibrator of Appendix X2 develops a known average voltage having a waveform approximating that of the induced voltage in winding N4 of Fig. X2.1
for the measurement of Bmax.
10.6 When a very stable dc power supply is used with 1-dc
ammeter of the 0.1 % class or better, this combination with a
single dc winding, N2, may be used for both the H1 and H2 or
∆H determinations.
10.7 In this test method, the coercive field strength Hc
parameter is not measured directly or calculated from other
parameters. An approximate correlation may be found with the
parameter H1.
10. Procedure
10.1 Set switch S1 to the full-wave position and turn all dc
power supplies to zero current. Then, with no core in the test
jig, raise the level of the ac sinusoidal current in the excitation
winding, N1, to the value which produces the peak excitation,
Ip, required in Table 1 for the measurement of Bp. Then adjust
the coupling of the air flux compensator, T1, to give a minimum
reading on the flux voltmeter scale (Note 4). The position of the
stray-flux compensator must also be adjusted to provide the
lowest possible residual-flux voltmeter reading. The exciting
current, Ip, value required for this measurement may be
calculated from the equation of 11.1.
11. Calculations
11.1 Table 1 specifies the values of full-wave or half-wave
sinusoidal-current magnetic field strength to be used in testing
various materials. The following equation is used to calculate
the peak value of full-wave or half-wave sinusoidal current
required to establish the desired magnetic field strength. Where
for full-wave excitation,
I p 5 ℓ 1 H max/0.4πN 1 , H max in Oe
I p 5 ℓ 2 H max/N 1 , H max in A/m
10.2 Place a test specimen in the test fixture, and with the
value of full-wave SCM sinusoidal-current excitation, Ip
(calculated from specified Hmax of Table 2), flowing through
the excitation winding, N1, observe the flux-voltmeter reading
across winding, N4. This voltage corresponds to a total flux
change from forward Bmax to reverse Bmax (or 2 Bmax in terms
of half-wave parameters).
and for half-wave excitation,
I p 5 ℓ 1 H p /0.4πN 1 , H p in Oe
I p 5 ℓ 2 H p /N 1 , H p in A/m
where:
= peak value of current reached during a cycle of the
Ip
sinusoidal full-wave or half-wave exciting current,
A,
= mean magnetic path length of the test specimen, cm,
ℓ1
and
= mean magnetic path length of the test specimen, m.
ℓ2
Hmax = predetermined peak value of magnetic field strength
Hmax to be used for a particular test (see Table 2),
Hp
= predetermined peak value of magnetic field strength,
Hp, to be used for a particular test (see Table 2), and
10.3 Operate switch S1 to the half-wave excitation position
and maintain the same value of peak-excitation current, Ip
(used in 9.2), so that the half-wave (CM) value of Hmax equals
the previous full-wave (SCM) value of Hmax. Again observe
and record the flux-voltmeter reading across winding N4. This
voltage is proportional to the flux-density shift in the specimen
3
See Practice A34/A34M, Terminology A340, and Test Method A596/A596M.
5
A598/A598M − 02 (2015)
N1
where:
G
= core gain, G/Oe, or G[T] = core gain, Tesla/A/m.
= number of turns used in the excitation winding.
11.2 When the peak current ammeter used is a dc averageresponsive ammeter, the following equation shall be used to
calculate the scale indication corresponding to the desired
value of peak magnetic field strength, Hmax. Where for
full-wave excitation,
11.6 The minimum value of impedance that is allowable for
an external circuit or instrument which is to be connected to a
test winding can be determined from the following equation:
Z 5 2πfN 2
I avg 5 ℓ 1 H max/0.4πN 1 π, H max in Oe
I avg 5 ℓ 2 H max/N 1 π, H max in A/m
Z 5 5fN 2
and for half-wave excitation,
I avg
A ∆B
3 10 25 cnst. units
ℓ 1 ∆H
A ∆B
3 10 3 SI units
ℓ 1 ∆H
where:
Z = total impedance, looking externally from the winding
terminals, Ω;
f
= frequency, Hz;
N = number of turns in the test winding to be connected to
the circuit impedance or instruments;
A = cross-sectional area of the core material, cm2 [m2]; and
ℓ1 = mean magnetic path length of the core, cm [m].
5 ℓ 1 H p /0.4πN 1 π, H max in Oe
I avg 5 ℓ 2 H p /N 1 π, H max in A/m
where:
= average value of alternating current as indicated on
Iavg
the dc average responsive instrument scale, A;
= mean magnetic path length of the test specimen, cm;
ℓ1
and
= mean magnetic path length of the test specimen, m.
ℓ2
Hmax = peak value of magnetic field strength, Hmax, from
Table 2;
= peak value of magnetic field strength, Hp, from
Hp
Table 2; and
= number of turns on excitation winding.
N1
11.7 The core material area, A, is normally determined from
the nominal core dimensions and lamination factors of Table 3
and Table A1.2. When the core area is not known, it may be
determined by calculation from dimensions and stacking factor.
11.8 The mean path length of the core material shall be
determined from the manufacturer’s published dimension or
from measured dimensions.
11.3 The values of reverse dc biasing magnetic field
strength for the H1 and ∆H determinations may be calculated
from the following:
11.9 The flux-voltmeter scale may be calibrated to indicate
∆B changes directly from its scale reading (Appendix X2) or to
indicate average volts. Voltages corresponding to the desired
induction or change in induction may be calculated as follows:
H 1 5 0.4πN 2 I 2 /ℓ 1 in Oe, H 1 5 N 2 I 2 /ℓ 2 in A/m
∆H 5 0.4πN 3 I 3 /ℓ 1 in Oe, ∆H 5 N 3 I 3 /ℓ 2 in A/m
where:
H1 = dc biasing (reset) magnetic field strength from coil N2
(H1 testpoint);
∆H = dc biasing (reset) magnetic field strength from coil
N3 (N2 testpoint);
N2
= magnetizing coil for H1 dc reverse biasing, turns;
= magnetizing coil for H2 dc reverse biasing, turns;
N3
= direct current required in N2 for the H1 testpoint, A;
I2
= direct current required in N3 for the H2 testpoint, A;
I3
and
= mean magnetic path length of the test specimens, cm.
ℓ1
E avg 5 2 ~ ∆B ! N 4 fA 3 10 28 cnst. units
E avg 5 2∆BN4 fA SI units
where:
Eavg = average value of voltage induced in winding N4,V;
∆B
= change in induction in the magnetic core material, G
[T];
= number of turns in winding N4;
N4
f
= frequency, Hz; and
A
= cross-sectional area of the core material, cm2 [m2].
11.4 The value of ∆B may be calculated as follows:
12. Precision and Bias
∆B 5 ∆B 2 2 ∆B 1
12.1 It is not practicable to specify the precision of the
procedure in this test method for measuring the gain factor of
a core because there are too few laboratories capable of making
this test to conduct an interlaboratory study. The procedure in
where:
∆B1 = total B swing for the H1 testpoint and
∆B2 = total B swing for the H2 testpoint.
11.5 The gain factor for a core is usually expressed in terms
of the ∆H test value required to change the induction swing
from the value of ∆B1 to that of ∆B2 (see 11.3). This value is
very useful for evaluating the quality of cores made from a
specific material. For quality comparisons between cores made
from two different types of material or for other isolated cases,
it may be desirable to express the gain factor of the core as a
ratio between ∆B and ∆H as follows:
TABLE 3 Lamination Factor
Tape Thickness
in.
0.0005
0.0010
0.002
0.004
0.006
0.010 to 0.014
G 5 ∆B/∆H, G @ T # 5 ∆B/∆H
6
[cm]
[0.0013]
[0.0026]
[0.0051]
[0.010]
[0.015]
[0.025 to 0.36]
Stacking Factor
[m (10 −6 )]
[13]
[25]
[51]
[100]
[150]
[250–360]
0.5
0.75
0.85
0.90
0.90
0.95
A598/A598M − 02 (2015)
this test method for measuring the gain factor of a core has no
bias because the gain factor is defined only in terms of this test
method.
13. Keywords
13.1 core; coregain; gain factor; induction; magnetic amplifier; magnetic field strength
ANNEX
(Mandatory Information)
A1. STANDARD TEST SPECIMENS FOR USE IN EVALUATING CORE MATERIALS
above, should be selected so that it can be removed by heating
at a low temperature in air, such as at 150°C [302°F]. The
amount of the insulation must allow the cores to meet the
lamination factors of Table A1.2.
A1.1 When the test specimen is intended for evaluation of
basic materials for core construction, the test sample shall be
selected as required for strip materials in accordance with the
provisions of Practice A34/A34M. The procurement specifications should specify the method of sample selection and
subsequent treatment for such cores. When not covered by
specifications, the provisions and requirements of Annex A1
shall govern the sample selection and preparation.
A1.5 The winding tension may be used to control the
stacking factor. A satisfactory core, after heat treatment, may
be telescoped with light finger pressure. The lamination factors
must conform to the limits of Table A1.2.
A1.2 The test specimen, unless otherwise agreed upon
between the purchaser and manufacturer, shall be a tape-wound
core having the dimensions listed in Table A1.1.
A1.6 At one spot of the first layer and at one spot of the
outer layer, the core may be spot welded to keep the core from
unwinding. The welds must not penetrate more than three
adjacent layers.
A1.3 The test sample material shall be slit to the required
width. This is commonly done on commercially available
rotary slitting equipment. It is essential that the quality of the
slitting be according to the best commercial practice with a
minimum burr and free of waves and wrinkles. The slit strips
shall be clean and free of any dust or foreign matter. They shall
be long enough to wind the required core without welding or
patching two or more pieces together.
A1.7 When a core is to be used for basic material
evaluation, the area, A, shall be determined as follows:
A 5 ~m / ℓ1 δ!
where:
A = metallic cross-sectional core area [cm2, cnst. unit; m2,
SI unit],
m = mass of the core material [g, cnst. unit; kg, SI unit],
ℓ1 = mean magnetic path length [cm, cnst. unit; m, SI unit],
and
δ = standard assumed density of the core material [g/cm3,
cnst. unit; kg/m3, SI unit].
A1.4 The surfaces of the strip must be coated with a
refractory insulation before or during the winding of the core.
A fine grade of magnesium oxide (less than 5 µm in diameter)
has been found satisfactory. It may be made to adhere to the
strip by applying a light oil film on the strip previous to or
during core winding. All insulation materials and bonding
agents (such as the oil) used in the insulation process must be
carefully screened to eliminate those that could contaminate
the cores during the heat-treating process. The oil, suggested
A1.8 The heat treatment of the standard core specimen will
determine the performance of the core material to a critical
degree. The choice of time and temperature and annealing
TABLE A1.1 Dimensions of Standard Tape-Wound Core Specimens to Be Used When Evaluating Basic Material Properties
NOTE 1—For other thickness of material, d, the core size shall be determined by mutual agreement and shall have the following limitations: the inside
diameter shall be at least 140 d but less than 2000 d, the strip width shall be at least 30 d but not more than 500 d, the outside diameter shall be 1.25
times the inside diameter, the mean magnetic path of such a core is 3.54 times the inside diameter.
Dimension
Strip thickness, d
Inside diameter, Di
Outside diameter, Do
Strip width, w
Mean magnetic path, l1
Light Gage, in [m]
0.0005 [13 µm] up to and including
0.006 [150 µm]
1.000 [0.0254]
1.250 [0.0318]
0.0250 [0.006 36]
3.54 [0.0898]
7
Heavy Gage, in. [m]
0.004 [100 µm] up to and including
0.014 [350 µm]
2.00 [0.0508]
2.500 [0.0636]
0.500 [0.0127]
7.07 [0.1796]
A598/A598M − 02 (2015)
TABLE A1.2 Lamination Factor Range for Standard Tape-Wound
Core Specimens When Used for Evaluation of Basic Material
Properties
NOTE 1—Definition of lamination factor may be found in Terminology
A340.
Strip Thickness, d
in.
0.0005 to 0.0008
0.0008 to 0.0015
0.0015 to 0.003
0.003 to 0.008
0.008 and up
Lamination Factor,
Range, S, %
[m]
[13 to 20]
[20 to 38]
[38 to 76]
[76 to 200]
[200] and up
50
60
75
80
to 60
to 80
to 90
to 90
95
A1.10 Annealing Trays:
atmosphere must provide the proper conditions for development of optimum properties as specified by the material
manufacturer. The typical conditions for heat treatment of
standard core specimens when used for material evaluation are
found in Table A1.3.
A1.10.1 The specimens are arranged in trays in as stable a
way as possible to avoid deformations. At the heat-treating
temperatures, the magnetic materials do not have enough
strength to support themselves. If the trays are not flat, the
samples will follow the contour of the trays.
A1.9 Furnace:
A1.9.1 The furnace should be suitable for heat treating at
temperatures up to 1204°C [2200°F] in pure dry hydrogen
atmospheres. Where required, its size and heating rate should
be such as to meet the heating rates specified in Table A1.3 or
other agreed upon conditions capable of imparting to the
charge temperatures which are uniform within 10°F [5.5°C].
A1.10.2 Adequate strength of the trays at the annealing
temperature should be one of the selection criteria for tray
materials.
A1.9.2 The temperature-controlling equipment should be
selected to allow the above 5.5°C [610°F] accuracy in setting
and uniformity.
A1.10.4 The chemical composition of the material used for
trays and spacers should be examined and found not to have
any interactions with the magnetic material. It is generally
desirable that they be free from carbon and sulfur.
A1.10.3 The thermal coefficient of expansion of the tray
material and spacers should be preferably of the same order as
that of the magnetic material to be heat treated.
A1.9.3 When dry hydrogen atmospheres are used, the exit
dew point should be below −40°C [−40°F]. (Warning—
Hydrogen is a highly explosive gas. Extreme care must be
exercised when using it.)
A1.10.5 The tray arrangement in the furnace retort and the
piling of the specimens should be arranged in such a way that
the heat-treating atmosphere freely reaches all specimens.
TABLE A1.3 Typical Range of Heat-Treatment Conditions for Standard Cores When Used for Material Evaluation
Temperature, °C [°F]
Atmosphere
Flow rate, in volume changes/h
Time charge is at temperature, h
Heating rate, °C [°F]/h ± 20 %
Cooling rate, °C [°F]/h ± 20 %
80 % Nickel-Iron Alloy
50 % Nickel-Iron Alloy
930 to 1200 [1700
to 2200]
hydrogen
930 to 1200 [1700
to 2200]
hydrogen
10
2
280 [500]
upon agreement with
supplier
10
2
280 [500]
280 [500]
8
Oriented Silicon-Iron
650 to 870 [1200
to 1600]
up to 20 % hydrogen,
balance nitrogen
10
2
280 [500]
280 [500]
49 % Cobalt-Iron 2 %
Vanadium
650 to 870 [1200
to 1600]
hydrogen
10
2
280 [500]
upon agreement with
supplier
A598/A598M − 02 (2015)
APPENDIXES
(Nonmandatory Information)
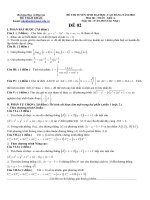
X1. FLUX VOLTMETER INSTRUMENTATION
X1.1.8 The frequency response should be low enough to
reproduce a practically perfect square wave at the lowest test
frequency with no visible droop on the flat-top portion of the
waveform. The frequency of highest satisfactory response
should be at least 20 times the highest test frequency to be
used. A suitable amplifier would have good frequency response
from 1 to 100 Hz for testing in the frequency range from 60 to
5000 Hz.
X1.1 Resistance-Capacitance (R-C) Integrator-Amplifier
(See Fig. X1.1)
X1.1.1 A simple R-C network can be used as an effective
integrator. With attention to detail, it can perform integration
with an accuracy sufficient for flux measurements. For proper
operation, the ratio of R to 1/ωC should be at least 250 to 1 at
the test frequency. Otherwise, a phase displacement at the
lower frequencies will appear as a droop on the flat-top portion
of the integrated waveform. A high-quality, low-loss capacitor
and a noninductive resistor are required.
X1.1.9 A standard half-wave voltage-doubler circuit is used
to enable peak detection of the integrated waveform to be
performed. This circuit yields a dc voltage equivalent to the
peak-to-peak (P-P) value of its input voltage. To avoid losses
caused by diode leakage and barrier effects, the input voltage
should be at least 200-V P-P under Bmax conditions. A 10×
multiplier should be used on the amplifier to increase the
(Bmax − Br) integral of square materials (Br/Bmax ratios above
0.80). In this way, the doubler circuit is always sensing
waveforms of the necessary amplitude.
X1.1.2 The R-C network should be completely shielded to
avoid stray pickup at the test frequency. This pickup can cause
either a rise or droop on the flat top of the output waveform.
X1.1.3 A safe test for proper integration and a minimum of
low-frequency phase displacement is to use the integrator to
observe the flux-current loop on an oscilloscope under sinecurrent excitation conditions. The test core should be of the
square-loop variety (oriented 50 % Ni-Fe) with a Br/Bmax ratio
of 0.98 or more and driven to a peak magnetic field strength of
2 Oe [0.025 A/m]. For this check, the “tails” of the flux-current
loop should show no crossover or opening. The oscilloscope
should be operated direct coupled with a probe on the input to
obtain very high input impedance.
X1.1.10 The indicating part of the flux meter is a dc
voltmeter. The full-scale accuracy of this instrument should be
at least 60.25 %. This accuracy is necessary to permit an
overall system accuracy of about 60.5 %.
X1.1.4 The input impedance of the R-C integrator must be
of such value as to cause a very minimum of loading on the
test-core secondary. This value of impedance should be greater
than the core impedance Z (see 11.6).
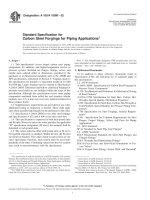
X1.2 Miller Integrator (See Fig. X1.2)
X1.2.1 A Miller integrator or operational amplifier connected as a Miller integrator operates on the core pickup
voltage in much the same manner as the R-C integrator. Its
most desirable characteristic, however, is that the value of the
capacitance in the R-C network is effectively increased by the
open-loop gain of the amplifier. This results in a larger time
constant which is the equal to RC(1 + A), where A is the gain
of the amplifier.
X1.1.5 Since the output of an R-C integrator is usually very
low, an amplifier is used to increase this level to a value
sufficient for measurement purposes.
X1.1.6 The input impedance of the amplifier should be high
enough to avoid unnecessary loading of the integrator. An input
impedance greater than 1000 X Ω at the test frequency is
recommended.
X1.2.2 The frequency requirements for the amplifier used in
this integrator are very similar to those specified for the R-C
integrator system of X1.1.8.
X1.1.7 The amplifier should employ sufficient feedback to
enable good amplitude linearity (60.1 %).
FIG. X1.1 R-C Integrator-Amplifier
9
A598/A598M − 02 (2015)
FIG. X1.2 Miller Integrator
suitable amplifier would have good frequency response from 5
to 250 kHz for testing in the frequency range from 60 to 5000
Hz.
X1.2.3 The normally high input impedance of the Miller
integrator will contribute very little loading on the core
secondary voltage. This impedance is defined in X1.1.4.
X1.2.4 Two other desirable characteristics of this integrator
are a higher output signal amplitude and the capability of
adapting reasonable loading without reducing its quality of
integration.
X1.3.2 Linearity should be at least 60.1 %.
X1.3.3 The amplifier output should be capable of handling
200 V, peak, without clipping.
X1.3.4 A full-wave diode bridge is used to rectify the
amplifier output voltage. The large voltage swing tends to
minimize the errors caused by nonlinearities in the diode
voltage-current characteristics at the low-voltage levels. These
areas contain a large portion of the average value of the overall
waveform. Consequently, it is necessary to amplify the core
output voltage until the low-level regions fall on the linear
portion of the diode characteristic.
X1.2.5 Since the integrator output is still too low for good
peak detection, an additional amplifier is required.
X1.2.6 The requirements pertaining to linearity and frequency response of this amplifier are the same as those called
for in X1.1.8.
X1.2.7 The input impedance need not be abnormally high
since integrator loading is not very critical.
X1.2.8 The half-wave voltage doubler and dc voltmeter
used with this system should have characteristics and accuracies identical with those established in the preceding system
X1.2.1 and X1.2.2.
X1.3.5 The use of germanium diodes further will reduce the
error caused by the barrier voltage encountered in solid state
diodes.
X1.3.6 Linearity can be further enhanced by using diodes to
shunt the rectifier bridge. These diodes should have the same
characteristics, be held at the same temperature, and carry the
same current levels as bridge diodes.
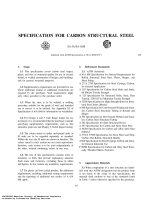
X1.3 Rectifier-Integrator (See Fig. X1.3)
X1.3.1 In this system, an amplifier is used to increase the
core output voltage to a level sufficient for accurate full-wave
rectification. The frequency requirements here are more stringent for this amplifier than those of the foregoing systems. This
is due to the magnitude and number of harmonics in the core
output voltage. The high-frequency response must be adequate
to handle the higher-order harmonics properly, which, in some
cases, may be in excess of 50 times the test frequency. A
X1.3.7 The indicating instrument must be of the d’Arsonval
type. The actual integration is performed by this instrument
which responds to the average value of the rectified waveform.
X1.3.8 The full-scale accuracy of this instrument should be
60.25 %.
FIG. X1.3 Rectifier-Integrator
10
A598/A598M − 02 (2015)
X2. CALIBRATION CIRCUIT FOR THE FLUX VOLTMETER
X2.1 This calibration circuit develops an ac test voltage
having a waveform similar to the induced voltage in winding
N4 of Fig. 1 during the measurement of Bmax. The circuit, as
shown in Fig. X2.1, uses a tape-wound core of square
hysteresis loop material, T3, which is excited by a sinusoidal
current limited by resistor R2. The induced voltage is rectified
in the silicon diodes in a bridge rectifier circuit.
E avg 5 2 ~ ∆ B ! N 4 fA 3 10 28 cnst. unit
E avg 5 2∆BN4 fA SI unit
where:
∆B = change in magnetic induction, G [T];
N4 = number of turns linking the core specimen which is
connected to the flux voltmeter (see Fig. 1);
f
= frequency, Hz; and
A
= cross-sectional area of magnetic flux path of the
specimen core, cm2 [m2].
X2.2 Because the same current flows in the ac calibration
resistor as flows in the dc milliammeter, the average value of
the current indicated by the milliammeter, A4, is the same as
that flowing in the ac shunt resistor, R4
E cal 5 I acR 4
X2.3 The voltage developed across R4 may be related to
Eavg, the average of the induced voltage in N4 of Fig. 1 as
follows:
NOTE 1—
T2—stepdown transformer, output 25 V at 1.0 A
R2—voltage-dropping resistor, 25 Ω, 25 W
T3—square hysteresis loop core—primary 20 turns (approximately), secondary five turns when core area = 1 cm2
D3 to D6—full-wave rectifier, silicon diodes
R3—current control resistor, 50 to 100 Ω
A4—milliammeter 0.25 % accuracy, 1 to 100 mA depending on frequency
R4—ac current shunt, 1.0 to 10 Ω
FIG. X2.1 Calibration Circuit for Flux Voltmeter
11
A598/A598M − 02 (2015)
X3. GRAPHICAL REPRESENTATION OF THE MAGNETIC AMPLIFIER CORE TEST (C.C.F.R.)
X3.4 Reference should be made to Fig. X3.5 and Fig. X3.6
for determination of the direct current biasing field, H1,
required to reset the core flux sufficiently to establish an
induction change of ∆B, in the core material when using the
procedures of 10.4.
X3.1 The figures of this Appendix show in graphical form
the various steps and interpretation of the (C.C.F.R.) magnetic
amplifier core test.
X3.2 Fig. X3.1 and Fig. X3.2 are to be used for the
determination of induction, Bmax, reached in the core material
when magnetized by full-wave sinusoidal current to the specified value of Hmax Oe, using procedures of 10.2.
X3.5 Fig. X3.7 and Fig. X3.8 are useful for determination of
the direct current biasing field, H2, required to reset the core
flux sufficiently to establish an induction change of ∆B2 in the
core material when using the procedures of 10.5.
X3.3 Fig. X3.3 and Fig. X3.4 are for use in the determination of the residual induction, B, in the core material after being
magnetized to Hmax Oe and the value of Bmax −Busing the
procedures of 10.3.
12
A598/A598M − 02 (2015)
X3.6 Graphical representation of the combined flux-current
loops which represent the various test conditions of Section 10
is shown in Fig. X3.9.
X3.7 A characteristic performance curve (Fig. X3.10),
which represents a full range of operating values for a magnetic
amplifier core, may be obtained by plotting the induction
changes versus a number of different values of the dc biasing
magnetic field strength. The procedures of 10.4 and 10.5 are
followed except that a number of different values of the dc
biasing field are established for determination of the corresponding values of induction change ∆B.
FIG. X3.2 Sine-Current SCM Flux-Current Loop for Test
Described in 10.2
FIG. X3.1 Circuit Diagram for Tests Described in 10.2
FIG. X3.3 Circuit Diagram for Tests Described in 10.3
FIG. X3.4 Sine-Current CM Flux-Current Loop for the Test Described in 10.3
13
A598/A598M − 02 (2015)
FIG. X3.5 Circuit Diagram for Tests Described in 10.4
FIG. X3.6 Flux-Current Loop with Combined dc Biasing Field, H1,
and Half-Wave Sine-Current Field, Hp, as Used for Tests Described in 10.4
14
A598/A598M − 02 (2015)
FIG. X3.7 Circuit Diagram for Tests Described in 10.5
FIG. X3.8 Flux-Current Loop with Combined dc Biasing Fields, H1, H2, and Half-Wave Sine-Current Field, Hp, as Used for Tests Described in 10.5
15
A598/A598M − 02 (2015)
FIG. X3.9 Composite Flux-Current Loops Showing Relationship of Various Test Conditions of the C.C.F.R. Test
16
A598/A598M − 02 (2015)
FIG. X3.10 Characteristic Curve of Core Specimen Under Half-Wave ac Excitation and dc Reset Conditions
This standard is subject to revision at any time by the responsible technical committee and must be reviewed every five years and
if not revised, either reapproved or withdrawn. Your comments are invited either for revision of this standard or for additional standards
and should be addressed to ASTM International Headquarters. Your comments will receive careful consideration at a meeting of the
responsible technical committee, which you may attend. If you feel that your comments have not received a fair hearing you should
make your views known to the ASTM Committee on Standards, at the address shown below.
This standard is copyrighted by ASTM International, 100 Barr Harbor Drive, PO Box C700, West Conshohocken, PA 19428-2959,
United States. Individual reprints (single or multiple copies) of this standard may be obtained by contacting ASTM at the above
address or at 610-832-9585 (phone), 610-832-9555 (fax), or (e-mail); or through the ASTM website
(www.astm.org). Permission rights to photocopy the standard may also be secured from the Copyright Clearance Center, 222
Rosewood Drive, Danvers, MA 01923, Tel: (978) 646-2600; />
17