emotion based image retrieval an artificial
Bạn đang xem bản rút gọn của tài liệu. Xem và tải ngay bản đầy đủ của tài liệu tại đây (545.04 KB, 8 trang )
Emotion-based Image Retrieval—an Artificial
Neural Network Approach
Katarzyna Agnieszka Olkiewicz
Institute of Informatics
Wroclaw University of Technology
Wroclaw Wyb. Wyspian skiego 27, Poland
Urszula Markowska-Kaczmar
Institute of Informatics
Wroclaw University of Technology
Wroclaw Wyb. Wyspianskiego 27, Poland
Abstract—Human emotions can provide an essential clue in
searching images in an image database. The paper presents our
approach to content based image retrieval systems which takes
into account its emotional content. The goal of the research
presented in this paper is to examine possibiliti es of use of
an artificial neural network for labeling images with emotional
keywords based on visual features only an d examine an influence
of used emotion filter on process of similar images retrieval. The
performed experiments have shown that use of the emotion filter
increases performance of the system for around 10 percent. points
Index Terms—Artificial neural network, feature selection , sim-
ilarity measures, emotion recognition, image retrieval, relevance
feedback.
I. INTRODUCTION
I
N RECENT years an increase of co mputer stor age capacity
and Internet resources can be observed. Fast development
of new image and video te chnologies and easy access to
sophisticated forms of information demand constantly improv-
ing searching and processing tools. Existing methods of text
docume nts retrieval give satisfying results, so now research is
focused on images retrieval. Finding the right set of im a ges
in a base containing thousands of them is still a ch allenging
task. Few working methods wer e created and developed to
solve the issue. The first category of approaches is based on
textual annotations. It assumes that every image in the database
has a label describ ing its content. Systems, which use only
annotations, are nothing more th an text-based sear chers.
Another way of dealing with the same problem is based
on observation that textual labels are not always available.
Content based image retrieval (CBIR) systems assume that
many features useful during searching process can be extracted
from the image itself. In the approach looking for similar
images may be reduced to measuring a visual distance between
them. Many of the systems use color in formation; as an
example we can point the paper [1], where authors created
images retrieval system based on color-spatial information .
The main difference between both approaches is the type
of similarity they can find. Textual searchers are capable to
find semantic similarity, also named similarity of ideas (for
example tiger in summer and tiger in winter) and content based
searchers return visually similar images, even if they present
different ideas.
CBIR systems look for similar images, but criteria of
similarity are not explicitly defined. They can take into account
image coloring, objects included in it, its category (for instance
outside or inside) or its emotion (also called mood or feeling).
The last on e , depen ding on interpretation, can be seen as
emotional content of a picture itself or an impression it makes
on a human. In the paper we consider both definitions as
equivalent. These systems are called EBIR (Emotion Based
Image Retrieval) and they are a subcategory of CBIR ones.
The term EBIR was introduced in the paper [2].
The most of research in the area is focused on assigning
image mood on the basis of of eyes and lips arrangement,
because the studies concentrate on images containing faces.
In the current version of our research we a ssumed that
emotional content is characterized by image coloristic, texture
and objects represented by edges, and the information can be
used in similar images retrieval process. An exten sio n of this
list can contain faces or other objects and symbols which can
have an influence on the image affect.
When talking about emotions, we can not skip two im-
portant topics: subjectivity and the emotion classification. As
stated in the pa per [3], different emotio ns ca n appear in a
subject while looking at the same picture, depending on a
person and its current emotiona l state. But what we are looking
for is not a system perfectly matching images and emotions.
Our far reaching aim is to build a system, which can in
an effective way support a searching pro cess and increase a
number of relevant pictures returned by any given quer y. The
goal of the research presented in this paper is to examine
possibilities of use of an artificial neural network for labeling
images with emotional keywords based on visual features only
and examine a n influence of used emotion filter on process
of similar images retrieval. Advantages of such approach is
easiness adjustment to any kind of pictures and emotional
preferences. Neural networks are machine learning techniques
well known because of th eir noise resistance, which is very
desirable feature in this application.
The paper is organized as follows: in the section II various
approaches to image emotional content rec ognition described
Proceedings of the International Multiconference on
Computer Science and Information Technology pp. 89–96
ISBN 978-83-60810-27-9
ISSN 1896-7094
978-83-60810-27-9/09/$25.00
c
2010 IEEE 89
in a domain literature are presented. I n the section III a
general overview of the system is presented, together with a
description of used visual descriptors and measurement of the
image similarity. The constructed neural network is presented
and a note about image databa ses used for learning and testing
is added. In the section IV results of perfor med experiments
are presented and an analysis of the results is given. Finally,
in the section V, a conclusion and further work directions are
proposed.
II. RELATED WORKS
Broadly speaking there are three main methods of acquiring
emotional info rmation from pictures: labels’ analysis, face
expression’s analysis and visual content analysis. The first
method is based on textual descriptions of pictures and dic-
tionaries of emotional terms. An example of such approach
is pre sented in the paper [4]. The second method is used
only to find emotions in pictures of human face and further
applied for example in human-robot interactions. Analysis of
faces are presented in the paper [5]. The last method assumes
no information about pic tures. Extraction of visual features is
based on ly on properties like color and texture. The method
was implemented in some systems, for example in the one
presented in the paper [6].
A problem co nnected with EBIR systems is con nected to
sets of emotions considered by their authors. Many classifica-
tions of emotions exist; that is why it is difficult to compare
them. The simplest set, presented in the paper [7], contains
positive-negative categories. In [4] the basic emotion set is
as follows: happiness, sadness, anger, fear and disgust. In the
paper [5] surprise has been added to the above set. Autho rs of
the p aper [8] removed disgust from the set, but added neutral
emotion and hate.
Another way of classification of images is based on
adjectives describing more objective attributes of a pic-
ture, like a warm-cold, static-dynamic, heavy-light set, pre-
sented in [6]. Auth ors of the paper [9] developed the con-
cept and created the following set: exhilarated-de pressive,
warm-cool, happy-sad, light-heavy, hard-soft, brilliant-gloomy,
lively-tedious, magnificent-modest, vibrant-desolate, sh owy-
elegant, clear-fuzzy, fanciful-realistic. Some other proposals
are: Kobayashi’s words (used for example in the paper [2])
and space of valence-arousal-control describing em otions,
presented in the paper [3].
Let us recall that for learning rules of matching visual
features to emotions some solutions were also developed. The
most common are: regression [9], neural networks [5] [8] [10]
and genetic algorith ms [10]. Our system does not use any rules
for classification; it is not a hybrid system also.
III. NECR – NEURAL-BASED EMOTIONAL CONTENT
RETRIEVAL SYSTEM
As we have mentio ned above, the research investigates
the feasibility of use of visual features for the retrieval of
emotional content of images and tests feasibility of training
ANN to accomplish classification task. To achieve this goal,
Fig. 1. Schema of the system
a prototype system has been designed and implemented. The
next subsection pre sents an idea of our approach.
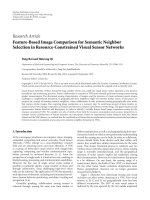
A. Idea
A general idea of the system is presented in Fig. 1. The
system consists of a data base of images, neural ne twork,
searching engine and interface to communicate with a user.
All images in the database need to be preprocessed in order
to find their visual feature descriptors, which refer to coloristic,
texture and edges in pictures. We assume that the system
is able to recognize an emotional content of images on the
basis of classification method . Classification is performed by
a supervised trained neural network. A learning set for the
network was prepared manually, by assigning class labe ls to
images from the database.
In our system in order to test an influence of the visual
feature descriptors on an ability to recognize the emotional
content of images and to find similar images, we have consid-
ered three various groups of emotion classification:
• positive-negative with neutral option,
• groups of adjectives:
– warm, cold, neutral,
– dynamic, static, neutral,
– heavy, light, neutral,
– artificial, natural; to distinguish between photos and
hand-made pictures,
• 5 b asic emotions (happiness, sadness, anger, disgust and
fear).
After the training process the ne ural network is ready to
assign em otions to pictures; one emotion f rom each catego ry,
what makes 6 labels for each picture. However, before any
classification can take place, images need to be pr eprocessed.
As a result of this step, visual descriptors are calculated and
stored in the database, together with pictures. The network
uses values of descriptors in classification process, and as-
signed labels are also stored in the database. The first stage
of system’s work is presented in Fig. 2.
Searching engine takes infor mation about the pictures from
the database and about the query image, calculated on an
ongoing b a sis. As a result of the engine’s work, 12 the most
similar images are returned. The user can accept results or
run the program again, with a modified query. The new query
contains of an original picture and these of returned 12,
which the user has marked as appropriate. The process can
90 PROCEEDINGS OF THE IMCSIT. VOLUME 5, 2010
Fig. 2. Preparation of data
be repeated many times if needed. In a multi-images query,
for each quer y image the most similar pictures are found and
then a common list is built, as an average of distances be tween
query images and images from the database.
Visual descriptors are calculated and emotional classifica-
tion is made only once for each database; it means that if a
user does not change the database, the program will run much
faster. Because a query image can be of any kind, descriptors
for it are always calculated, even if the picture belongs to the
database. There is no option of retraining the network in the
progr am.
B. Visual descriptors
Extracting information from a picture is a challenging task.
Descriptors need to meet performance, reliability and accuracy
criteria. Standard MPEG-7 defines some descriptors, which
can be used for similar images retrieval (from the Internet
article [11]). Some of the proposed there descriptors were used
already in image retrieval systems [6]. Th ey allow acquiring
informa tion about colors, edges and textur es. In the system,
three of them are used: Edge Histogram, Scalable Color De-
scriptor and Color Layout Descriptor. We base on imp le menta-
tions published in [12]. Additionally, two commonly available
custom descriptors are used: CEDD and FCTH (described in
[13] [14] [15]). They combine information about colors and
edges or textures respectively.
Edge Histogram returns 80 numbers representing quantity
of edges: 16 r egio ns x 5 directions of edges (vertical, hori-
zontal, 2 diagona ls and without direction). We added global
number of edges for each ca tego ry to let the network to
easily label pictures w ith dominating edges direction. Scalable
Color Descriptor divides color space into 256 colors and
calculates per centage of a picture covered with that color.
Color Layout Descriptor divides picture into 64 regions and
chooses a dominan t color for each region. It allows us to obtain
spatial-color information. CEDD (Color and Edge Directivity
Descriptor) divides a picture into 1600 regions. 144 numbers
are obtained as count of regions for each combina tion of
24 co lors and 6 types of edges. FCTH (Fuzzy Color and
Texture Histogram) works similar as CEDD, but in place o f
6 categories of edges, it uses 8 categories of textures, what
gives 192 numbers representing each picture.
The purpose of using so many descriptors is to acquire as
much information about a picture as possible and as a result
- to train the network efficiently. Of course, balance between
amount of information collected by the system and processing
time has to be fo und.
C. Neural network
The multi-layered perceptron neural network is used for
emotional image classification on the basis of its visual
descriptors, because it is universal, easy to construct and it
perfor ms well. Neu ral networks can distinguish between very
similar input vectors and are immune to redund a nt or noisy
informa tion. We wanted to make classification of input images
as consistent as possible, but it is not possible to judge few
thousand s of pictures in the same way. There is no theoretical
model matching visual content of a picture to its emotional
content. Neural networks have the ability to find schemas and
rules even in such extreme environment.
After the pr eprocessing stage every image from the base is
represented by its visual features vector v. The fir st elements
of the vector v refer to SCD, the next to CLD, EH and the last
two to CEDD and FCTH. In other words, for i-th image in
database vector v
i
is composed of 5 component vectors (eq.1)
v
i
= [v
SCD
, v
CLD
, v
EH
, v
CEDD
, v
F CT H
] (1)
The query image is processed in the same way and is also
described by its visual features vector v
q
.
Vector v is an input for the neural network. Its length is
equal 869, so the number of inputs of neural network is also
equal 869. It is worth pointing out that values of each element
in vector v are scaled in the range ( 0-1). In the output layer we
have 19 neurons. They encode 18 different emotions belonging
to 6 categories. An answer of the output neu ron equals to 1
indicates presence of a particular emotion. Only one emotion
from eac h of 6 sets given in th e section III-A can be present,
so from all output neurons representing a c ategory the on e
with the highest activation is chosen an d its value is set to 1.
For all others within the same c a tego ry 0 is set.
The network contains three layers: input, hidd en and output.
All output neurons are connected with all hidden ones; 128
hidden neurons are connected with input ones in a way allow-
ing better feature and pattern recognition. It means that hidden
neurons are responsible for discovering only one feature. The
schema of the network is pre sented in Fig. 3 . For clar ity
reasons, only one set of co nnections be twe en hidden and
output neurons is shown.
It is visible that hidden neurons have their unique role in
the classification process and are responsible for detecting
only one kind of feature. Such specialized structure of the
network was inspired by a uthors of the paper [16 ]. Because
of limited set of connections between input and hidden layers
(the network is not fully connected), learning process takes
considerably less time. Mor e complex structures with two
hidden layers or more hidden neurons in already existing layer
KATARZYNA AGNIESZKA OLKIEWICZ, URSZULA MARKOWSKA-KACZMAR: EMOTION-BASED IMAGE RETRIEVAL 91
8
8
8
8
8
Fig. 3. Schema of the network. Only one set of connections between hidden
and output neurons is shown
were considered as well. But, with c oncern about speed of
images’ classification and retrieval proc esses, we decided to
use a simpler model.
After processing by the neural network each i-th image is
represented by two vectors: vector of visual descriptors v
i
and
vector o f emotions e
i
.
D. Similarity of images
To measure similarity between a query image and i-th image
in the database, the distance between the m is calculated. In
some experiments we take only visual similarity, in other
experiments w e take both visual and emotional similarities
(both vectors v and e were considered in this case). Let us
focus on vector v first. The distance is separately assigned
for each co mponen t vector v
SCD
, v
CLD
, v
EH
, v
CEDD
and
v
F CT H
. It is weighted and su mmed as in eq. 2.
d
′
= w
SCD
· d
SCD
+ w
CLD
· d
CLD
+ w
EH
· d
EH
+ (2)
+w
CEDD
· d
CEDD
+ w
F CT H
· d
F CT H
Where w with an index denotes a weight of a given part of a
distance com ponent. The final distance d between query image
and i-th image in the base is a weighted average. It is expressed
by eq. 3.
d =
d
′
w
SCD
+ w
EH
+ w
CLD
+ w
CEDD
+ w
F CT H
(3)
Fig. 4. An example of calculation of distance between a query images and
images from the database
The way of distance computation was inspired by the paper
[15], where the detailed description of the method can be
found. To measur e the distance on the basis of the part v
CLD
the method was modified to deal with the three values referring
to the thr ee components of a color. The distance is tran sf ormed
into the range (0-100). In particular 0 means the same image.
Fig. 4 shows an example of visual distance calculation between
a query image and each of images in the database. For the
query image the similarity vector to each image in the base is
obtained.
In the performed experiments weights w
F CT H
and w
CEDD
were set to 2, because these descriptors have the best ind ivid-
ual retrieval scores. Remaining weights were equal to 1.
The second component in evaluation of images similarity
takes into account emotional aspect and is based on the vector
e. For every matching label, 1 is added to a temporal result
and then the final number is casted on the range 0-100, with
0 denoting maximal similarity. The query image is described
by a vector of emotional similarities to each database image.
Finally, both results (visual and emotional) are added and
divided by 2. This is the final answer of the system. Whole
method is illustrated by Fig. 4.
In a case with multiple query images, an average from all
rankings is taken. Twelve images from the database with the
smallest values are presented to the user. A case with multiple
query images is presented in Fig. 5.
IV. EXPERIMENTAL STUDY
To evaluate performance of our system and effectiveness
of the similar images retrieval method, we performed some
experiments. We assessed performance of the neural network
(correct emotions assignment) and accuracy of retrieval results
indepen dently, with concern about various factors which can
influence the performance.
The testin g set in these experiments consists of 42 images,
labeled manually and checked for consistency with labe ls
given by the network. We te sted the network trained on two
different learning sets and we compared results. Details are
92 PROCEEDINGS OF THE IMCSIT. VOLUME 5, 2010
Fig. 5. An example of finding similar images to a multiple query
presented in subsection IV-A. We also did cross-validation
tests.
The second part of these tests, dedicated to overall system
perfor mance analysis is more complex. We tested the system
against many factors: various query images, image databases,
learning sets and finally we evaluated difference in perfor-
mance given by an emotions recognition module. Details are
presented in the following subsections.
A. Datasets
Few image sets were created f or learning and testing pur-
poses. Because the system is supposed to support emotion
based image retrieval, construction of sets was made with high
consideratio n of an emotional content of pictu res, especially
for learning sets creation. The images in learning set were
selected in a way which provides a fair representation of
variously labeled pictures (the learning set consists of pictures
labeled by every emotion from the set of 18 emotions). Fig. 6
presents the number of representa tive images in LS3 be longing
to the particular emotions’ categories.
First learning set (LS1) was intended to support good dis-
tinction between warm-cold, heavy-light and positive-negative
categories and it consists of 893 pictures. It contains mainly
landscape pictures, so expressing dynamism or anger is not
possible there. Second learning set (LS2) was intended to
support these categories, which are not supported in the
first one: basic emotions, dynamic-static and artificial-natural
and is built from 636 images. It contains images returned
by searching en gine like Flickr and Google for em otional
Fig. 6. Number of representatives of emotions in LS3
TABLE I
CROS S-VALIDATION TESTS FOR THE NEURAL NETWOR K
Subject Accuracy Deviation
Percent of correctly assigned (CA) labels 64.4 2.15
Percent of CA labels for warm-cold 80 2.32
Percent of CA labels for light-heavy 62.4 4.03
Percent of CA labels for dynamic-static 67.6 6.15
Percent of CA labels for artificial-natural 82 3.6
Percent of CA labels for positive-negative 55 4.1
Percent of CA labels for basic emotions 52 4.26
keywords queries. But, the neural network trained on th is set
can not classify correctly any general images (for example
landscapes), so third one (LS3) was made from 1456 pictures.
It contains pictures from previous two sets, to support all
classifications.
Three image sets are used in experiments, to evaluate
perfor mance of the system. All of them con ta in various
pictures, belonging to different categories. We tried to balance
quantity of representatives of every category. The first set
(DB1) contains 2096 images, mostly landscapes. The second
set (DB2) contains 1456 images, mostly emotio nally rich and
artificial ones. The third set (DB3) contains 1612 images,
mostly natural ones and photos of people.
B. Evaluation of neural network performance
The network was trained with back-propa gation method.
The following values of parameters were set: learning rate
0.1, number of epochs 500, mo mentum 0.6, sigmoid unipo la r
activation function and error tolerance 0.1. For every learning
set the network is trained only once and after that it is used
in experiments.
Performance of the neura l ne twork was checked in two
indepen dent tests: by 5- c ross-validation method and on a
testing set of imag e s different from learning sets. Cross-
validation was performed with use of LS3 data set. The results
are presented in Table I.
It is visible that performance of the network depends heavily
on subsets c hosen for learning and testing (the standard
deviation can be as high as 6.15). But high classification score
for one category has its drawback - lower scores fo r other
categories: the network trained on the 3rd subset classified
correctly 78 % of pictures according to dynamic-static category
had lower classification score for all other categories.
To determine performance of the network in an unknown
environment, 42 different from lear ning sets p ic tures were
chosen a nd classified by the network. The n, an automatic
classification was compared with a manual one and results
are shown in Table II .
In the test the learning sets LS1 and LS3 were used. The
learning set LS2 was build only from pictures returned as
results for emotional keywords qu eries and a network trained
on it would not be able to determine a category of emotion
properly 1-4 (rows 4-7 in Table II).
KATARZYNA AGNIESZKA OLKIEWICZ, URSZULA MARKOWSKA-KACZMAR: EMOTION-BASED IMAGE RETRIEVAL 93
TABLE II
COMPARISON OF PERFORMANCE OF TH E NEURAL NETWORK TRAINED
WITH USE OF 2 TRAINING SETS
Subject Set LS1 Set LS3
1 Percent of correctly classified images 8 17
2 Percent of images with 1 wrong label 22 37
3 Percent of correctly assigned (CA) labels 64 73
4 Percent of CA labels for warm-cold 78 87
5 Percent of CA labels for light-heavy 62 74
6 Percent of CA labels for dynamic-static 70 69
7 Percent of CA labels for artificial-natural 70 83
8 Percent of CA labels for positive-negative 51 64
9 Percent of CA labels for basic emotions 49 60
Percentage of correctly assigned lab els is used as measure-
ment of system’s efficiency because more c ommon measures
like recall and precision can not be used here. The system has
to return 12 p ictures in every run, so there is no po ssibility to
define a set of false positives (even if some pictures score less
than others, they are still present in results as complement
to true positives). Moreover, if more than 12 images in the
database are similar to the query image, the system has no
possibility to show them all as a result.
As it can be seen in Table II, the network trained on a more
general learning set (LS3) performs better tha n the one trained
on less gene ral one (LS1). The most problematic categories are
basic emotions and positive-negative. It proves that emotional
content of pictures can not be fully expressed only with chosen
by us visual descriptors.
The network was trained two times on learning set LS3
(starting from random values of weights) and answers of the
network from both trials were compared. Only in 17% of cases
both networks were wrong and most of these mistakes were
connected to basic emotions, which were not possible to be
discovered without semantic knowledge about the picture. In
20% of cases one of the networks was wrong.
In most cases a network trained on the whole set L S3
perfor med better than the one trained on 80% of the set,
even though test pictures here differed more than in the
previous experiment. For dynamic-static, artificial-natural and
positive-negative categories some subsets from the previous
experiments scored higher than the network in the current
one (trained on the whole set LS3). It can be explained in
two ways: test images in the second experiment were more
difficult to be classified and random division of the 3rd set
favored different categories in different su bsets.
C. Different image sets
Three different sets of pictur e s (DB1, DB2 and DB3) were
created in order to test retrieval performance of the system.
Results of experiments are presented in Table III. We are
interested in number of runs (queries) needed to find all similar
images from the sets. Three numb ers, separated by commas,
in every cell denote three sets. The network trained on the
third learning set was used in the section.
TABLE III
PERFORMANCE OF THE SYSTEM AG AINST DIFFERENT QUER I ES AND SETS.
THREE NUMBERS, SEPARATED BY COMMAS, IN EVE RY CELL DENOTE
RESULTS REF ERRING TO THREE SETS
Picture N
sr
N
pr
N
Runs
black-white 2, 2, 3 2, 2, 1 1, 1, 1
red flower 10, 4, 10 5, 1, 5 5, 2, 4
lagoon, mountain 4, 4, 5 4, 4, 1 1, 2, 1
tropical forest 9, 11, 6 3, 4, 3 1, 3, 2
iceberg 8, 8, 2 6, 7, 0 2, 2, 0
sunset 12, 15, 5 10, 12, 4 4, 7, 1
red, shouting man 1, 6, 1 1, 6, 1 1, 1, 1
grey-scale 2, 7,- 1, 2, - 1, 1, -
worm -, 6, - -, 3, - -, 2, -
boxing fight -, 7, - -, 6, - -, 2, -
In Table III N
sr
refers to th e number of pictures in the set,
which are similar to the query image. N
pr
refers to the number
of relevant pictures returned by the system and N
Runs
refers
to the number of searching trials the system had to perform to
retrieve such results. Three numbers separated by commas in
every c e ll denote results for every set: the first number refers
to DB1, the second to DB2 and the third to DB3.
Some problems are shown here: color quantization and
difficulty in finding precisely described set in hundreds of
very similar pictures. Still, cha racteristic images are easy to
find and overall results are very good. In many cases one
query is enough to find the wh ole set, in others rerunning the
progr am allows to receive better results. Images containing
worms and boxing fights were present only in one set, so for
others ”-” is placed in Table III. The set DB3 contains pictures
similar semantically to query images, but not visually, that is
why retrieval results are worse than for the o ther two sets.
D. Emotions’ filter
Emotion filter is a tool which uses vector e to produce
final similarity scor e between two pictures as shown in Fig.
4. Without it, o nly vector v is used. To evaluate an input of
an emotion filter to the final result, the same tests as in the
subsection IV-B were run, but without calculating the vector
of e motional d istance between pictures. Results are presented
in Table IV.
It is clear that emotions are importan t in the image retrieval
process and improve results of traditional CBIR systems. I n
the EBIR system, more adequate pictures are found and it
is done faster. Mo reover, it can be noticed that the number
of not relevant images (for example green building re turned
for tropical forest query) decreases when emotions’ filter was
used. Quality of results is higher for the system with the filter,
what supports our theory.
To evaluate influence of the emotional filter, we created a
metrics of e fficiency E, expressed by eq. 4.
E =
N
pr
N
sr
1 + 0.05 · (N
Runs
− 1)
· 100% (4)
94 PROCEEDINGS OF THE IMCSIT. VOLUME 5, 2010
TABLE IV
PERFORMANCE OF THE SYSTEM WITHOUT EMOTIONS’ FILTER. THREE
NUMBERS, SEPARATED BY COMMAS, IN EVERY CELL DENOTE RESULTS
REFERRING TO THREE SETS
Picture N
sr
N
pr
N
Runs
black-white 2, 2, 3 2, 2, 0 1, 1, 0
red flower 10, 4, 10 4, 0, 6 8, 0, 6
lagoon, mountain 4, 4, 5 4, 4, 4 3, 2, 5
tropical forest 9, 11, 6 3, 4, 0 1, 3, 0
iceberg 8, 8, 2 6, 7, 0 2, 2, 0
sunset 12, 15, 5 6, 6, 4 3, 3, 1
red, shouting man 1, 6, 1 1, 6, 1 1, 1, 1
grey-scale 2, 7, - 0, 2, - 0, 2, -
worm -, 6, - -, 1, - -, 1, -
boxing fight -, 7, - -, 5, - -, 2, -
where:
N
pr
– number of pictures returned,
N
sr
– number of pictures that should be returned,
N
Runs
– number of runs. T his metrics describes accuracy in
relation to the number of runs. In the case with use of emotion
filter E equals to 71%, 67% and 47% for sets DB1, DB2 and
DB3 respectively. In the case without emotions filter E is equal
to 59%, 57% and 42% for the same sets. Average decrease in
perfor mance is 9 percent points. The biggest differences in
perfor mance for various pictures are 31 percen t points for a
worm, 27 percent points for a grey-scale image and 19 percent
points for a sunset. A lagoo n picture score d 12 percent points
better without emotions filter, but it is the only exception.
Detailed comparison between the resu lts presented in two
tables is illustrated in Fig. 7. Further conclusions are given in
the subsection IV-E. Comparison between Ta bles III and IV
shows that decrease in quality of results for the case without
emotions filter is 17% and speed de crease is equal to 17%.
Additionally, in a case with use of emotions filter, only in two
situations no similar images were retrieved, but in the case
without the filter – five times.
Fig. 7. Value of metrics E for different sets and pictures
TABLE V
PERFORMANCE OF THE SYSTEM AGAINST DIF FERENT LEARNING SETS
Picture N
sr
N
pr
N
Runs
black-white 2 2, 2 1, 2
red flower 4 1, 0 2, 0
lagoon, mountain 4 4, 4 2, 1
tropical forest 11 4, 4 3, 3
iceberg 8 7, 7 2, 1
sunset 15 12, 7 7, 3
red, shouting man 6 6, 6 1, 2
grey-scale 7 2, 2 1, 1
worm 6 3, 1 2, 1
boxing fight 7 6, 6 2, 3
E. Different learning sets
Two learning sets were tested here: LS1 and LS3. Retrieval
perfor mance was checked in the same way as in previous
sections (but only the DB2 set was used). Here numbers in
cells denotes two lea rning sets. The first number belongs to
the th ird set and the second one to the first set. Results can
be found in Table V.
It can be seen that learning set influences retrieval re sults,
so it should be chosen with high consideration about databases
with which it will work or, in case when a working en-
vironm e nt of the system is not known, learning set should
be universal and should contain all kinds of pictures. Still,
learning sets influence less overall system performance tha n
lack of the emotion filter.
V. CONCLUSION
Our sy stem is capable o f finding similar images in a
database with relatively high accuracy. Use of th e emotion
filter increases performance of the system for around 10
percent points. Experiments showed that average retrieval rate
depends on many factors: a database, a query image, number
of similar images in the database and a training set of the
neural network. Although a user not always rec e ives satisfying
results during the first run of the searching engine, in most
cases, after few runs they are satisfying.
Interface of the application and results returned by the
system for a query image (boxing fight) are presented in Fig. 8.
Further improvements to the system are c onsidered. To
increase accuracy of the results, a module for face detection
and analyzing face expression can be added. More work is
needed to develop the sy stem in a way allowing it to analyze
existing textual descriptions of images and other meta-data.
More accurate and informative descriptors can be also created.
Another idea is to build a system containin g two or more
neural networks and use them as an ensemble classifier.
To fully evaluate the results obtained with the neural net-
work in future we plan to apply another classifier instead.
Bayesian models, linear models, decision trees and K-NN
methods are concerned.
KATARZYNA AGNIESZKA OLKIEWICZ, URSZULA MARKOWSKA-KACZMAR: EMOTION-BASED IMAGE RETRIEVAL 95
Fig. 8. An example of program’s run
VI. ACKNOWLEDGEMENT
This work is partially financed from the Ministry of Science
and Higher Education Republic of Poland resources in 2008
2010 years as a Poland-Singapore joint research project 65/N–
SINGAPORE/ 2007/0.
REFERENCES
[1] Y. Jo and K. Um, “A signature representation and indexing scheme of
color-spatial information for similar image retrieval,” IEEE Conference
on Web Information Systems Engineering, vol. 1, pp. 384–392, 2000.
[2] Y. Kim, Y. Shin, Y. Kim, E. Kim, and H. Shin, “Ebir: Emotion-based
image retrieval,” in Digest of Technical Papers International Conference
on Consumer Electronics, 2009, pp. 1–2.
[3] A. Hanjalic, “Extracting moods from pictures and sound,” IEEE Signal
Processing Magazine, vol. 23, no. 2, pp. 90–100, 2006.
[4] S. Schmidt and W. G. Stock, “Collective indexing of emotions in images.
a study in emotional information retrieval,” Journal of the American
Society for Information Science and Technology, vol. 60, no. 5, 2009.
[5] F. Siraj, N. Yusoff, and L. Kee, “Emotion classification using neural
network,” in International Conference on Computing & Informatics,
2006, pp. 1–7.
[6] E Y. Park and Y W. Lee, “Emotion-based image retrieval using
multiple-queries and consistency feedback,” in 6th IEEE International
Conference on Industrial Informatics, 2008.
[7] Q. Z hang and M. Lee, “Emotion recognition in natural scene images
based on brain activity and gist,” in IEEE World Congress on Compu-
tational Intelligence, June 2008.
[8] Y. Guo and H. Gao, “Emotion recognition system in images based on
fuzzy neural network and HMM,” in 5th IEEE International Conference
on Cognitive Informatics, 2006, pp. 73–78.
[9] W. Wang, Y. Yu, and S. Jiang, “Image retrieval by emotional semantics:
a study of emotional space and feature extraction,” in IEEE International
Conference on Systems, Man and Cybernetics, vol. 4, 2006, pp. 3534–
3539.
[10] Y. Sun, Z. Li, and C. Tang, “An evolving neural network for authentic
emotion classification,” in 5th International Conference on Natural
Computation, 2009, pp. 109–113.
[11] (2010) Standard mpeg-7. [Online]. Available: ariglione.
org/standards/mpeg-7/mpeg-7.htm
[12] (2010) Implementation of visual desciptors descrobed in standard
mpeg-7. [Online]. Available: />here-acm-multimedia-2007.html
[13] S. Chatzichristofis and Y. Boutalis, “Cedd: Color and edge directivity
descriptor - a compact descriptor for image indexing and retrieval,” in
6th Interntional Conference in Advanced Research on Computer Vision
Systems, 2008.
[14] S. Chatzichristofis and B. Yiannis, “Fcth: Fuzzy color and texture
histogram, a low level feature for accurate image retrieval,” Ninth
International Workshop on In Image Analysis for Multimedia Interactive
Services, pp. 191–196, 2008.
[15] (2010) Implementation of descriptors cedd and fcth. [Online]. Available:
/>[16] H. Rowley, S. Baluja, and T. Kanade, “Neural network-based face detec-
tion,” IEEE Transactions on Pattern Analysis and Machine Intelligence,
vol. 20, no. 1, 1998.
96 PROCEEDINGS OF THE IMCSIT. VOLUME 5, 2010