Advanced 3D Software Systems for Effective Environmental Management
Bạn đang xem bản rút gọn của tài liệu. Xem và tải ngay bản đầy đủ của tài liệu tại đây (749.64 KB, 6 trang )
Advanced 3D Software Systems for Effective Environmental Management
I.K. Kapageridis
Maptek/KRJA Systems Ltd.
ABSTRACT
Environmental management and planning
requires the integration of large volumes of
disparate information from many sources and
the analysis of this information with efficient
tools for assessment and evaluation. Effective
methods of communication that allow
interactive participation in the planning,
assessment and decision-making processes are
also very important. The VULCAN software
package from Maptek (Pty) Ltd comprises a
large number of 3D graphical tools within an
interactive 3D interface called ENVISAGE.
These tools are designed and developed to help
engineers and scientists to identify and solve
environmental problems. The combination of
VULCAN 3D Software and the I-SiTE 3D
Laser Imaging system leads to powerful
solutions for environmental management. This
paper presents the capabilities of this integrated
system and its applications for environmental
management.
1. INTRODUCTION
In the past couple of decades the extractive
industry has developed and adopted new
techniques for designing the restoration and
reclamation of disturbed sites. New
environmental laws meant more strict design
and monitoring of the reclamation process is
necessary. This led to the development of new
computer tools that help achieve the difficult
targets that new legislation established.
The advanced visualisation and
computational power provided by modern
hardware and software systems allows their use
for environmental management. The
sophisticated software system provided
nowadays to the extractive industry are capable
of transforming complex designs and
simulations to virtual reality models that help
understand and even improve on the effects of
the extractive process to the environment.
Potential environmental problems and pollution
impacts can be traced using these models before
or during the extractive process, or to support a
public inquiry.
Maptek has been developing specialised
software for the mining industry for over 25
years. Maptek’s VULCAN 3D Software suite
and the most recent I-SiTE Laser Imaging
system are software/hardware systems
developed with environmental management in
mind. These systems combined can handle large
amounts of data as well as environmental, local
access and economic constraints integral to
rehabilitation design.
Advanced software and hardware systems
like VULCAN 3D Software and the I-SiTE
Laser Imaging system are successfully used by
companies around the world in complete mine
feasibility and environmental impact assessment
studies. In the pages that follow it will be
explained how these systems are utilised for
effective environmental management in a
number of case studies.
2. 3D TOOLS & METHODOLOGY
2.1 Overview
VULCAN offers powerful modelling tools,
which, coupled with state-of-the-art 3D graphics
deliver a valuable solution to the mine planner.
Concentrating to environmental management
applications, the system provides efficient tools
for data integration, analysis and commu-
nication, supporting an interactive, intuitive
approach to meeting planning requirements and
raising community awareness. VULCAN
assimilates site assessment data in order to
develop and visualize restoration strategies
using 3D interactive graphics. The ability to
evaluate and present all possible scenarios
during planning and remediation exercises
facilitates communication, ensuring optimum
decision-making (Neilson & Kapageridis,
2000).
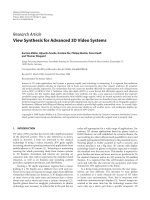
Figure 1: Matching image pixels to real world co-
ordinates for texture mapping.
2.2 Texture Mapping
Texture mapping is the process of draping an
image on a 3D triangulation model. The image
can be an aerial photograph, a map, or any other
picture of the real world. The combination of
this image and the model of the surface where
the image came from give a very realistic result
and help to build more recognisable models. All
that is necessary is a set of control points that
match image pixels to real world co-ordinates
(actually model co-ordinates) (Figure 1).
The image and control points are saved in a
separate file, which means that any model
within the image co-ordinate range can then be
visualised with the image draped on it.
VULCAN handles large triangulation models
that, depending on the available hardware, can
consist of hundreds of thousands of faces
(triangles). These models can be visualised with
an image draped on them. The image colours
can be shaded according to the details of the
model (Fig. 2).
Figure 2: Image draped on triangulation and shaded
according to a light source.
The result can be combined with further mine
development (Figure 3).
Figure 3: 3D view of mine model and surrounding
topography with aerial photograph.
2.3 Imaging Options
The imaging module provides means for
extracting true 3D measurements from a pair of
images and a set of ground control data.
Digital images in several formats, including
GIF, PhotoCD and RGB, are accepted and may
be loaded into the Image Viewing window
(Figure 4). In this view, zooming and panning
are easily controlled to give detailed views of
one or two images.
Figure 4: Different views of two images from the same
mine location displayed in the Image Viewing window.
Ground control data may be entered through
the specialised options. These data may then be
combined with the images to produce a pexel
file, or saved for further processing.
An auto-matching routine is provided that
combines a pair of images, resulting in a set of
matching points. These points may be then
imported into the module, viewed, edited and
saved. When combined with the ground control
data, these points form a set of 3 dimensional,
real world coordinates. They may also be used
to produce a triangulation, onto which an
automatically generated pexel file may be
draped and from which more detailed
measurements may be taken.
2.4 Animation & Real-time Navigation
VULCAN’s 3D graphical environment,
ENVISAGE, allows real-time movement
through model space while the user is working
on the model. There are various options for
animation, viewing, or even navigating through
the model.
The ANIMATION option allows the user to
display any data set (polygons, grids or
triangulations) in a specified time sequence. The
main feature is the ability to drive the visibility
of many objects or data sets loaded onto the
screen. These data could be grouped through
frames and actors in the Animation option. In
this way, any data having similar spatial
attributes can be grouped in the same frame and
can be displayed alone at any time on the
screen. It is possible to see sequential data in a
realistic simulation.
The LOOK option allows the user to navigate
through the model in a fly-by manner with no
specific route but with mouse and keyboard
controls that allow every possible movement.
During this movement the models can retain all
their graphical attributes including textures,
shading and colour (Figure 5). The refresh rate
of the movement depends on the hardware
available and the number of faces, textures and
overall detail of the model.
Figure 5: Navigation through model space in
ENVISAGE. The heads-up display is active.
There are other options that allow specific fly-
bys, viewing from specified locations, or walk
and drive on specific paths.
2.5 Dragline Operation Simulation
The Dragline module is ideal for stratigraphic
strip mining operations and provides a suite of
tools to deal with range diagrams, reclamation
and general section design (Figure 6). Great
flexibility is provided in creating very detailed
range diagrams. You can effectively simulate
draglining, blast casting, bulldozing, truck &
shovel operations and any other kind of material
movement, to develop a series of optimised
range diagrams.
Figure 6: 3D Layout of Range Diagram Cross-sections
with Horizon Legend.
Support for grids, triangulations, and
Envisage design objects, allows easy
development of insitu block layouts.
Intersections between cross-section lines, strip
plans and horizon surfaces are calculated
automatically, to generate the initial range
diagram sections quickly and easily. Full control
is provided in setting highwall angles and bench
offsets.
An exhaustive suite of tools is provided for
moving blocks in a wide variety of ways,
allowing the user to work in a fully interactive
design environment. Complete, parametric
control of all functional dragline dimensions
provides a powerful, graphical tool for
analysing dragline capabilities and limitations.
Average dragline cycles and swing angles are
also calculated. Different swell factors and
repose angles can be applied to different
material types moved by the different
equipment.
Rehandle statistics can be accumulated on
each block movement, enabling material to be
tracked and monitored through each step of the
mining process.
Multi-coloured operation plots can be generated
automatically, showing a series of complicated
mining procedures on a single, easy-to-read plot
as shown in Figure 7.
Figure 7: Operation Plot Showing Sequence of Operations
Carried Out on a Strip.
Formatted reports can be generated on blocks
and operations, with totals and weighted
averages tallied. Reporting in CSV format
enables quick and easy importation into
spreadsheet packages, allowing scope for
additional analysis and scheduling, if required.
Topography strings are updated
automatically at every block movement. Strings
from different range diagram sections can then
be triangulated, to create a series of disturbed
surface models (Figure 8).
Figure 8: Series of disturbed surface models from
different range diagram sections.
2.6 Shaft Mapping
Shaft transformation windows provide you with
a transformed view of design data (and models)
that gives a "flattened" 2D view of the walls of
an essentially cylindrical object (e.g. mine shaft
or inclined drift) (Figure 9). The Shaft
transformation windows use a different
coordinate mapping than the normal windows.
The bearing in a shaft window is mapped to the
X axis, the level or depth above or below datum
is mapped to the Y axis and the distance from
the shaft or drift centre line is mapped to the Z
axis.
Figure 9: Shaft view (left) of shaft mapping data (right).
3. ENVIRONMENTAL APPLICATIONS
3.1 Overview
VULCAN has been used with success in a
number of environmental applications such as
post-mine topography design, groundwater
analysis, nuclear waste management, visual
impact analysis, land use management and civil
engineering works.
3.2 Post-Mine Topography Design
Post-Mine Topography (PMT) is the final
regraded and topsoiled surface of a mine site
once earthmoving and replanting has taken
place. By law, PMT plans must be submitted to
regulatory authorities as an integral part of the
process of gaining approval for future mining
activities.
PMT design involves superimposing the
regraded post-mining surface on the disturbed
mining landscape in order to be able to calculate
cut and fill required to produce the final PMT.
Traditional computerised cut and fill
calculations use cross sectional areas which are
not actually checked for 3D volumetric
accuracy.
VULCAN’s triangulated surface models can
be viewed interactively and analysed against
each other for precise volumetric balancing,
making PMT design more efficient and
accurate. An example of how VULCAN is used
for PMT design is the Rosebud Mine in the
northern Powder River basin near Colstrip,
Montana, USA. Western Energy has been using
VULCAN since mid-1992 to successfully meet
many of its post-mine topography design needs.
VULCAN’s range diagram module has been
used for simulating the disturbed topography.
The PMT surface and the disturbed surface were
triangulated and compared for cut and fill
volume balance in VULCAN. VULCAN’s
schedulling capabilities allowed a decision to be
made to move the dragline within the area being
mined into reclamation.
3.3 Groundwater Analysis
The understanding of groundwater systems is a
vital step in most environmental engineering
projects, where this can be used to model
contaminant pathways and to identify potential
water resources. The development of conceptual
hydrogeological models is usually based on the
same geological information as used for
geotechnical evaluation, site investigation and
delineation of geological features.
VULCAN can incorporate observed
hydrogeological data to interface to Modflow
(McDonald & Harbaugh, 1988) and Aquifem-N
flow codes, improving the accuracy and
confidence of the groundwater evaluation
process. The tools provided enable a number of
modelling processes incorporated in the
groundwater analysis. Specifically, VULCAN
can perform the following tasks:
− Create graphical representations of
conceptual hydrogeological models
− Display the extent and flow of aquifers in 2D
and 3D
− Allow advective transport modelling of
potentially hazardous pathways
− Integrate topographic, geological and survey
information with hydrogeological data
− Support 3D finite difference and quasi 3D
finite element codes
3.4 Nuclear Waste Management
Safe disposal of nuclear waste material requires
an accurate understanding of geological barriers
surrounding a potential repository. Conceptual
geological, geophysical and hydrogeological
models are validated by analysing site
investigation data in three-dimensional space
and through time. VULCAN permits the
integration of data from a variety of sources:
site characterisation data; formation and
geological data; mapping, core logging and
seismic data; and specialist radionuclide
transport modelling codes. Flexible design tools
allow an underground waste repository to be
modelled interactively, then validated against
the geological, geophysical and hydrogeological
data in 3D space and time.
3.5 Visual Impact Analysis
Visual impact assessment is another
information-intensive task. Traditionally,
computerised visualisation systems have had a
terrain or an urban land-use focus. VULCAN
can handle both surfaces and solids with
accuracy. The system allows the calculation of a
‘zone of visual influence’ as a series of radii
from a point on a grid that can be contoured.
The virtual reality features of the software
enable walk throughs and flybys or animation
sequences to be stored or saved to video.
3.6 Other Applications
VULCAN has been applied to other
environmental problems such as land use
management, construction of waste
management sites, hydroelectric dams (Fig. 10),
waste water storage tanks, etc.
4. I-SiTE Laser Imaging
I-SiTE 3D Laser Imaging system delivers
dynamic data capture and visualization to
instantly build 3D models with accurate co-
ordinate placement and analysis.
Figure 10: Hydroelectric dam design in Kayceri, Turkey.
The system records accurately the location of
features and surfaces in areas such as urban and
industrial settings and mine sites, both surface
and underground. It is friendly to the
environment since there is no need for removing
vegetation from the scene of the scan. This is
done in post-processing using the I-SiTE
software. The system is ideal for hazardous
environments where it could be otherwise
impossible to make measurements.
5. CONCLUSIONS
This paper has shown the main areas of
application of VULCAN and I-SiTE systems in
the field of environmental management. The
integration of different types of graphical and
numerical information in the VULCAN – ISiTE
graphical environment enables the engineer to
gain better understanding of the particular
problem and reach the best solution.
REFERENCES
Neilson, L. & Kapageridis, I.K. Environmental
Management with VULCAN, in: Ibarra-Berastergi et
al. (eds). Development and Application of Computer
Techniques to Environmental Studies VIII
(ENVIROSOFT 2000), WIT Press, Southampton.
McDonald, M.G. & Harbaugh, A.W. A modular three-
dimensional groundwater flow model, U.S. Geological
Survey Techniques of Water Resource Investigations,
Book 6, Chapter A1, 1988.