Astm d 5315 04 (2011)
Bạn đang xem bản rút gọn của tài liệu. Xem và tải ngay bản đầy đủ của tài liệu tại đây (239.93 KB, 16 trang )
Designation: D5315 − 04 (Reapproved 2011)
Standard Test Method for
Determination of N-Methyl-Carbamoyloximes and
N-Methylcarbamates in Water by Direct Aqueous Injection
HPLC with Post-Column Derivatization1
This standard is issued under the fixed designation D5315; the number immediately following the designation indicates the year of
original adoption or, in the case of revision, the year of last revision. A number in parentheses indicates the year of last reapproval. A
superscript epsilon (´) indicates an editorial change since the last revision or reapproval.
1.4 When this test method is used to analyze unfamiliar
samples for any or all of the analytes listed in 1.1, analyte
identifications should be confirmed by at least one additional
qualitative technique.
1. Scope
1.1 This is a high-performance liquid chromatographic
(HPLC) test method applicable to the determination of certain
n-methylcarbamoyloximes and n-methylcarbamates in ground
water and finished drinking water (1)2. This test method is
applicable to any carbamate analyte that can be hydrolyzed to
a primary amine. The following compounds have been validated using this test method:
Analyte
Aldicarb
Aldicarb sulfone
Aldicarb sulfoxide
Baygon
Carbaryl
Carbofuran
3-Hydroxycarbofuran
Methiocarb
Methomyl
Oxamyl
________________
A
1.5 The values stated in SI units are to be regarded as
standard. No other units of measurement are included in this
standard.
1.6 This standard does not purport to address all of the
safety concerns, if any, associated with its use. It is the
responsibility of the user of this standard to establish appropriate safety and health practices and determine the applicability of regulatory limitations prior to use. Additional guidance on laboratory safety is available and suitable references
for the information are provided(3-5).
Chemical Abstract Services
Registry Number A
116-06-3
1646-88-4
1646-87-3
114-26-1
63-25-2
1563-66-2
16655-82-6
2032-65-7
16752-77-5
23135-22-0
2. Referenced Documents
2.1 ASTM Standards:3
D1129 Terminology Relating to Water
D1192 Guide for Equipment for Sampling Water and Steam
in Closed Conduits (Withdrawn 2003)4
D1193 Specification for Reagent Water
D2777 Practice for Determination of Precision and Bias of
Applicable Test Methods of Committee D19 on Water
D3370 Practices for Sampling Water from Closed Conduits
D3694 Practices for Preparation of Sample Containers and
for Preservation of Organic Constituents
E682 Practice for Liquid Chromatography Terms and Relationships
Numbering system of Chemical Abstracts, Inc.
1.2 This test method has been validated in a collaborative
round-robin study (2) and estimated detection limits (EDLs)
have been determined for the analytes listed in 1.1 (Table 1).
Observed detection limits may vary between ground waters,
depending on the nature of interferences in the sample matrix
and the specific instrumentation used.
1.3 This test method is restricted to use by, or under the
supervision of, analysts experienced in both the use of liquid
chromatography and the interpretation of liquid chromatograms. Each analyst should demonstrate an ability to generate
acceptable results with this test method using the procedure
described in 12.3.
2.2 U.S. Environmental Protection Agency Standard:
EPA Method 531.1, Revision 3.0, USEPA, EMSLCincinnati, 19895
1
This test method is under the jurisdiction of ASTM Committee D19 on Water
and is the direct responsibility of Subcommittee D19.06 on Methods for Analysis for
Organic Substances in Water.
Current edition approved May 1, 2011. Published June 2011. Originally
approved in 1992. Last previous edition approved in 2004 as D5315 – 04. DOI:
10.1520/D5315-04R11.
2
The boldface numbers in parentheses refer to the references at the end of this
test method.
3
For referenced ASTM standards, visit the ASTM website, www.astm.org, or
contact ASTM Customer Service at For Annual Book of ASTM
Standards volume information, refer to the standard’s Document Summary page on
the ASTM website.
4
The last approved version of this historical standard is referenced on
www.astm.org.
5
Published by the U.S. Environmental Protection Agency, Environmental
Monitoring and Support Laboratory, Cincinnati, OH 45268, 1989.
Copyright © ASTM International, 100 Barr Harbor Drive, PO Box C700, West Conshohocken, PA 19428-2959. United States
1
D5315 − 04 (2011)
TABLE 1 Relative Retention Times for the Primary and
Confirmation Columns and EDLs for the 10 Carbamate
Pesticides
Analyte
Aldicarb
Aldicarb sulfone
Aldicarb sulfoxide
Baygon (Propoxur)
Carbaryl
Carbofuran
3-Hydroxycarbofuran
Methiocarb
Methomyl
Oxamyl
A
B
C
3.2.6 laboratory-fortified blank (LFB)—an aliquot of reagent water to which known quantities of the test method
analytes are added in the laboratory. The LFB is analyzed
exactly as a sample is; its purpose is to determine whether the
methodology is in control and whether the laboratory is
capable of making accurate and precise methods at the required
test method detection limit.
Retention Time (minutes)
Primary A
Confirmation B
EDL C
27.0
15.2
15.0
29.6
30.8
29.3
23.3
34.9
18.4
17.4
21.4
12.2
17.5
23.4
25.4
24.4
19.0
28.6
14.8
14.6
1.0
2.0
2.0
1.0
2.0
1.5
2.0
4.0
0.50
2.0
3.2.7 laboratory-fortified sample matrix (LFM)—an aliquot
of an environmental sample to which known quantities of the
test method analytes are added in the laboratory. The LFM is
analyzed exactly as a sample is; its purpose is to determine
whether the sample matrix contributes bias to the analytical
results. The background concentrations of the analytes in the
sample matrix must be determined in a separate aliquot and the
measured values in the LFM corrected for background concentrations.
Primary column—250 by 4.6 mm inside diameter Altex Ultrasphere ODS, 5 µm.
Confirmation column—250 by 4.6 mm inside diameter Supelco LC-1, 5 µm.
Estimated method detection limit in micrograms per litre.
3.2.8 laboratory performance check solution (LPC)—a solution of method analytes, surrogate compounds, and internal
standards used to evaluate the performance of the instrument
system with respect to a defined set of method criteria.
EPA Method 531.2, Revision 1.0, USEPA, EMSLCincinnati, 20016
3. Terminology
3.2.9 laboratory reagent blank (LRB)—an aliquot of reagent water treated exactly the same as a sample, including
being exposed to all glassware, equipment, solvents, reagents,
internal standards, and surrogates that are used with other
samples. The LRB is used to determine whether method
analytes or other interferences are present in the laboratory
environment, the reagents, or the apparatus.
3.1 Definitions—For definitions of water terms used in this
test method, refer to Terminology D1129. For definitions of
other terms used in this test method, refer to Practice E682.
3.2 Definitions of Terms Specific to This Standard:
3.2.1 calibration standard (CAL)—a solution prepared from
the primary dilution standard solution and stock standard
solutions of the internal standards and surrogate analytes. CAL
solutions are used to calibrate the instrument response with
respect to analyte concentration.
3.2.2 field duplicates (FD1 and FD2)—two separate samples
collected at the same time, placed under identical
circumstances, and treated exactly the same throughout field
and laboratory procedures. Analyses of FD1 and FD2 provide
a measure of the precision associated with sample collection,
preservation, and storage, as well as with laboratory procedures.
3.2.3 field reagent blank (FRB)—reagent water placed in a
sample container in the laboratory and treated in all respects as
a sample, including being exposed to sampling site conditions,
storage, preservation, and all analytical procedures. The purpose of the FRB is to determine whether method analytes or
other interferences are present in the field environment.
3.2.4 internal standard—a pure analyte(s) added to a solution in known amount(s) and used to measure the relative
responses of other analytes and surrogates that are components
of the same solution. The internal standard must be an analyte
that is not a sample component.
3.2.5 laboratory duplicates (LD1 and LD2)—two sample
aliquots taken in the analytical laboratory and analyzed separately with identical procedures. Analyses of LD1 and LD2
provide a measure of the precision associated with laboratory
procedures, but not with sample collection, preservation, or
storage procedures.
3.2.10 primary dilution standard solution—a solution of
several analytes prepared in the laboratory from stock standard
solutions and diluted as necessary to prepare calibration
solutions and other necessary analyte solutions.
3.2.11 quality control sample (QCS)—a sample matrix containing test method analytes or a solution of test method
analytes in a water miscible solvent that is used to fortify water
or environmental samples. The QCS is obtained from a source
external to the laboratory and is used to check the laboratory
performance with externally prepared test materials.
3.2.12 stock standard solution—a concentrated solution
containing a single certified standard that is a method analyte,
or a concentrated solution of a single analyte prepared in the
laboratory with an assayed reference compound. Stock standard solutions are used to prepare primary dilution standards.
3.2.13 surrogate analyte—a pure analyte(s), which is extremely unlikely to be found in any sample, and which is added
to a sample aliquot in known amount(s) before extraction. It is
measured with the same procedures used to measure other
sample components. The purpose of a surrogate analyte is to
monitor the method performance with each sample.
4. Summary of Test Method
4.1 The water sample is filtered, and a 200 to 400-µL aliquot
is injected onto a reverse phase HPLC column. Separation of
the analytes is achieved using gradient elution chromatography. After elution from the HPLC column, the analytes are
hydrolyzed with sodium hydroxide (2.0 g/L NaOH) at 95°C.
The methylamine formed during hydrolysis is reacted with
6
Published by the U.S. Environmental Protection Agency, Environmental
Monitoring and Support Laboratory, Cincinnati, OH 45268, 2001.
2
D5315 − 04 (2011)
o-phthalaldehyde (OPA) and 2-mercaptoethanol to form a
highly fluorescent derivative that is detected by a fluorescence
detector (5).
7.1.1 Sample Bottle, 60-mL screw cap glass vials7 and caps8
equipped with a PTFE-faced silicone septa. Prior to use, wash
the vials and septa as described in 6.1.1.
4.2 This method is applicable to any carbamte analyte that
can be hydrolyzed to a primary amine, not necessarily methylamine.
7.2 Filtration Apparatus:
7.2.1 Macrofiltration Device, to filter derivatization solutions and mobile phases used in HPLC. It is recommended that
47-mm, 0.45-µm pore size filters be used.9
7.2.2 Microfiltration Device, to filter samples prior to HPLC
analysis. Use a 13-mm filter holder10 and 13-mm diameter,
0.2-µm polyester filters.11
5. Significance and Use
5.1 N-methylcarbamates and n-methylcarbomoyloximes are
used in agriculture as insecticides and herbicides. They are
sometimes found in both surface and ground waters and can be
toxic to animals and plants at moderate to high concentrations.
The manufacturing precursors and degradation products may
be equally as hazardous to the environment.
7.3 Syringes and Valves:
7.3.1 Hypodermic Syringe, 10 mL, glass, with Luer-Lok12
tip.
7.3.2 Syringe Valve, three-way.13
7.3.3 Syringe Needle, 7 to 10 cm long, 17-gage, blunt tip.
7.3.4 Micro Syringes, various sizes.
6. Interferences
7.4 Miscellaneous:
7.4.1 Solution Storage Bottles, amber glass, 10 to 15-mL
capacity with TFE-fluorocarbon-lined screw cap.
6.1 Test method interferences may be caused by contaminants in solvents, reagents, glassware, and other sample processing apparatuses that lead to discrete artifacts or elevated
baselines in liquid chromatograms. Specific sources of contamination have not been identified. All reagents and apparatus
must be routinely demonstrated to be free of interferences
under the analysis conditions by running laboratory reagent
blanks in accordance with 12.2.
6.1.1 Glassware must be cleaned scrupulously. Clean all
glassware as soon as possible after use by rinsing thoroughly
with the last solvent used in it.
6.1.2 After drying, store glassware in a clean environment
to prevent any accumulation of dust or other contaminants.
Store the glassware inverted or capped with aluminum foil.
6.1.3 The use of high-purity reagents and solvents helps to
minimize interference problems.
7.5 High-Performance Liquid Chromatograph (HPLC):
7.5.1 HPLC System, 14 capable of injecting 200 to 1000-µL
aliquots and performing ternary linear gradients at a constant
flow rate. A data system is recommended for measuring peak
areas. Table 2 lists the retention times observed for test method
analytes using the columns and analytical conditions described
below.
7.5.2 Column 1 (Primary Column), 250 mm long by
4.6-mm inside diameter, stainless steel, packed with 5-µm C-18
material.15 Mobile phase is established at 1.0 mL/min as a
linear gradient from 15:85 methanol: water to 100 % methanol
in 32 min. Data presented in this test method were obtained
using this column.16
7.5.3 Column 2 (Alternative Column), 250 mm long by
4.6-mm inside diameter, stainless steel, packed with 5-µm
silica beads coated with trimethylsilyl.17 Mobile phase is
established at 1.0 mL/min as a linear gradient from 15:85
methanol: water to 100 % methanol in 32 min.
7.5.4 Column 3 (Alternative Column, used for EPA 531.2
validation), 150 mm long by 3.9 mm inside diameter, stainless
6.2 Interfering contamination may occur when a sample
containing low concentrations of analytes is analyzed immediately after a sample containing relatively high concentrations
of analytes. A preventive technique is between-sample rinsing
of the sample syringe and filter holder with two portions of
water. Analyze one or more laboratory method blanks after
analysis of a sample containing high concentrations of analytes.
7
Sample bottle vial, Pierce No. 13075, available from Pierce Chemical Co., 3747
N. Meridian Rd., Rockford, IL 61101, or equivalent.
8
Sample bottle cap, Pierce No. 12722, available from Pierce Chemical Co., 3747
N. Meridian Rd., Rockford, IL 61101, or equivalent.
9
Millipore Type HA, 0.45 µm for water, and Millipore Type FH, 0.5µ m for
organics, available from Millipore Corp., 80 Ashby Rd., Bedford, MA 01730, or
equivalent.
10
Millipore stainless steel XX300/200, available from Millipore Corp., 80 Ashby
Rd., Bedford, MA 01730, or equivalent.
11
Nucleopore 180406, available from Costar Corp., 1 Alewife Center,
Cambridge, MA 02140, or equivalent.
12
Luer-Lok connectors are available from most laboratory suppliers.
13
Hamilton HV3-3, available from Hamilton Co., P.O. Box 10030, Reno, NV
89502, or equilivalent.
14
Consult HPLC manufacturer’s operation manuals for specific instructions
relating to the equipment.
15
Beckman Ultrasphere ODS, available from Beckman Instruments, 2500
Harbor Blvd., Fullerton, CA 92634, has been found suitable.
16
Newer manufactured columns have not been able to resolve aldicarb sulfone
from oxamyl.
17
Supelco LC-1, available from Supelco, Inc., Supelco Park, Bellefonte, PA
16823, has been found suitable.
6.3 Matrix interference may be caused by contaminants
present in the sample. The extent of matrix interference will
vary considerably from source to source, depending upon the
water sampled. Positive analyte identifications must be confirmed using the alternative conformational columns, or LC/
MS.
6.4 The quality of the reagent water used to prepare standards and samples must conform to D1193, especially in TOC
content. High reagent water TOC causes a deterioration of
column selectivity, baseline stability, and analyte sensitivity.
6.5 Eliminate all sources of airborne primary amines, especially ammonia, which are absorbed into the mobile phases and
effect sensitivity.
7. Apparatus
7.1 Sampling Equipment:
3
D5315 − 04 (2011)
TABLE 2 Retention Times for Method Analytes Retention TimeA
Analyte
Primary B
Confirmation C
Confirmation D
Minutes
Aldicarb sulfoxide
Aldicarb sulfone
Oxamyl
Methomyl
3-Hydroxycarbofuran
Aldicarb
Baygon (Propoxur)
Carbofuran
Carbaryl
Methiocarb
BDMC
6.80
7.77
8.20
8.94
13.65
16.35
18.86
19.17
20.29
24.74
25.28
17.5
12.2
14.6
14.8
19
21.4
24.4
23.4
25.4
28.6
...
A
Columns and analytical conditions are described in 7.5.2, 7.5.3.
B
Beckman Ultasphere ODS.
C
Supelco LC-1.
D
Waters Carbamate Analysis Column using ternary gradient conditions.
steel, packed with 5-mm C1818. Mobile phase is a ternary
methanol, acetonitrile, water gradient over 24 minutes. See
Annex A1.
7.5.5 Post Column Reactor, capable of mixing reagents into
the mobile phase. The reactor should be constructed using
PTFE tubing and should be equipped with pumps to deliver 0.1
to 1.0 mL/min of each reagent; mixing tees; and two 1.0-mL
delay coils, with one thermostated at 90°C.19,18
7.5.6 Fluorescence Detector, capable of excitation at 230
nm and detection of emission energies greater than 418 nm20,
or variable wavelength fluorescence detector capable of 340
nm excitation, 465 nm emission with a 18 nm band width, and
16 mL flow cell18.
8.2 Purity of Water—Unless otherwise indicated, references
to water shall be understood to mean reagent water conforming
to Type I of Specification D1193. It must be shown that this
water does not contain contaminants at concentrations sufficient to interfere with the analysis. The reagent water used to
generate the validation data in this test method was distilled
water.22
8.3 Buffer Solutions:
8.3.1 Monochloroacetic Acid (pH 3) (ClCH3CO2H) Buffer
Solution—Prepare by mixing 156 mL of monochloroacetic acid
(ClCH3CO2H) solution (236.2 g/L) and 100 mL of potassium
acetate (KCH3CO2) solution (245.4 g/L).
8.3.2 Buffered Water, to prepare 1 L, mix 10 mL of monochloroacetic acid buffer (pH 3) and 990 mL of water.
8. Reagents and Materials
8.4 Helium, for degassing solutions and solvents.
8.1 Purity of Reagents—Reagent-grade chemicals shall be
used in all tests. Unless otherwise indicated, it is intended that
all reagents shall conform to the specifications of the Committee on Analytical Reagents of the American Chemical Society
where such specifications are available.21 Other grades may be
used, provided it is first ascertained that the reagent is of
sufficiently high purity to permit its use without lessening the
accuracy of the determination. For trace analysis using organic
solvents for liquid-liquid extraction or elution from solid
sorbents, solvents specified as distilled-in-glass, nano-grade, or
pesticide-grade frequently have lower levels of interfering
impurities. In all cases, sufficient reagent blanks must be
processed with the samples to ensure that all of the compounds
of interest are not present as blanks due to reagents or
glassware.
8.5 HPLC Mobile Phase:
8.5.1 Water, HPLC grade23, or equivalent Type I Reagent
Water.
8.5.2 Methanol, HPLC grade. Filter and degas before use.
8.5.3 Acetonitrile, HPLC grade. Filter and degass before
use.
8.6 Internal Standard Solution —Prepare an internal standard solution by weighing approximately 0.0010 g of pure
BDMC (4-Bromo-3,5-Dimethylphenyl N-Methylcarbamate,
98 % purity)24 to two significant figures. Dissolve the BDMC
in methanol and dilute to volume in a 10-mL volumetric flask.
Transfer the internal standard solution to a TFE-fluorocarbonsealed screw-cap bottle and store it at room temperature. The
addition of 5 µL of the internal standard solution to 50 mL of
sample results in a final internal standard concentration of 10
µg/L. Replace the solution when ongoing quality control
indicates a problem.
18
Waters Carbamate Analysis Column, available from Waters Corp., Milford,
MA, 01757.
19
ABI URS 051 and URA 100, available from ABI Analytical, Inc., 170
Williams Drive, Ramsey, NJ 07446, or equivalent.
20
A Schoffel Model 970 fluorescence detector was used to generate the
validation data presented in this test method. Now available from Kratos Division
of ABI Analytical, Inc., 170 Williams Drive, Ramsey, NJ 07446.
21
“Reagent Chemicals, American Chemical Society Specifications,” Am.
Chemical Soc., Washington, DC. For suggestions on the testing of reagents not
listed by the American Chemical Society, see “Analar Standards for Laboratory
Chemicals,” BDH Ltd., Poole, Dorset, U.K., and the “United States Pharmacopeia.”
NOTE 1—BDMC has been shown to be an effective internal standard for
22
Available from the Magnetic Springs Water Co., 1801 Lone Eagle St.,
Columbus, OH 43228.
23
Available from Burdick and Jackson. Distributed by Scientific Products, 1430
Waukegan Road, McGraw Park, IL 60085-6787.
24
Available from Aldrich Chemical Co., Inc., 1001 West Saint Paul Ave.,
Milwaukee, WI 53233.
4
D5315 − 04 (2011)
TABLE 3 Instrument Quality Control Standard
Test
Sensitivity
Chromatographic
performance
A
methanol and dilute to volume in a 10-mL volumetric flask.
Larger volumes may be used at the convenience of the analyst.
If the compound purity is certified at 96 % or greater, the
weight may be used without correction to calculate the
concentration of the stock standard. Commercially prepared
stock standards may be used at any concentration if they are
certified by either the manufacturer or an independent source.
8.11.2 Transfer the stock standard solution into TFEfluorocarbon-sealed screw-cap vials. Store it at room temperature and protect it from light.
8.11.3 Stock standard solutions should be replaced after two
months, or sooner, if comparison with laboratory-fortified
blanks, or quality-control samples indicate a problem.
ConcenAnalyte
tration,
Requirements
µ g/L
3-Hydroxycarbofuran
2
Detection of analyte;
S/N > 3
aldicarb sulfoxide
100
0.90 < PGF A < 1.1
PGF = peak Gaussian factor
PGF 5
1.83 3 W ~ 1/2 !
W ~ 1/10!
where:
W(1⁄2) = peak width at half height, and
W(1⁄10) = peak width at tenth height.
9. Sample Collection and Handling
9.1 Collect the samples in accordance with Specification
D1192, Practices D3370, or Practices D3694.
the method analytes (1), but other compounds may be used if the quality
control requirements in Section 11 are met.
9.2 Additionally, grab samples must be collected in glass
containers. Follow conventional sampling practices (6);
however, the bottle must not be prerinsed with sample before
collection.
8.7 Laboratory Performance Check Solution—Prepare the
concentrate by adding 20 µL of the 3-hydroxycarbofuran stock
standard solution (8.11), 1.0 mL of the aldicarb sulfoxide stock
standard solution (8.11), and 1 mL of the internal standard
fortification solution (8.7) to a 10-mL volumetric flask (Table
3). Dilute to volume with methanol. Mix concentrate thoroughly. Prepare a check solution by placing 100 µL of the
concentrate solution into a 100-mL volumetric flask. Dilute to
volume with buffered water. Transfer to a TFE-fluorocarbonsealed screw-cap bottle and store it at room temperature. The
solution should be replaced when ongoing quality control
indicates a problem.
10. Preservation of Samples
10.1 Sample Preservation/pH Adjustment—Oxamyl,
3-hydroxycarbofuran, aldicarb sulfoxide, and carbaryl can all
degrade rapidly in neutral and basic waters held at room
temperature (7, 8). This short-term degradation is of concern
during the periods of time that samples are being shipped and
that processed samples are held at room temperature in
autosampler trays. Samples targeted for the analysis of these
three analytes must be preserved at a pH of 3, as shown as
follows. The pH adjustment also minimizes analyte biodegradation.
10.1.1 Add 1.8 mL of monochloroacetic acid buffer solution
(pH 3) to the 60-mL sample bottle. Add buffer to the sample
bottle either at the sampling site or in the laboratory before
shipping to the sampling site.
10.1.2 If residual chlorine is present, add 80 mg of sodium
thiosulfate per litre of sample to the sample bottle prior to
collecting the sample.
10.1.3 After the sample is collected in a bottle containing
buffer, seal the sample bottle and shake it vigorously for 1 min.
10.1.4 Samples must be iced or refrigerated at 4°C from the
time of collection until storage; they must be stored at − 10°C
until analyzed. Preservation study results indicate that test
method analytes are stable in water samples for at least 28 days
when adjusted to pH 3 and stored at − 10°C. However, analyte
stability may be affected by the matrix; the analyst should
therefore verify that the preservation technique is applicable to
the samples under study.
8.8 Methanol, distilled-in-glass quality or equivalent.
8.9 Post Column Derivatization Solutions:
8.9.1 Sodium Hydroxide (2 g/L)—Dissolve 2.0 g of sodium
hydroxide (NaOH) in water. Dilute to 1.0 L with water. Filter
and degas just before use.
8.9.2 2-Mercaptoethanol (1 + 1)—Mix 10.0 mL of
2-mercaptoethanol and 10.0 mL of acetonitrile. Cap and store
in hood.
NOTE 2—Caution: Work in a hood due to reagent volatility and odor.
8.9.3 Sodium Borate Solution (19.1 g/L)—Dissolve 19.1 g
of sodium borate (Na2B4O7 × 10H2O) in water. Dilute to 1.0 L
with water. The sodium borate will dissolve completely at
room temperature if prepared one day before use.
8.9.4 OPA Reaction Solution—Dissolve 100 6 10 mg of
o-phthalaldehyde (melting point range from 55 to 58°C) in 10
mL of methanol. Add to 1.0 L of sodium borate solution (19.1
g/L). Mix, filter, and degas with helium. Add 100 µL of
2-mercaptoethanol (1 + 1) and mix. Make up fresh solutions
daily.
11. Calibration
8.10 Sodium thiosulfate (Na2S2O3).
11.1 Establish HPLC operating parameters equivalent to
those indicated in 7.5. Calibrate the HPLC system using either
the internal (11.2) or the external (11.3) standard technique.
8.11 Stock Solutions, Standard (1.00 µg/µL)—Stock standard solutions may either be purchased as certified solutions or
prepared from pure standard materials by using the following
procedure:
8.11.1 Prepare stock standard solutions by weighing approximately 0.0100 g of pure material. Dissolve the material in
11.2 Internal Standard Calibration Procedure—The analyst
must select one or more internal standards similar in analytical
behavior to the analytes of interest. In addition, the analyst
5
D5315 − 04 (2011)
should bracket the analyte concentrations expected in the
sample extracts, or they should define the working range of the
detector.
11.3.2 Beginning with the standard of lowest concentration,
analyze each calibration standard in accordance with 13.2, and
tabulate the response (peak height or area) versus the concentration in the standard. Use the results to prepare a calibration
curve for each compound. Alternatively, if the ratio of response
to concentration (calibration factor) is a constant over the
working range <20 % relative standard deviation, assume
linearity through the origin and use the average ratio or
calibration factor in place of a calibration curve.
11.3.3 Verify the working calibration curve or calibration
factor on each working day by measuring a minimum of two
calibration check standards, one at the beginning and one at the
end of the analysis day. These check standards should be at two
different concentration levels in order to verify the concentration curve. For extended analysis periods (longer than 8 h), it
is strongly recommended that check standards be interspersed
with the samples at regular intervals during the course of the
analyses. If the response for any analyte varies from the
predicted response by more than 620 %, repeat the test using
a fresh calibration standard. If the results still do not agree,
generate a new calibration curve or use a single-point calibration standard in accordance with 11.3.4.
11.3.4 Single-point calibration is a viable alternative to a
calibration curve. Prepare single-point standards from the
secondary dilution standards. Prepare the single-point standards at a concentration deviating from the sample extract
response by no more than 20 %.
11.3.5 Verify the calibration standards periodically,
(recommended, at least quarterly), by analyzing a standard
prepared from reference material obtained from an independent
source. The results from these analyses must be within the
limits used to check calibration routinely.
must demonstrate that the measurement of the internal standard
is not affected by method or matrix interferences. BDMC has
been identified as a suitable internal standard.
11.2.1 Prepare calibration standards at a minimum of three
(recommended, five) concentration levels for each analyte of
interest by adding volumes of one or more of the stock
standards to a volumetric flask. Add a known constant amount
of one or more internal standards to each calibration standard,
and dilute to volume with buffered water. The lowest standard
should represent analyte concentration near, but above, their
respective estimated detection limit (EDL) (Table 1). The
remaining standards should bracket the analyte concentrations
expected in the sample extracts, or they should define the
working range of the detector.
11.2.2 Analyze each calibration standard in accordance with
the procedure in 13.2. Tabulate the peak height or area
responses against the concentration for each compound and
internal standard.
11.2.3 Calculate response factors (RF) for each analyte,
surrogate, and internal standard using Eq 1 as follows:
RF 5
where:
As =
Ais =
Cis =
Cs =
~ A s ! ~ C is!
~ A is! ~ C s !
(1)
response for the analyte to be measured,
response for the internal standard,
concentration of the internal standard, µg/L, and
concentration of the analyte to be measured, µg/L.
11.2.4 If the RF value over the working range is constant
(20 % RSD or less) use the average response factor for
calculations. Alternatively, use the results to plot a calibration
curve of response ratios (As/Ais ) versus Cs.
11.2.5 Verify the working calibration curve or RF on each
working shift by the measurement of one or more calibration
standards. If the response for any analyte varies from the
predicted response by more than 620 %, repeat the test using
a fresh calibration standard. If the repetition also fails, generate
a new calibration curve for that analyte using freshly prepared
standards.
11.2.6 Single-point calibration is a viable alternative to a
calibration curve. Prepare single-point standards from the
secondary dilution standards. Prepare the single-point standards at a concentration deviating from the sample extract
response by no more than 20 %.
11.2.7 Verify calibration standards periodically (recommended at least quarterly) by analyzing a standard prepared
from reference material obtained from an independent source.
The results from these analyses must be within the limits used
to check calibration routinely.
12. Quality Control
12.1 Minimum quality control (QC) requirements are as
follows: an initial demonstration of laboratory capability;
monitoring of the internal standard peak area or height in each
sample and blank when internal standard calibration procedures are being used; and an analysis of laboratory reagent
blanks, laboratory-fortified samples, laboratory-fortified
blanks, and quality control samples.
12.2 Laboratory Reagent Blanks—Before processing any
samples, the analyst must demonstrate that all glassware and
reagent interferences are under control. A laboratory reagent
blank (LRB) must be analyzed each time a set of samples is
extracted or reagents are changed. If, within the retention time
window of any analyte of interest, the LRB produces a peak
that would prevent the determination of that analyte, locate the
source of contamination and eliminate the interference before
processing the samples.
11.3 External Standard Calibration Procedure:
11.3.1 Prepare calibration standards at a minimum of three
(recommended five) concentration levels for each analyte of
interest by adding volumes of one or more stock standards to
a volumetric flask. Dilute to volume with buffered water. The
lowest standard should represent analyte concentrations near,
but above, the respective EDLs. The remaining standards
12.3 Initial Demonstration of Capability:
12.3.1 Select a representative concentration (approximately
10 times EDL) for each analyte. Prepare a sample concentrate
(in methanol) containing each analyte at 1000 times the
selected concentration. With a syringe, add 50 µL of the
6
D5315 − 04 (2011)
TABLE 4 Acceptance Limits for the Analysis of a Laboratory
Quality Control Sample as Percent of Mean Recovery
Analyte
Aldicarb
Aldicarb sulfone
Aldicarb sulfoxide
Baygon (Propoxur)
Carbaryl
Carbofuran
3-Hydroxycarbofuran
Methiocarb
Methomyl
Oxamyl
Mean
Concentration
Recovery B
Level A
10.0
20.0
20.0
10.0
20.0
20.0
20.0
50.0
5.00
20.0
9.46
19.3
19.6
9.52
19.5
19.1
19.2
47.0
4.92
19.4
Overall
Standard
Deviation B
Acceptance
Limits, C %
0.58
1.33
1.35
0.78
1.35
0.68
1.31
3.93
0.37
1.44
81.6–118
79.3–121
79.3–121
75.4–124
79.2–121
89.3–111
79.5–120
74.9–125
77.4–122
77.7–122
12.5.3 If consecutive samples fail the internal standard
response acceptance criterion, analyze a calibration check
standard immediately.
12.5.3.1 If the check standard provides a response factor
within 20 % of the predicted value, follow the procedures
outlined in 12.5.2 for each sample failing the internal standard
response criterion.
12.5.3.2 If the check standard provides a response factor
that deviates by more than 20 % of the predicted value, the
analyst must then recalibrate, as specified in Section 11.
12.6 Assessing Laboratory Performance LaboratoryFortified Blanks:
12.6.1 The laboratory must analyze at least one laboratoryfortified blank (LFB) sample with every 20 samples, or one per
sample set (all samples being analyzed within a 24-h period),
whichever is greater. The fortification concentration of each
analyte in the LFB should be ten times the EDL or the MCL,
whichever is less. Calculate the accuracy as percent recovery
(Xj). If the recovery of any analyte falls outside the control
limits (see 12.7.2), that analyte is judged to be out of control,
and the source of the problem must be identified and resolved
before continuing the analyses.
12.6.2 Until sufficient data become available from withintheir own laboratory, usually after obtaining the results from
a minimum of 20 to 30 analyses, analysts should assess
laboratory performance against the control limits in 12.3.2 that
are derived from the data given in Table 5. When sufficient
internal performance data become available, develop control
limits from the mean percent recovery, X, and standard
deviation, S, of the percent recovery. These data are used to
establish upper and lower control limits as follows:
A
Concentration level ca 10 times the estimated method detection limit.
Calculated from the mean recovery and overall standard deviation regression
equations from the collaborative study.
C
Acceptance limits are defined as the mean recovery ± 3 standard deviations as
percent.
B
concentrate to each of at least four 50-mL aliquots of water,
and analyze each aliquot according to the procedures beginning
in Section 13.
12.3.2 For each analyte, the recovery value for all four of
these samples must fall in the recovery range shown in Table 4.
For those compounds meeting the acceptance criteria, the
performance is judged as acceptable and sample analysis may
begin. For those compounds failing these criteria, this procedure must be repeated, using four fresh samples, until satisfactory performance has been demonstrated.
12.3.3 The initial demonstration of capability is used primarily to preclude a laboratory from analyzing unknown
samples by means of a new, unfamiliar test method prior to
obtaining some experience with it. It is expected that as
laboratory personnel gain experience with this test method, the
quality of data will improve beyond those required here.
upper control limit 5 X13S
lower control limit 5 X 2 3S
After each five to ten new recovery measurements, calculate
new control limits using only the most recent 20 to 30 data
points. These calculated control limits should never exceed
those established in 12.3.2.
12.6.3 It is recommended that the laboratory periodically
determine and document its detection limit capabilities for
analytes of interest.
12.6.4 Analyze a quality control sample from an outside
source at least on a quarterly basis.
12.6.5 Laboratories are encouraged to participate in external
performance evaluation studies such as the laboratory certification programs offered by many states or the studies conducted by the U.S. Environmental Protection Agency (EPA).
Performance evaluation studies serve as independent checks on
the performance of the analyst.
12.4 The analyst is permitted to modify HPLC columns,
HPLC conditions, internal standards, or detectors to improve
separations or lower analytical costs. The analyst must repeat
the procedures described in 12.3 each time such test method
modifications are made.
12.5 Assessing the Internal Standards:
12.5.1 When using the internal standard calibration
procedure, the analyst is expected to monitor the internal
standard response (the peak area or peak height) of all samples
during each analysis day. The internal standard response for
any sample chromatogram should not deviate from the internal
standard response of the daily calibration check standard by
more than 30 %.
12.5.2 If greater than 30 % deviation occurs with an individual sample, optimize instrument performance and inject a
second aliquot.
12.5.2.1 If the reinjected aliquot produces an acceptable
internal standard response, report the results for that aliquot.
12.5.2.2 If a deviation of greater than 30 % is obtained for
the reinjected sample, repeat the analysis of the sample,
beginning with Section 13, provided that the samples are still
available. Otherwise, report the results obtained from the
reinjected sample, but annotate them as suspect.
12.7 Assessing Analyte Recovery/Laboratory Fortified
Sample Matrix:
12.7.1 The laboratory must add a known concentration to a
minimum of 5 % of the routine samples or one sample
concentration per set, whichever is greater. The concentration
should not be less than the background concentration of the
sample selected for fortification. The concentration should
ideally be the same as that used for the laboratory fortified
7
D5315 − 04 (2011)
TABLE 5 Summary Statistics and Regression Equation for EPA Method 531.1 Collaborative Study Data Sets
Analyte
Aldicarb
Aldicarb sulfone
Aldicarb sulfoxide
Baygon (Propoxur)
Carbaryl
Carbofuran
3-Hydroxycarbofuran
Methiocarb
Methomyl
Oxamyl
CA
3.24
4.84
9.70
12.90
19.40
27.40
6.44
9.68
19.30
25.80
38.60
54.80
6.40
8.00
19.20
24.00
40.00
56.00
3.16
4.76
9.50
12.70
19.00
27.00
6.38
9.58
19.20
25.60
38.20
54.20
4.76
7.16
14.30
19.10
28.00
40.60
6.36
9.56
19.10
25.40
38.20
54.20
12.80
19.20
38.40
51.40
77.00
109.0
1.60
2.40
4.80
6.40
9.60
13.60
6.40
9.60
19.20
25.60
38.40
54.40
Reagent Water
XB
SR C
Sr D
3.24
4.56
9.26
12.37
18.12
25.30
6.71
9.11
18.26
25.07
37.10
52.83
6.58
8.53
17.99
23.34
39.31
54.66
3.35
4.47
9.13
12.02
17.62
25.65
6.66
9.48
18.73
24.11
36.39
52.41
5.18
6.90
13.58
18.67
26.99
38.71
6.59
9.01
18.41
24.41
36.60
51.82
12.96
17.94
36.56
48.35
72.44
101.9
1.61
2.40
4.53
6.42
9.41
13.49
6.84
9.25
18.16
24.82
37.09
52.49
0.33
0.69
0.91
0.57
0.12
0.72
0.63
0.37
2.24
1.11
2.04
3.56
0.66
0.51
2.42
0.92
1.53
3.71
0.33
0.74
0.68
0.95
0.99
1.62
0.58
0.83
1.32
1.61
2.26
3.34
0.74
0.29
0.33
0.87
1.22
1.15
0.79
0.99
1.47
1.29
1.96
2.34
3.02
2.35
2.71
4.50
4.92
7.70
0.21
0.22
0.60
0.40
0.17
0.93
0.88
1.25
1.48
1.75
1.16
3.27
0.37
0.15
Finished Drinking Water
Regr. Equations
X = 0.926C + 0.202
SR = 0.022X + 0.370 E
Sr = 0.32 F
0.44
0.58
0.98
X = 0.942C + 0.446
SR = 0.062X + 0.132
Sr = 0.025X + 0.382
1.43
0.39
1.18
G
X = 0.941C + 0.876
SR = 0.058X + 0.211
Sr = 0.040X + 0.103
1.59
0.26
0.41
X = 0.916C + 0.360
SR = 0.058X + 0.230
Sr = 0.040X + 0.092
1.12
0.62
0.63
X = 0.949C + 0.542
SR = 0.058X + 0.219
Sr = 0.016X + 0.480
1.51
0.48
0.41
X = 0.923C + 0.636
SR = 0.006X + 0.564 E
Sr = 0.022X + 0.322
1.46
0.84
0.47
X = 0.940C + 0.438
SR = 0.038X + 0.578
Sr = 0.013X + 0.697 E
2.09
1.93
1.86
X = 0.923C + 0.887
SR = 0.035X + 2.286
Sr = 0.005X + 1.839
2.58
0.17
0.41
X = 0.976C + 0.043
SR = 0.048X + 0.133
Sr = 0.053X + 0.069
0.61
1.02
0.52
X = 0.936C + 0.659
SR = 0.038X + 0.699
Sr = 1.04 F
1.58
XB
SR C
Sr D
3.27
5.09
10.87
13.84
19.08
26.77
6.18
9.24
18.42
24.55
36.75
54.60
5.65
8.18
18.30
22.72
38.68
55.55
3.20
4.92
9.55
13.06
18.93
26.26
6.49
9.82
18.62
24.87
36.67
52.99
4.87
7.03
14.23
19.27
27.47
39.33
6.39
9.51
18.58
25.26
37.30
53.67
13.00
18.12
38.08
49.53
74.25
105.2
1.66
2.67
4.79
6.59
9.31
13.63
6.43
9.65
19.00
25.75
37.94
54.99
0.24
0.40
2.10
1.73
0.43
1.90
0.30
0.53
1.34
1.14
1.70
1.57
0.77
0.60
0.84
0.97
1.32
1.38
0.16
0.35
0.68
0.23
2.80
1.79
0.63
0.28
1.11
1.79
3.42
3.56
0.49
0.31
0.41
0.57
2.19
2.59
0.51
0.91
1.29
4.76
1.65
2.67
0.76
1.91
3.21
3.97
2.70
4.56
0.22
0.34
0.13
1.03
0.45
0.22
0.81
0.80
1.67
1.48
1.35
0.79
0.22
0.51
Regr. Equations
X = 1.032C + 0.031
SR = 0.101X − 0.042 E
Sr = 0.040X + 0.046
1.04
0.35
0.38
X = 0.968C − 0.097
SR = 0.039X + 0.119 E
Sr = 0.008X + 0.276
0.79
0.22
0.40
X = 0.952C + 0.460 G
SR = 0.021X + 0.440
Sr = 0.024X + 0.050
1.46
0.20
0.24
X = 0.994C + 0.101
SR = 0.086X − 0.114
Sr = 0.046X − 0.005
1.48
0.52
0.57
X = 0.958C + 0.439
SR = 0.068X + 0.015
Sr = 0.039X + 0.167
2.66
0.37
0.31
X = 0.970C + 0.220
SR = 0.042X + 0.178
Sr = 0.008X + 0.316
0.80
0.45
1.25
X = 0.979C + 0.153
SR = 0.085X + 0.045 E
Sr = 0.044X + 0.114
1.80
0.61
1.29
X = 0.958C + 0.474
SR = 0.057X + 0.322
Sr = 0.034X + 0.046
3.52
0.24
0.09
X = 0.988C + 0.000
SR = 0.040X + 0.000
Sr = 14 F
0.09
0.24
0.68
X = 0.998C + 0.045
SR = 0.023X + 0.672 E
Sr = 0.025X + 0.048
1.08
A
Spike concentration, µg/L.
Mean recovery, µg/L.
Overall standard deviation, µg/L.
D
Single-analyst standard deviation, µg/L.
E
Coefficient of determination of weighted equation was weak (COD < 0.5).
F
Weighted linear regression equation had negative slope; average precision is reported.
G
Lowest spike recovery (6.40 µg/L) not used for this regression (see text).
B
C
blank (see 12.6). Samples from all routine sample sources
should be fortified over time.
12.7.2 Calculate the percent recovery, P of the concentration for each analyte, after correcting the analytical result, X,
8
D5315 − 04 (2011)
of the samples. For example, field or laboratory duplicates may
be analyzed to assess the precision of the environmental
measurements, or field reagent blanks may be used to assess
the contamination of samples under site conditions,
transportation, and storage.
from the fortified sample for the background concentration, b,
measured in the unfortified sample using Eq 2:
P 5 100 ~ X 2 b ! /fortifying concentration
(2)
Compare these values to the control limits appropriate for
water data collected in the same fashion. If the analyzed
unfortified sample is found to contain NO background
concentrations, and the added concentrations are those specified in 12.7, the appropriate control limits would then be the
acceptance limits given in 12.7. If, on the other hand, the
analyzed unfortified sample is found to contain background
concentration, b, estimate the standard deviation at the background concentration, sb, using regressions or comparable
background data and, similarly, estimate the mean, Xa, and
standard deviation, sa, of analytical results at the total concentration after fortifying. The appropriate percent control limits
would be P 6 3sp, where:
13. Procedure
13.1 pH Adjustment and Filtration :
13.1.1 Add preservative to any samples not previously
preserved (Section 10). Adjust the pH of the sample to pH 3 6
0.2 by adding 1.5 mL of 2.5 M-monochloroacetic acid buffer
solution (8.3.1) to each 50 mL of sample. This step should not
be necessary if the sample pH was adjusted during sample
collection as a preservation precaution. Fill a 50-mL volumetric flask to the mark with the sample. Add 5 µL of the internal
standard solution if the internal standard calibration procedure
is being used and mix by inverting the flask several times.
13.1.2 Affix the three-way valve to a 10-mL syringe. Place
a clean filter in the filter holder, and affix the filter holder and
the 7 to 10-cm syringe needle to the syringe valve. Rinse the
needle and syringe with water. Prewet the filter by passing 5
mL of water through the filter. Draw another 10 mL of sample
into the syringe, expel it through the filter, and collect the last
5 mL for analysis. Rinse the syringe with water. Discard the
filter.
P 5 100 X/ ~ b1fortifying concentration!
sp 5 100 ~ sa 2 1sb 2 ! 1⁄2 /fortifying concentration
NOTE 3—For example, if the background concentration for Analyte A
was found to be 1 µg/L and the added amount was also 1 µg/L, and upon
analysis the laboratory fortified sample measured 1.6 µg/L, then the
calculated P for this sample would be (1.6 µg/L − 1.0 µg/L)/1 µg/L or
60 %. This calculated P is compared to control limits derived from prior
water data. Assume that it is known that analysis of an interference free
sample at 1 µg/L yields an s of 0.12 µg/Ls and similar analysis at 2.0 µg/L
yields X and s of 2.01 µg/L and 0.20 µg/L, respectively. The appropriate
limits by which to judge the reasonableness of the percent recovery, 60 %,
obtained on the fortified matrix sample are computed as follows:
13.2 Liquid Chromatography:
13.2.1 Recommended operating conditions for the liquid
chromatograph are summarized in 7.5. Table 1 lists the
retention times observed using this test method. Other HPLC
columns, chromatographic conditions, or detectors may be
used if the requirements of 12.4 are met.
13.2.2 Calibrate the system daily, as described in Section
11. The standards and sample must be in buffered water having
a pH of 3.
13.2.3 Inject 200 to 400 µL of the sample. Record the
volume injected and the resulting peak size in area units.
13.2.4 If the response for the peak exceeds the working
range of the system, dilute the sample with buffered water (pH
of 3) and reanalyze.
@ 100 ~ 2.01 µg/L ! /2.0 µg/L # 63 ~ 100! @ ~ 0.12 µg/L ! 2
1 ~ 0.20 µg/L ! 2 # 1/2 /1.0 µg/L 5 100.5 %6300 ~ 0.233!
5 100.5 %670 % or 30 % to 170 % recovery of the added analyte
12.7.3 If the recovery of any such analyte falls outside the
designated range and the laboratory performance for the
analyte is shown to be in control (12.6), the recovery problem
encountered with the dosed sample is judged to be matrix
related rather than system related. The result for that analyte in
the unfortified sample is labeled suspect/matrix in order to
inform the data user that the results are suspect due to matrix
effects.
13.3 Identification of Analytes :
13.3.1 Identify a sample component by comparison of its
retention time to that of a reference chromatogram. If the
retention time of an unknown compound corresponds, within
limits, to that of a standard compound, the identification is
considered positive.
13.3.2 Base the width of the retention time window used to
make identifications on measurements of actual retention time
variations of standards over the course of one day. Use three
times the standard deviation of a retention time to calculate a
suggested window size for a compound.
13.3.3 Identification requires expert judgment when sample
components are not resolved chromatographically. When peaks
obviously represent more than one sample component (that is,
a broadened peak with shoulder(s) or a valley between two or
more maxima), or whenever doubt exists over identification of
a peak on a chromatogram, use appropriate alternative techniques to help confirm peak identification. For example, a more
positive identification may be made by using an alternative
12.8 Assessing Instrument System/Laboratory Performance
Check Sample—Monitor instrument performance daily by
analysis of the LPC sample. The LPC sample contains compounds designed to indicate appropriate instrument sensitivity,
column performance (primary column), and chromatographic
performance. LPC sample components and performance criteria are given in Table 3. An inability to demonstrate acceptable
instrument performance indicates the need for reevaluation of
the instrument system. The sensitivity requirements are set
based on the EDLs published in this test method. If laboratory
EDLs (Table 1) differ from those listed in this test method,
concentrations of the instrument quality-control standard compounds must be adjusted to be compatible with the laboratory
EDLs.
12.9 Optional Additional Quality Control Practices—The
laboratory may adopt additional quality-control practices for
use with this test method. The most productive specific
practices depend on the needs of the laboratory and the nature
9
D5315 − 04 (2011)
standard, the sample should be reanalyzed. If the deviation is
still greater than 30 % and the original sample is unavailable,
report the data but annotate it as suspect.
detector that operates on a chemical/physical principle different
from that originally used, for example, mass spectrometry or
the use of a second chromatography column. A suggested
alternative column is described in 7.5.3 and 7.5.5.
16. Precision and Bias25
14. Calculation
14.1 Determine the concentration of individual compounds
in the sample using the following equation:
Cz 5
Ax 3 Qs
A s 3 RF
16.1 The collaborative study for performance evaluation of
this test method was conducted in accordance with Practice
D2777 – 86.
16.2 Eight laboratories participated in the study. The study
design was based on Youden’s nonreplicate plan for collaborative tests of analytical methods. Reagent and finished drinking
water were spiked with the 12 analytes, each at six concentration levels, prepared as three Youden pairs. Analyses of the
spiked reagent water evaluated the proficiency of this test
method on a sample free from interferences. Analyses of the
spiked finished drinking water allowed an analysis of variance
test. Only Aldicarb sulfoxide was affected by sample matrix.
The comparison of results between reagent water and finished
tap water are shown in Table 6.
(3)
where:
Cx = analyte concentration, µg/L,
Ax = response of the sample analyte,
As = response of the standard (either internal or external), in
units consistent with those used for the analyte
response,
RF = response factor (with an external standard, RF = 1,
because the standard is the same compound as the
measured analyte), and
Qs = concentration of the internal standard present, or concentration of the external standard that produced As,
µg/L.
16.3 The overall standard deviation (SR) shows precision
associated with measurements generated by the eight laboratories (Table 5). Single analyst standard deviation (Sr) is the
precision associated with performance in an individual laboratory (Table 5). Both precision estimates were made using a
concentration that was about 10 times the EDL. The pooled,
overall precisions in reagent water for the 10 analytes at
approximately 10 times the EDL, expressed as RSDR, was
6.9 %. The precision ranged from 3.6 % for carbofuran to
8.4 % for methiocarb. The pooled, overall precision in drinking
water for the 10 analytes at approximately 10 times the EDL,
expressed as RSDR was 6.3 %. The precision ranged from
4.0 % for methomyl to 9.7 % for aldicarb. There is no
significant difference between the reagent water matrix and the
various finished drinking water matrices.
15. Report
15.1 Report compounds that clearly meet the criteria given
in 13.3 to two significant figures.
15.2 When peaks obviously represent more than one sample
component (that is, a broadened peak with shoulders or a
valley between two or more maxima) or whenever doubt exists
over identification of a peak on a chromatogram, appropriate
alternative techniques need to be used to help confirm peak
identification. For example, a more positive identification may
be made by the use of an alternative detector that operates on
a chemical/physical principle different from that originally
used, for example, mass spectrometry or the use of a second
chromatography column.
15.3 If the recovery of any analyte in the laboratory-fortified
sample matrix falls outside the designated range and the
laboratory performance of the analyte is shown to be in control
(12.6), the recovery problem encountered with the dosed
sample is judged to be matrix related. The result for that
analyte in the unfortified sample is labeled suspect/matrix in
order to inform the data user that the results are suspect due to
matrix effects.
15.4 If the internal standard response for any sample deviates any more than 30 % of the daily calibration check
16.4 This method has evolved significantly since first approved. Method validation data for this updated method
originated during EPA Method 531.2 validation, and is shown
in Annex A1.
17. Keywords
17.1 carbamates; direct aqueous injection; drinking water;
HPLC; N-methylcarbamates; N-methylcarbamoyloximes.
25
Supporting data have been filed at ASTM International Headquarters and may
be obtained by requesting Research Report RR:D19-1150.
10
D5315 − 04 (2011)
TABLE 6 Precision Statistics Calculated from Regression Equations by Compound and By Water Type A
Analyte
Aldicarb
Aldicarb sulfone
Aldicarb sulfoxide
Baygon (Propoxur)
Carbaryl
Carbofuran
3-Hydroxycarbofuran
Methiocarb
Methomyl
Oxamyl
Average
Standard deviation
Concentration, µg/L B
10.0
20.0
20.0
10.0
20.0
20.0
20.0
50.0
5.0
20.0
Reagent Water
Finished Drinking Water
Reagent Water
Finished Drinking Water
Sr
SR
Sr
SR
RSDr ,%
RSDR, %
RSDr ,%
RSDR, %
0.32
0.86
0.89
0.47
0.79
0.74
0.95
2.07
0.33
1.04
0.58
1.33
1.35
0.78
1.35
0.68
1.31
3.93
0.37
1.44
0.46
0.43
0.52
0.46
0.93
0.47
0.98
1.69
0.14
0.55
1.00
0.87
0.85
0.75
1.35
1.00
1.72
3.08
0.20
1.13
3.4
4.5
4.5
5.0
4.1
3.9
4.9
4.4
6.7
5.4
4.7
0.91
6.1
6.9
6.9
8.2
6.9
3.6
6.8
8.4
7.5
7.4
6.9
1.34
4.4
2.2
2.7
4.6
4.8
2.4
5.0
3.5
2.8
2.7
3.5
1.07
9.7
4.7
4.4
7.5
6.9
5.1
8.7
6.4
4.0
5.7
6.3
1.92
A
Sr and SR = standard deviations for repeatability and reproducibility, respectively. RSDr and RSDR = corresponding relative standard deviations.
Concentration value is 10 to 15 times estimated MDL.
B
ANNEX
(Mandatory Information)
A1. SUMMARY OF CHANGES IN EPA METHOD 531.2
A1.1 EPA Method 531.1, the basis for Test Method D5315,
was updated in 2001 to EPA Method 531.2. This update reflects
the changes. See Fig. A1.1.
A1.3 Aldicarb and its 2 degradation products, aldicarb
sulfone and aldicarb sulfoxide, may be regulated in the future.
This HPLC gradient modification addresses this separation of
the analytes given in A1.2. See Fig. A1.2.
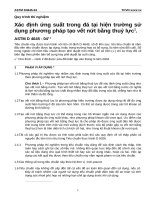
A1.2 The use of the binary water / methanol gradient has
been changed to incorporate the use of the non-fluorescent
quenching acetonitrile after the resolution of the 4 early eluting
analytes, Aldicard Sulfone, Aldicarb Sulfoxide, Oxamyl, and
Methomyl.
A1.4 Since initial method approval in 1986, HPLC Fluorescence Detectors has evolved significant capability not available
when this initial method was validated. N-Methyl Carbamte
detection has been lowed to sub-ppb concentrations.
11
D5315 − 04 (2011)
FIG. A1.1 Carbamate chromatogram using the Waters carbamate column and ternary gradient.
FIG. A1.2 Carbamate chromatogram using the Waters carbamate analysis column and ternary gradient.
12
D5315 − 04 (2011)
TABLE A1.1 Instrument Method Conditions
Time
% Water
% Methanol
% Acetronile
(min)
initial
88.0
12.0
0.0
5.30
88.0
12.0
0.0
5.40
68.0
16.0
16.0
14.00
68.0
16.0
16.0
16.10
50.0
25.0
25.0
20.00
50.0
25.0
25.0
22.00
88.0
12.0
0.0
30.00
88.0
12.0
0.0
Column: Waters carbamate 3.9 × 150 mm packed with 4.0 µm C18
stationary phase.
Postcolumn
Reaction coil set at 80°C, flow rate for Postcolumn Reagent #1
Reactor: and #2 = 0.5 mL/min (each) for Waters unit, 0.3 mL/min for the
Pickering unit.
Fluorescence
340 nm excitation, 465 nm emission with an 18 nm band width;
Detector:Gain = 100; Attn. = 16; Response = Standard; 16µL flow cell.
HPLC:
A ternary gradient comprised of water, methanol, and acetonitrile
with a flow of 1.5 mL/min as shown in the table.
TABLE A1.2 Retention Time DataA
Analyte
Retention Time (min)
Aldicarb sulfoxide
Aldicarb sulfone
Oxamyl
Methomyl
3-Hydroxycarbofuran
Aldicarb
Propoxur
Carbofuran
Carbaryl
1-Naphthol
Methiocarb
BDMC (SUR)
4.36
5.07
5.74
6.53
9.82
11.5
14.3
14.8
17.0
18.6
21.8
22.3
Standard
Deviation
0.0092
0.0089
0.0095
0.0077
0.013
0.013
0.020
0.024
0.026
0.019
0.015
0.015
% RSD
0.21
0.17
.017
0.12
0.13
0.11
0.14
0.16
0.16
0.10
0.07
0.07
A
Retention time data is calculated from precision and accuracy data results
presented in Table A1.6 and the calibration curve used to quantitate the data.
Retention times may differ depending on the chromatographic conditions and
columns used.
TABLE A1.3 Detection Limits in Reagent Water Using the Waters
Postcolumn Carbamate System and the Waters Model 474
Detector
Analyte
Fortification Level
(µg/L)
Aldicarb sulfoxide
Aldicarb sulfone
Oxamyl
Methomyl
3-Hydroxycarbofuran
Aldicarb
Propoxur
Carbofuran
Carbaryl
1-Naphthol
Methiocarb
0.20
0.10
0.20
0.20
0.20
0.20
0.20
0.20
0.20
0.20
0.20
A
Detection
LimitA
(µg/L)
0.059
0.051
0.065
0.050
0.029
0.026
0.037
0.043
0.045
0.063
0.061
Signal to
Noise
Ratio
8:1
3:1
10 : 1
10 : 1
18 : 1
9:1
6:1
9:1
13 : 1
10 : 1
11 : 1
Detection limits were determined by analyzing seven replicates over three days
using the conditions outlined in Table A1.1 with a 1000-µL injection.
13
D5315 − 04 (2011)
TABLE A1.4 Detection Limits in Reagent Water Using the
Pickering Model PCX5200 Postcolumn System and the Waters
Model 474 Detector
Analyte
Fortification Level
(µg/L)
Aldicarb sulfoxide
Aldicarb sulfone
Oxamyl
Methomyl
3-Hydroxycarbofuran
Aldicarb
Propoxur
Carbofuran
Carbaryl
1-Naphthol
Methiocarb
0.20
0.20
0.20
0.20
0.20
0.20
0.20
0.20
0.20
0.20
0.20
Detection
LimitA
(µg/L)
0.056
0.026
0.045
0.045
0.041
0.042
0.040
0.058
0.065
0.034
0.036
Signal to
Noise
Ratio
13 : 1
15 : 1
9:1
11 : 1
11 : 1
7:1
11 : 1
7:1
22 : 1
9:1
5:1
A
Detection limits were determined by analyzing seven replicates over three days
using the conditions outlined in Table A1.1 with a 250-µL injection.
TABLE A1.5 Detection Limits in Reagent Water Using the Waters
Postcolumn Carbamate Analysis System and the Waters Model
2475 Detector
Analyte
Fortification Level
(µg/L)
Aldicarb sulfoxide
Aldicarb sulfone
Oxamyl
Methomyl
3-Hydroxycarbofuran
Aldicarb
Propoxur
Carbofuran
Carbaryl
1-Naphthol
Methiocarb
0.20
0.20
0.20
0.20
0.20
0.20
0.20
0.20
0.20
0.20
0.20
Detection
A
Limit ,B
(µg/L)
0.038
0.033
0.044
0.054
0.038
0.049
0.061
0.050
0.043
0.115
0.055
Signal to
Noise
Ratio
14 : 1
9:1
4:1
24 : 1
7:1
12 : 1
10 : 1
12 : 1
9:1
3:1
5:1
A
Detection limits were determined by analyzing seven replicates over three days
using the conditions outlined in Table A1.1 with a 250-µL injection.
B
These data were collected at American Water Works Service Company.
TABLE A1.6 Precision and Accuracy of Low and High Level
Fortified Reagent WaterA
Analyte
Aldicarb
sulfoxide
Aldicarb
sulfone
Oxamyl
Methomyl
3-Hydroxycarbofuran
Aldicarb
Propoxur
Carbofuran
Carbaryl
1-Naphthol
Methiocarb
BDMC
(SUR)B
A
B
Concentration = 0.20 µg/L
(n = 7)
Mean %
Relative
Recovery
Standard
Deviation (%)
112
6.2
Concentration = 10 µg/L
(n = 7)
Mean %
Relative
Recovery
Standard
Deviation (%)
106
1.8
92
9.5
106
2.6
101
101
105
95
109
112
112
113
105
108
8.6
6.5
6.8
7.4
5.9
6.7
7.0
12.6
5.9
4.3
106
106
108
106
109
110
107
108
107
101
2.2
2.9
1.2
1.3
2.0
2.2
2.1
3.1
1.5
2.3
Data obtained using conditions in Table A1.1 using a 1000-µl injection.
Surrogate concentration in all samples was 2.0 mg/L.
14
D5315 − 04 (2011)
TABLE A1.7 Precision and Accuracy of Low and High Level
Chlorinated Surface WaterA
Analyte
Aldicarb
sulfoxide
Aldicarb
sulfone
Oxamyl
Methomyl
3-Hydroxycarbofuran
Aldicarb
Propoxur
Carbofuran
Carbaryl
1-Naphthol
Methiocarb
BDMC
(SUR)B
A
B
Concentration = 0.20 µg/L
(n = 7)
Mean %
Relative
Recovery
Standard
Deviation (%)
113
7.0
Concentration = 10 µg/L
(n = 7)
Mean %
Relative
Recovery
Standard
Deviation (%)
104
2.8
104
5.5
106
1.4
107
110
128
123
128
140
112
113
104
108
6.4
9.8
3.9
2.7
6.0
5.6
9.7
12.1
13.3
2.1
104
104
107
105
106
105
106
101
107
96
2.2
1.6
1.1
1.5
2.1
2.5
0.9
1.3
1.1
3.9
Data obtained using conditions in Table A1.1 using a 1000-µl injection.
Surrogate concentration in all samples was 2.0 mg/L.
TABLE A1.8 Precision and Accuracy of Low and High Level
Fortified Chlorinated Ground WaterA
Analyte
Aldicarb
sulfoxide
Aldicarb
sulfone
Oxamyl
Methomyl
3-Hydroxycarbofuran
Aldicarb
Propoxur
Carbofuran
Carbaryl
1-Naphthol
Methiocarb
BDMC
(SUR)B
A
B
Concentration = 0.20 µg/L
(n = 7)
Mean %
Relative
Recovery
Standard
Deviation (%)
111
7.3
Concentration = 10 µg/L
(n = 7)
Mean %
Relative
Recovery
Standard
Deviation (%)
106
1.1
98
9.2
106
1.4
99
99
107
100
112
112
119
109
105
109
8.4
10.2
3.0
6.3
6.1
4.1
5.1
8.2
3.9
2.0
105
105
108
105
107
107
108
109
107
97
2.2
1.6
1.1
1.5
2.1
2.5
0.9
1.3
1.1
3.9
Data obtained using conditions in Table A1.1 using a 1000-µl injection.
Surrogate concentration in all samples was 2.0 mg/L.
15
D5315 − 04 (2011)
TABLE A1.9 Sample Holding Time Data for Chlorinated Ground
Water Samples Fortified with Method Analytes at 2.0 ug/L
Analyte
Aldicarb
sulfoxide
Aldicarb
sulfone
Oxamyl
Methomyl
3-Hydroxycarbofuran
Aldicarb
Propoxur
Carbofuran
Carbaryl
1-Naphthol
Methiocarb
BDMC
(SUR)
Day 0
94
% Recovery for Samples Fortified at 2.0 µg/L.
Day 2
Day 8
Day 15
Day 28
97
93
93
96
93
99
97
98
98
97
96
96
95
95
96
96
96
95
99
97
95
99
100
98
99
97
97
98
105
101
99
96
96
97
97
98
99
96
100
103
98
95
92
98
97
94
95
94
99
101
97
98
93
99
100
100
98
97
99
REFERENCES
(1) Engle, T., “Measurement of n-Methylcarbamoyloximes and
n-Methylcarbamates in Groundwater by HPLC with Post Column
Derivatization,” National Pesticide Survey Method No. 5, Battelle
Columbus Laboratories, Columbus, OH 1987.
(2) Edgell, Kenneth W., Biedermann, L. Anne, and Longbottom, James
E.,
“Measurement
of
n-Methylcarbamoyloximes
and
n-Methylcarbamates in Water by Direct Aqueous Injection HPLC
with Post Column Derivatization,” Collaborative Study, the Bionetics
Corp., 16 Triangle Park Drive, Cincinnati, OH 45246.
(3) “Carcinogens—Working with Carcinogens,” Publication No. 77-206,
Department of Health, Education, and Welfare, Public Health Service,
Center for Disease Control, National Institute for Occupational Safety
and Health, August 1977 .
(4) “OSHA Safety and Health Standards, General Industry,” 29 CFR
1910, Occupational Safety and Health Administration, OSHA 2206,
January 1976.
(5) “Safety in Academic Chemistry Laboratories,” American Chemical
Society Publication, Committee on Chemical Safety, 3rd Ed, 1979.
(6) Moye, H. A., Sherrer, S. J., and St. John, P. A., “Dynamic Labeling of
Pesticides for High Performance Liquid Chromatography: Detection
of n-Methylcarbamates and o-Phthalaldehyde,” Anal. Lett, Vol 10,
1977, p. 1049.
(7) Hill, K. M., Hollowell, R. H., and DalCortevo, L. A., “Determination
of n-Methylcarbamate Pesticides in Well Water by Liquid Chromatography and Post Column Fluorescence Derivatization,” Analytical
Chemistry, Vol 56, 1984, p. 2465.
(8) Foerst, D. L., and Moye, H. A., “Aldicarb in Drinking Water via
Direct Aqueous Injection HPLC with Post Column Derivatization,”
Proceedings of the 12th Annual AWWA Water Quality Technology
Conference, 1984.
(9) Bassett, M. V., Wendelken, S. C., Pepich, B. V. “Method 531.2
Measurement
of
N-Methylcarbamoyloximes
and
N-Methylcarbamates in Water by Direct Aqueous Injection HPLC
with Post Column Derivatization,” Rev 1.0, Sept 2001, EPA #815-B01-002.
ASTM International takes no position respecting the validity of any patent rights asserted in connection with any item mentioned
in this standard. Users of this standard are expressly advised that determination of the validity of any such patent rights, and the risk
of infringement of such rights, are entirely their own responsibility.
This standard is subject to revision at any time by the responsible technical committee and must be reviewed every five years and
if not revised, either reapproved or withdrawn. Your comments are invited either for revision of this standard or for additional standards
and should be addressed to ASTM International Headquarters. Your comments will receive careful consideration at a meeting of the
responsible technical committee, which you may attend. If you feel that your comments have not received a fair hearing you should
make your views known to the ASTM Committee on Standards, at the address shown below.
This standard is copyrighted by ASTM International, 100 Barr Harbor Drive, PO Box C700, West Conshohocken, PA 19428-2959,
United States. Individual reprints (single or multiple copies) of this standard may be obtained by contacting ASTM at the above
address or at 610-832-9585 (phone), 610-832-9555 (fax), or (e-mail); or through the ASTM website
(www.astm.org). Permission rights to photocopy the standard may also be secured from the Copyright Clearance Center, 222
Rosewood Drive, Danvers, MA 01923, Tel: (978) 646-2600; />
16