Tensile properties of cooked meat sausages and their correlation with texture profile analysis (TPA) parameters and physico chemical characteristics
Bạn đang xem bản rút gọn của tài liệu. Xem và tải ngay bản đầy đủ của tài liệu tại đây (218.6 KB, 7 trang )
Tensile properties of cooked meat sausages and their correlation with texture
profile analysis (TPA) parameters and physico-chemical characteristics
A.M. Herrero
a
,L.delaHoz
a
, J.A. Ordóñez
b
, B. Herranz
a
, M.D. Romero de Ávila
a
, M.I. Cambero
b,
*
a
Departamento Nutrición, Bromatología y Tecnología de los Alimentos, Facultad de Veterinaria, Universidad Complutense, 28040 Madrid, Spain
b
Instituto de Ciencia y Tecnología de la Carne, Facultad de Veterinaria, Universidad Complutense, 28040 Madrid, Spain
article info
Article history:
Received 11 July 2007
Received in revised form 22 February 2008
Accepted 10 March 2008
Keywords:
Tensile test
Texture profile analysis
Breaking strength
Energy to fracture
Folding test
Cooked meat sausages
abstract
The possibilities of using breaking strength (BS) and energy to fracture (EF) for monitoring textural prop-
erties of some cooked meat sausages (chopped, mortadella and galantines) were studied. Texture profile
analysis (TPA), folding test and physico-chemical measurements were also performed. Principal compo-
nent analysis enabled these meat products to be grouped into three textural profiles which showed sig-
nificant (p < 0.05) differences mainly for BS, hardness, adhesiveness and cohesiveness. Multivariate
analysis indicated that BS, EF and TPA parameters were correlated (p < 0.05) for every individual meat
product (chopped, mortadella and galantines) and all products together. On the basis of these results,
TPA parameters could be used for constructing regression models to predict BS. The resulting regression
model for all cooked meat products was BS = À0.160 + 6.600 * cohesiveness À 1.255
*
adhesive-
ness + 0.048 * hardness À 506.31 * springiness (R
2
= 0.745, p < 0.00005). Simple linear regression analysis
showed significant coefficients of determination between BS (R
2
= 0.586, p < 0.0001) versus folding test
grade (FG) and EF versus FG (R
2
= 0.564, p < 0.0001).
Ó 2008 Elsevier Ltd. All rights reserved.
1. Introduction
In recent years, consumers have demanded meat products that
are safe, nutritious, convenient, rich in variety, attractive (in
appearance, texture, odour and taste) and innovative. This stimu-
lates interest in manufacturing cooked meat sausages by using
new technologies and formulations, using different types of meat
(pork, beef, poultry) and reducing levels of phosphate, salt and
fat, all of which lead to beneficial effects on health (Desmond,
2006; Kemi, Karkkainen, & Lamberg-Allardt, 2006). These modifi-
cations in the manufacture of cooked meat sausages may affect
the quality of the products (Farouk, Hall, Harrison, & Swan, 1999;
Jiménez-Colmenero, 2000; Ruusunen & Puolanne, 2005), particu-
larly texture (Jiménez-Colmenero, 2000).
Many instrumental methods have been developed to determine
food textural properties (Bourne, 2002; Kilcast, 2004). Nowadays,
the most commonly used instrumental method is, probably, the
compression method of texture profile analysis (TPA), which mim-
ics the conditions to which the material is subjected throughout
the mastication process (Bourne, 1978; Scott-Blair, 1958).
The compression parameters obtained with TPA have been
employed on cooked meat sausages by many authors as indices
to determine the quality of the finished product or to determine
the textural property modifications due to news formulations
(García, Cáceres, & Selgas, 2006; Kerr, Wang, & Choi, 2005;
Mor-Mur & Yuste, 2003; Yılmaz, Simsek, & Isıklı, 2002). However,
the use of others texture instrumental methods could provide
complementary valuable information about cooked meat sau-
sages. For this, a textural instrumental method, the so-called ten-
sile test, based on resistance of the sample to force deformation,
has been developed (Bourne, 2002). Several tensile parameters
can be obtained such as the maximum rupture force (maximum
peak height resisted by the material), breaking strength (maxi-
mum rupture force by the cross-sectional area of the product)
and energy to fracture (area under the deformation curve)
(Bourne, 2002; Honikel, 1998).
The tensile test has been used to study the mechanical proper-
ties of whole meat, single muscle fibres and perimysial connec-
tive tissue (Christensen, Purslow, & Larsen, 2000; Christensen,
Young, Lawson, Larsen, & Purslow, 2003; Lepetit & Culioli, 1994;
Lewis & Purslow, 1989; Mutungi, Purslow, & Warkup, 1995; Wil-
lems & Purslow 1996). Recently, the tensile test has been success-
fully used on meat products to obtain more textural property
information on fermented sausages (Herrero et al., 2007) and
meat spaghetti (Farouk, Zhang, & Waller, 2005). Tensile proper-
ties, such as breaking strength and energy to fracture, are impor-
tant parameters of quality in meat sausages due to the increasing
tendency of marketing previously sliced products. These slices
can break easily during handling, processing and packing. If the
0309-1740/$ - see front matter Ó 2008 Elsevier Ltd. All rights reserved.
doi:10.1016/j.meatsci.2008.03.008
* Corresponding author. Address: Departamento Nutrición, Bromatología y
Tecnología de los Alimentos, Facultad de Veterinaria, Universidad Complutense,
28040 Madrid, Spain. Tel.: +34 913943745; fax: +34 913943743.
E-mail address: (M.I. Cambero).
Meat Science 80 (2008) 690–696
Contents lists available at ScienceDirect
Meat Science
journal homepage: www.elsevier.com/locate/meatsci
breaking strength or the energy to fracture were less than the
superficial adhesion force between the product and the surface
of the processing equipment an important problem could arise
because many of products could break leading to problems that
can result in the processing line being stopped. Another undesir-
able example is when the force of adhesion of the product to
packaging material or to another slice of the product is higher
than the breaking strength or the energy to fracture because this
results in distortion, disfigurement and breakage of the product,
producing adverse reactions in consumers. These problems could
occur in different meat products such as cooked meat sausages
when they are sliced and vacuum packaged. However, no reports
have been found about tensile measurements in these cooked
meat products.
Therefore, the primary aim of this work was to apply tensile
tests to cooked meat sausages to determine their tensile parame-
ters (breaking strength and energy to fracture) and relating these
results to those of TPA parameters, folding test score and phys-
ico-chemical characteristics, in order to provide a complete charac-
terization of these products. Once the relationship between tensile
and TPA parameters is established, multiple linear regression can
be used to predict the tensile parameters using the TPA results as
predictor variables. Thus, with a simple test (TPA) it should be pos-
sible to obtain data of tensile and compression textural parameters
for cooked meat sausages.
2. Materials and methods
2.1. Description of the samples
Twenty-four samples (0.5 kg for each sample, vacuum pack-
aged) of three different types of cooked meat sausages (chopped,
mortadella and galantines) from different commercial brands
were purchased in retail shops in Spain. The 24 samples were
bought three times (January, May and October) maintaining
brands and meat sausage type. At every time of purchase, eight
samples were of chopped (CH), nine of mortadella (MT), and se-
ven of galantines (GL). Chopped is a heat-cured meat sausage
manufactured with a mixture of ham chunks and trimmings
and seasonings, ground together and then packaged into loaves.
Mortadella is a finely hashed/ground heat-cured meat sausage
which incorporates spices (including black pepper, myrtle berries,
nutmeg and coriander) and sometimes small cubes of pork fat
(principally the hard fat from the neck of the pig). A galantine
is a French dish of boned stuffed meat, most commonly poultry
or fish, that is poached and served cold, coated with aspic. Table
1 shows the meat origin, diameter and slice appearance of the
different cooked meat sausages studied. The samples were kept
at 5 °C until analysis. All the sausages were subjected to each type
of physical, chemical and textural analysis.
2.2. Physico-chemical analysis
After removing the plastic case, chemical analyses were made
in duplicate on all cooked sausages. About 200 g of sample were
finely cut and some aliquots were used for the different analy-
ses. The pH was determined in a distilled water homogenate
(1:10) (w/v) of the sample (10 g) using a Crison Digit-501 pH
meter (Crison Instruments LTD, Barcelona, Spain). Dry matter
(DM) was determined by drying the sample at 110 °C to constant
weight and the results are expressed as a percentage. Water
activity (a
w
) was measured using a Decagon CX1 hygrometer
(Decagon Devices Inc., Pullman, WA, USA) at 25 °C. The total
fat content of the samples was determined by cold extraction
in chloroform and methanol in the presence of antioxidant
BHT as described by Hanson and Olley (1963) and was quanti-
fied gravimetrically. Results are expressed as percentage of dry
matter (DM).
Table 1
Characteristics of the cooked meat sausages analysed
Sample
a
Product Meat origin Diameter (cm) Slice appearance
CH1 Chopped Pork 5.5 ± 0.2 $60% fine emulsion with coarse meat (0.5–2 cm
2
)
CH2 Chopped Turkey 10.0 ± 0.4
CH3 Chopped Beef 5.0 ± 0.3
CH4 Chopped Iberian pork 5.0 ± 0.2 $70% fine emulsion with flat strip meat (0.5 Â 1.5 cm) and coarse fat
CH5 Chopped Pork 6.0 ± 0.2 $55% fine emulsion with coarse meat (1–1.5 cm
2
)
CH6 Chopped Pork 10.5 ± 0.5 $80% fine emulsion with coarse meat (0.5–2 cm
2
)
CH7 Chopped Iberian pork 10.0 ± 0.5 $60% fine emulsion with irregular coarse meat (0.3–2 cm
2
)
CH8 Chopped Pork 10.0 ± 0.4 $40–50% fine emulsion with cubes of meat and fat ($1cm
2
)
MT1 Mortadella Pork 10.0 ± 0.3 $80% fine emulsion with green-olives
MT2 Mortadella Iberian pork 6.0 ± 0.2 $70% fine emulsion with cubes of fat ($1cm
2
)
MT3 Mortadella Pork and beef (traditional
type)
5.3 ± 0.2
MT4 Mortadella Pork and beef (traditional
type)
5.5 ± 0.3
MT5 Mortadella Iberian pig 5.7 ± 0.2 $60–65% fine emulsion with coarse meat (0.1–0.3 cm
2
)
MT6 Mortadella Turkey 5.8 ± 0.2 $65–70% fine emulsion with coarse meat ($0.1–0.3 cm
2
)
MT7 Mortadella Pork 16.0 ± 0.5 $65–70% fine emulsion with cubes of fat ($0.25 cm
2
)
MT8 Mortadella Turkey 11.5 ± 0.4 $65% fine emulsion and coarse meat (0.01–0.1 cm
2
). Foamy aspect and many small
cavities
MT9 Mortadella Turkey 12.5 ± 0.3 $60% fine emulsion with coarse meat ($0.05–0.5 cm
2
)
GL1 Galantine Pork and fish 11.5 ± 0.4 $80% fine emulsion with kamaboko (cube pieces $2.25 cm
2
)
GL2 Galantine Chicken 17.5 ± 0.4 $10–15% fine emulsion with coarse meat (1–2 cm
2
) and pistachio nut
GL3 Galantine Chicken 11.0 ± 0.4 $10% fine emulsion with irregular meat portions ($1–12 cm
2
)
GL4 Galantine Duck 12.0 ± 0.5 $60–70% fine emulsion with irregular coarse meat ($4–12 cm
2
)
GL5 Galantine Chicken 15.0 ± 0.5 $65% fine emulsion with irregular coarse meat ($0.5–8 cm
2
) with fine/coarse fat and
herbs
GL6 Galantine Pork and fish 11.0 ± 0.4 $30% fine emulsion with irregular kamaboko portions ($1–16 cm
2
) and fine/coarse red
pepper
GL7 Galantine Chicken 12.0 ± 0.3 $60% fine emulsion with irregular coarse meat ($0.5–4 cm
2
)
a
CH = chopped, MT = mortadella, GL = galantine.
A.M. Herrero et al. /Meat Science 80 (2008) 690–696
691
2.3. Textural analysis
Texture profile analysis (TPA), tensile test and folding tests were
carried out at about 22 °C. All textural procedures involved dis-
carding the external plastic case of the cooked sausages.
TPA and tensile test were performed using a TA.XT2i SMS Stable
Micro Systems Texture Analyser (Stable Microsystems Ltd., Surrey,
England) with the Texture Expert programmes.
2.3.1. Texture profile analysis (TPA)
In general, four cylinders 1.5 cm high and 2 cm wide were pre-
pared from every sample. A double compression cycle test was per-
formed up to 50% compression of the original portion height with
an aluminium cylinder probe of 2 cm diameter. A time of 5 s was
allowed to elapse between the two compression cycles. Force–time
deformation curves were obtained with a 25 kg load cell applied at
a cross-head speed of 2 mm/s. The following parameters were
quantified (Bourne, 1978): hardness (N) maximum force required
to compress the sample, springiness (m), ability of the sample to
recover its original form after deforming force was removed, adhe-
siveness (N s), area under the abscissa after the first compression,
and cohesiveness, extent to which the sample could be deformed
prior to rupture.
2.3.2. Tensile test
In general, five pieces were cut in a dumbbell shape, approxi-
mately 7.5 cm long, 2 cm wide in the narrowest zone and 0.2 cm
thickness per sample. A load cell of 5 kg was employed. For analy-
sis, one tensile grip (A/TGT) was fixed to the base of the textural
analyser, while the other one was attached to the load cell. Initial
grip separation was 12.5 mm and cross-head speed was 1.0 mm/s
until rupture (Herrero et al., 2007). Each sample was placed be-
tween both tensile grips on the textural analyzer. Rupture force
was taken as the maximum force peak height (N) required for
breaking the sample. Breaking strength (N/cm
2
) was obtained
dividing the rupture force by the cross-sectional area (thick-
ness  width) of the portions. Energy to fracture (N mm) was cal-
culated as the area under the deformation curve (Honikel, 1998).
2.3.3. Folding test
This test was conducted by folding a 3 mm thick slice of meat
sausage slowly in half, and then in half again to examine the struc-
tural failure of the sample. The evaluation was performed in accor-
dance with a five-point grade system (Suzuki, 1981) as follows:
grade (5), no crack when folded into quadrants; grade (4), no crack
when folded in half; grade (3), crack develops gradually when
folded in half; grade (2), crack develops immediately when folded
in half; grade (1), crumbles when pressed by finger.
2.4. Statistical analysis
An individual cooked meat sausage was the experimental unit
for analysis of all data. To check the normal distribution (90% con-
fidence) of samples, the Shapiro–Wilks test was applied. When
samples fitted the normal distribution, one-way ANOVA analysis
was performed. When samples did not fit the normal distribution,
the Kruskal–Wallis test was used to test the null hypothesis that
the medians of variables within each of the levels of samples were
the same. Duncan’s test to multiple mean comparisons (at 95% or
99% of confidence level), Pearson product moment correlations,
principal component, simple and multiple regression analysis
(using a Durbin–Watson statistic tests, at 95% of confidence level)
were performed to determine the relationships between data ob-
tained by tensile test, TPA and physico-chemical analysis. The sta-
tistical analysis was carried out using a Statgraphics Plus version
5.0. The analyses were conducted across all sausages types. Data
were presented as the mean of each sample and the standard devi-
ation (SD) of the mean.
3. Results and discussion
3.1. Physico-chemical analysis
Dry matter, fat content (% dry matter), water activity (a
w
) and
pH values of the different cooked sausages are shown in Table 2.
Significant differences (p < 0.01) in all these physico-chemical
parameters were found (Table 2). These differences (p < 0.01) could
be attributed to variations in the product formulation (Table 1) and
probably are not due to the type of cooked meat sausage. Results
show that dry matter ranged from 28.1% to 49.1% wet matter
and fat contents varied from 19.2% to 50.3% dry matter (Table 2).
In general, galantines had low dry matter and fat values (Table 2)
with values close to that reported by others authors (Mielnik, Aaby,
Rolfsen; Ellekjr, & Nilsson, 2002; Yılmaz et al., 2002). The cooked
sausages analysed (Table 1) could be grouped according to fat con-
tent as: low fat (<25%), medium fat (25–35%) and high fat (>35%).
According to this criterion, only 8.3% of the samples belonged to
the low fat group, 33.3% to the medium fat category, and 58.4%
to the high fat group. Samples of chopped and galantines were dis-
tributed in all three groups, although, in general, chopped samples
showed higher fat content that galantines. It was also observed
that almost all mortadella samples were classified as high fat.
The water activity and pH values of the commercial cooked
products studied ranged from 0.946 to 0.986 and 6.58 to 7.05,
respectively.
3.2. Textural analysis
Textural properties of the cooked meat sausages are shown in
Table 3. Results from the tensile and TPA analysis showed signifi-
cant variations (p < 0.05) indicating a great dispersion of textural
properties between all samples studied. The breaking strength
(BS) and energy to fracture (EF) fell between 0.03 and 4.67 N/cm
2
Table 2
Dry matter (DM, % wet matter), fat content (% DM), water activity (a
w
) and pH of
cooked meat sausages
Samples
A
DM Fat content a
w
pH
CH1 49.1 ± 0.5a 41.6 ± 1.6a,b 0.960 ± 0.001c,d 6.62 ± 0.14c
CH2 28.1 ± 0.5e 19.2 ± 1.4e 0.978 ± 0.001a,b 6.65 ± 0.14b,c
CH3 34.1 ± 2.2c,d 34.8 ± 4.0c 0.974 ± 0.001a,b 6.63 ± 0.10c
CH4 45.2 ± 0.7a,b 46.8 ± 1.1a 0.966 ± 0.001c 6.81 ± 0.14b,c
CH5 35.9 ± 1.4c 34.8 ± 0.5c 0.975 ± 0.001a,b 6.63 ± 0.02c
CH6 33.9 ± 1.4c,d 42.2 ± 3.0a,b 0.966 ± 0.001c 6.75 ± 0.21b,c
CH7 42.3 ± 0.4b 50.3 ± 1.9a 0.959 ± 0.003c,d 6.88 ± 0.04a
CH8 33.2 ± 1.3c,d 36.8 ± 3.3b 0.971 ± 0.002 b 6.72 ± 0.02b,c
MT1 33.7 ± 0.1c,d 43.8 ± 1.6a 0.969 ± 0.001b,c 6.65 ± 0.02b,c
MT2 39.8 ± 0.1b,c 45.8 ± 0.5a 0.980 ± 0.001a 6.75 ± 0.03b,c
MT3 37.1 ± 0.7c 41.6 ± 0.6a,b 0.970 ± 0.001b 6.76 ± 0.05b,c
MT4 37.2 ± 0.8c 49.2 ± 0.5a 0.970 ± 0.001b 6.76 ± 0.05b,c
MT5 31.1 ± 1.6d 44.4 ± 5.1a 0.974 ± 0.001a,b 7.05 ± 0.04a
MT6 27.8 ± 0.1e 35.3 ± 2.1c 0.977 ± 0.001a,b 6.81 ± 0.03b,c
MT7 47.2 ± 3.2a 46.9 ± 1.0a 0.946 ± 0.003d 6.61 ± 0.05c
MT8 31.3 ± 0.2d 38.9 ± 1.6b 0.964 ± 0.001c 6.72 ± 0.06b,c
MT9 30.9 ± 0.8d 32.7 ± 0.1c 0.968 ± 0.001b,c 6.82 ± 0.08a,b
GL1 36.9 ± 0.1c 35.8 ± 0.5c 0.961 ± 0.001c,d 6.83 ± 0.01a,b
GL2 24.6 ± 1.7f 20.6 ± 1.1e 0.967 ± 0.001c 6.62 ± 0.11c
GL3 32.9 ± 1.1c,d 32.0 ± 0.9c 0.966 ± 0.003c 6.69 ± 0.01b,c
GL4 42.2 ± 0.3b 32.1 ± 0.2c 0.966 ± 0.001c 6.58 ± 0.07d
GL5 35.1 ± 0.8c,d 39.5 ± 0.8b 0.963 ± 0.001c,d 6.83 ± 0.01a,b
GL6 31.0 ± 0.8d 29.2 ± 2.0d 0.966 ± 0.001c 6.75 ± 0.03b,c
GL7 32.0±1.2c,d 23.7 ± 1.3d 0.986 ± 0.001a 6.81 ± 0.14b,c
Different letters in the same column indicate significant differences (p < 0.001).
A
ACH, chopped; MT mortadella; GL, galantines.
692 A.M. Herrero et al. /Meat Science 80 (2008) 690–696
and 0.68 and 18.35 N mm, respectively. The most representative
values of BS and EF were those in the range of 1–3 N/cm
2
and 4–
12 N mm, respectively. About 50% of cooked meat sausages
showed BS and EF values within these intervals. The galantines
had low-values of BS and EF, except for the GL1 sample. Hardness
ranged from 20.9 to 78.2 N, with around 63% of the samples show-
ing values lower than 50 N (Table 3). As in the case of BS and EF,
the galantines had low hardness, except for the GL1 sample. Values
for adhesiveness values ranged from À0.02 to À1.08 N mm, indi-
cating a great variation in this textural property amongst all sam-
ples studied. The cohesiveness ranged from 0.21 to 0.34, from 0.18
to 0.50 and from 0.27 to 0.46 for chopped, mortadella and galan-
tines, respectively. Springiness values showed less variation with
88% of samples ranging from 0.45 to 0.65 10
À2
m. The range of
TPA values shown in Table 3 are similar to that reported by some
authors for different cooked sausages (García et al., 2006; Kerr
et al., 2005; Mor-Mur & Yuste, 2003; Yılmaz et al., 2002). According
to the folding test (Table 3) samples were assigned to grades 3, 4
and 5. Only 33% of the products did not crack when folded into
quadrants and fell into the maximum grade (5). However, 62.5%
of chopped and about 71% of the galantines scored grade 3 (crack
develops gradually when folded in half), while only 11% of the
mortadella scored this grade. The majority of the mortadella,
55.5%, was in grade 5.
Pearson product moment correlations among the texture vari-
ables shown in Table 3 were performed. Results indicated that
BS, hardness, cohesiveness and adhesiveness were strongly corre-
lated (p < 0.0001). After applying an analysis of principal compo-
nents using the data obtained for these textural properties of
cooked sausages as criterion of association, it was possible to dis-
tinguish three different clusters. The mean values of BS, hardness,
cohesiveness and adhesiveness of the different sausages included
in each cluster and the mean values of springiness were calculated
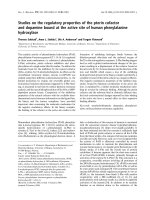
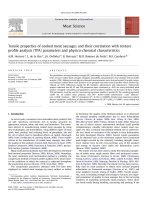
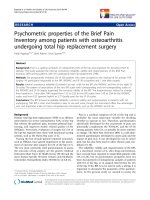
and then plotted. As it can be observed in Fig. 1, three different
(p < 0.05) textural profiles, arbitrary named 1, 2, and 3, were ob-
tained. These textural profiles showed significant (p < 0.05) differ-
ences for textural properties, mainly for BS, hardness, adhesiveness
and cohesiveness (Fig. 1). The main textural differences (p < 0.05)
were observed between the textural profiles 1 and 3. Textural pro-
file 1 showed lower values (p < 0.05) of BS, hardness, adhesiveness,
cohesiveness and springiness than textural profile 3. Profile 2
Table 3
Textural properties of cooked meat sausages
Samples
A
Breaking strength (N cm
À2
) Energy to fracture (N mm) Hardness (N) Adhesiveness (N s) Cohesiveness Springiness 10
À2
m Foldingtest grade
CH1 0.24 ± 0.08d 2.17 ± 0.47c 61.2 ± 3.6c,d À0.02 ± 0.02a 0.21 ± 0.06d 0.55 ± 0.06b,c 3
CH2 0.03 ± 0.01d 0.68 ± 0.08e 23.7 ± 1.7a À0.17 ± 0.06b,c 0.26 ± 0.07c 0.47 ± 0.09c,d 3
CH3 1.70 ± 0.26b 5.14 ± 0.98b 50.8 ± 4.9d,e À0.06 ± 0.01a 0.28 ± 0.04c 0.52±0.07c 3
CH4 1.87 ± 0.38a,b 5.17 ± 1.54b 65.1 ± 6.3c À0.53 ± 0.06d,e 0.34 ± 0.09b 0.54 ± 0.06b,c 5
CH5 2.17 ± 0.20a,b 6.22 ± 0.98a,b 44.0 ± 3.7e À0.03 ± 0.02a 0.25 ± 0.03c 0.45 ± 0.05d 3
CH6 1.92 ± 0.36a,b 5.55 ± 1.54b 42.0 ± 5.6e À0.04 ± 0.01a 0.27 ± 0.09c 0.54 ± 0.10b,c 3
CH7 3.50 ± 0.50a 18.35 ± 2.06a 70.1 ± 5.8b À0.95 ± 0.10f 0.31 ± 0.07c 0.58±0.07b 5
CH8 2.80 ± 0.18a,b 7.90 ± 1.12a,b 54.6 ± 2.4d À1.08 ± 0.02f 0.32 ± 0.04b 0.61 ± 0.02a,b 5
MT1 1.64 ± 0.75b 4.36 ± 1.37b 41.9 ± 3.4e À0.37 ± 0.08d,e 0.40 ± 0.06a,b 0.48 ± 0.03c 4
MT2 0.15 ± 0.02d 1.04 ± 0.23d 37.7 ± 5.2e,f À0.24 ± 0.02b,c 0.18 ± 0.09d 0.46 ± 0.02c,d 3
MT3 0.96 ± 0.44c 2.28 ± 0.35c 40.6 ± 2.6e À0.18 ± 0.03b,c 0.39 ± 0.07a,b 0.62 ± 0.05a,b 4
MT4 0.84 ± 0.27c 2.13 ± 0.32c 41.7 ± 2.6e À0.20 ± 0.03b,c 0.40 ± 0.07a,b 0.62 ± 0.05a,b 4
MT5 4.25 ± 0.40a 16.09 ± 1.88a 55.3 ± 4.2d À0.60 ± 0.03e 0.45 ± 0.03a 0.67 ± 0.06a 5
MT6 3.36 ± 0.46a 14.64 ± 1.81a 41.9 ± 2.9e À0.40 ± 0.02d,e 0.50 ± 0.02a 0.67 ± 0.05a 5
MT7 3.59 ± 0.51a 11.44 ± 2.31a,b 78.2 ± 2.4a À0.31 ± 0.09c,d 0.48 ± 0.04a 0.64 ± 0.04a,b 5
MT8 2.03 ± 0.22a,b 6.86 ± 2.19a,b 45.2 ± 3.5e À0.24 ± 0.04b,c 0.45 ± 0.03a 0.53 ± 0.03c 5
MT9 2.73 ± 0.19a,b 10.05 ± 1.89a,b 40.6 ± 2.5e À0.85 ± 0.03f 0.39±0.08a,b 0.58 ± 0.03b 5
GL1 4.67 ± 0.24a 15.36 ± 1.31a 54.5 ± 3.6d À0.60 ± 0.10e 0.40±0.08a,b 0.62 ± 0.07a,b 5
GL2 1.65 ± 0.49b 4.25 ± 1.71b 32.5 ± 4.7f À0.03 ± 0.01a 0.34 ± 0.05b 0.50 ± 0.07c 3
GL3 1.10 ± 0.27b 4.86 ± 1.25b 34.9 ± 2.0f À0.03 ± 0.01a 0.28 ± 0.07c 0.46 ± 0.02d 3
GL4 0.57 ± 0.28c 2.24 ± 0.87c 20.9 ± 1.9a À0.24 ± 0.10b,c 0.27 ± 0.03c 0.48 ± 0.05c,d 3
GL5 0.96 ± 0.18c 1.88 ± 0.27c 21.0 ± 2.1a À0.13 ± 0.06a,b 0.37 ± 0.09b 0.64 ± 0.06a,b 3
GL6 1.24 ± 0.47b 4.30 ± 1.08b 37.4 ± 2.2e,f À0.59 ± 0.08e 0.34 ± 0.09b 0.61 ± 0.06a,b 4
GL7 0.08 ± 0.03d 0.72 ± 0.35e 50.8 ± 7.2d,e À0.10 ± 0.03a,b 0.46 ± 0.04a 0.68 ± 0.03a 3
Different letters in the same column indicate significant differences (p < 0.05).
A
CH, chopped; MT mortadella; GL, galantines.
0
3
6
BS
Hard
AdhCoh
Spr
0
3
6
BS
Hard
AdhCoh
Spr
0
3
6
BS
Hard
AdhCoh
Spr
Texture Profile 1 Texture Profile 2
Texture Profile 3
Samples
CH1, CH2, CH3, CH5, CH6, MT2,
GL2, GL3, GL4, GL5, GL7
Samples
MT1, MT3, MT4, GL6,
Samples
CH4, CH7, CH8,
MT5, MT6, MT7, MT8, MT9, GL1
1.0b
1.2b
3.2a
3.2
β
4.0
5.6
α
1.0z
2.9y
6.2x
2.9
η
3.9
χ
4.0
χ
0.5l
0.6kl
0.6k
0
3
6
BS
Hard
AdhCoh
Spr
0
3
6
BS
Hard
AdhCoh
Spr
0
3
6
BS
Hard
AdhCoh
Spr
Texture Profile 1
Texture Profile 3
Samples
CH1, CH2, CH3, CH5, CH6, MT2,
GL2, GL3, GL4, GL5, GL7
Samples
MT1, MT3, MT4, GL6,
Samples
CH4, CH7, CH8,
MT5, MT6, MT7, MT8, MT9, GL1
1.0b
1.2b
3.2a
3.2
β
ββ
4.0
5.6
α
1.0z
2.9y
6.2x
2.9
η
3.9
χ
4.0
χ
0.5l
0.6kl
0.6k
Fig. 1. Textural profiles (1, 2 and 3) and mean values of different textural param-
eters from cooked meat sausages (CH, chopped; MT, mortadella; GL, galantines). BS:
Breaking strength (N cm
À2
), Hard: Hardness (10
À1
N), Adh: Adhesiveness (À10 N s),
Coh: Cohesiveness (Â10), Spr: Springiness (10
À2
m). Mean values with different
letter differ significantly (p < 0.05): a, b for BS; a, b for Hard; x, y, z for Adh; v, g for
Coh; k, l for Spr.
A.M. Herrero et al. /Meat Science 80 (2008) 690–696
693
showed intermediate textural behaviour between profiles 1 and 3
with similar (p > 0.05) values of BS and hardness to textural profile
1, and similar values (p > 0.05) of cohesiveness and springiness to
profile 3, and intermediate values of adhesiveness (Fig. 1).
About 46% of cooked meat sausages were included in textural
profile 1 and only a 17% of the samples analysed were grouped
in the textural profile 2 (Fig. 1). It could be observed that morta-
della and galantine samples were very heterogeneous products be-
cause they are included in the three textural profiles although the
majority of mortadella (67%) belonged to profile 3 and 71% of gal-
antines were included in profile 1 (Fig. 1). Chopped was a more
homogeneous product with samples belonging to textural profiles
1 (62.5%) and 3 (Fig. 1).
The folding test results showed that samples included in tex-
tural profile 1 scored grade 3 (crack develops gradually when
folded in half). These results could be associated with low-values
of BS and TPA parameters of the textural profile 1. All products
belonging to profile 1 (Fig. 1) were visually characterized (Table
1) by a matrix of a fine emulsion that included large meat pieces
and other materials. Samples classified in the textural profile 3
(Fig. 1) scored grade 5 (Table 3) in the folding test (no crack
when folded into quadrants), which is the maximum grade, indi-
cating good gelling ability. These scores in the folding test could
be explained by the high values of breaking strength and TPA
parameters of the textural profile 3. The visual and rheological
analysis of profile 3 products indicated that its textural behaviour
could be associated with a strong matrix of fine emulsion with or
without coarse meat (Table 1). Folding test results indicated that
samples of textural profile 2 scored grade 4, no crack when
folded in half. These textural profiles had intermediate values
for BS and TPA parameters. The visual (Table 1) and the rheolog-
ical analysis (Table 3, Fig. 1) could indicate that texture behav-
iour of samples of profile 2 are associated with a well gelled
matrix which included materials of different origin and size
(kamaboko, olives, etc.) or fat cubes which are easily liberated
during the folding test.
3.3. Linear regression analysis
The multiple linear regression analyses (Table 4), using the dif-
ferent textural parameters as dependent variables and values of
dry matter, fat contents and a
w
as independent variables, revealed
a significant relation between hardness (R
2
= 0.308, p < 0.05), cohe-
siveness (R
2
= 0.440, p < 0.0005), breaking strength (R
2
= 0.330,
p < 0.005), energy to fracture (R
2
= 0.234, p < 0.05) and folding test
grade (R
2
= 0.334, p < 0.05), versus DM, fat content and a
w
(Table 4).
The statistical significance of the t-values indicates that DM and fat
content participate in all textural parameters previously men-
tioned. These results are in agreement with some authors who
have described the relationship between fat content and textural
properties of cooked meat sausages (Giese, 1996; Jiménez-Colmen-
ero, 2000; Rust & Olson 1988). Results of the t-values showed a sig-
nificant correlation between a
w
and cohesiveness, BS and EF. In
previous work (Herrero et al., 2007) it was found that in dry fer-
mented sausages, a
w
is highly correlated with breaking strength,
while dry matter is correlated with cohesiveness, springiness and
adhesiveness.
Simple linear regression analysis was performed to determine
the degree of association between BS and EF versus folding test
grade (FG). Significant (p < 0.0001) coefficients of determination
between tensile and folding test parameters were obtained
(R
2
= 0.586 for BS versus FG and R
2
= 0.564 for EF versus FG). The
equations of the fitted models were BS = À2.533 + 1.120
*
FG
(correlation coefficient, R = 0.765, R
2
adjusted for degrees of
Table 4
Multiple linear regression analysis of textural parameters versus dry matter (DM, % wet matter), fat content (% DM) and water activity (a
w
) of cooked meat sausages
Dependent variable R
2
SE Independent variable Regression coefficient t-Values b- Values
Hardness 0.308
*
8.917 Constant 22.496
DM À0.929 À2.762
*
À0.432
Fat content 0.766 3.148
**
0.518
a
w
21.717 À1.026 0.012
Cohesiveness 0.440
***
0.069 Constant 7.396
DM À0.012 À4.184
***
À0.637
Fat content 0.007 3.896
***
0.561
a
w
À7.119 À3.639
**
À0.547
Adhesiveness 0.080 0.382 Constant 3.281
DM 0.001 0.054 0.009
Fat content À0.014 À1.080 À0.225
a
w
À3.305 À0.268 À0.057
Springiness 0.115 0.001 Constant 0.025
DM 5.011x10
À5
À0.942 0.020
Fat content 6.554x10
À5
1.954 0.039
a
w
À0.020 À0.587 À0.114
Breaking strength 0.330
**
1.443 Constant 106.383
DM À0.119 À2.163
*
À0.330
Fat content 0.097 2.785
*
0.422
a
w
À107.14 À2.977
**
0.438
Energy to fracture 0.234
*
5.019 Constant 303.271
DM À0.467 À2.332
*
À0.362
Fat content 0.348 2.733
*
0.414
a
w
À302.775 À2.222
*
À0.350
Folding test grade 0.334
*
0.81 Constant 44.16
DM À0.075 À1.943
*
À0.003
Fat content 0.06 2.491
*
0.002
a
w
À41.28 À1.67 À0.152
n = 72; SE = standard error; R
2
= coefficient of determination (correlation coefficient square).
*
p < 0.05.
**
p < 0.005.
***
p < 0.0005.
694 A.M. Herrero et al. /Meat Science 80 (2008) 690–696
freedom = 0.567, mean absolute error = 0.751) and EF = À10.182 +
4.235
*
FG (R = 0.751, R
2
adjusted for degrees of freedom = 0.545,
mean absolute error = 2.85). Table 5 shows the multiple linear
regression analysis of the BS and EF versus TPA parameters (cohe-
siveness, adhesiveness, hardness and springiness) for each cooked
meat sausage type (chopped, mortadella or galantines) and for all
samples. In the chopped samples, a significant multiple linear
regression model (R
2
= 0.733, p < 0.00005) was found between
breaking strength and TPA parameters, while energy to fracture
was not significant correlated (p > 0.05) with parameters obtained
by TPA analysis (Table 5). Student’s t-values of cohesiveness, adhe-
siveness, hardness and springiness partial regression coefficients
were significant [BS versus cohesiveness (p < 0.0005), BS versus
adhesiveness (p < 0.0005), BS versus hardness (p < 0.00005) and
BS versus springiness (p < 0.00005)]. However, b values suggest
that cohesiveness, hardness and springiness values have direct
influence on the BS determination.
A highly significant multiple linear regression was found be-
tween breaking strength (R
2
= 0.864, p < 0.00005) and energy to
fracture (R
2
= 0.809, p < 0.00005) and TPA parameters in mortadella
samples (Table 5). In these meat products, Student’s t-values of
cohesiveness (p < 0.005), adhesiveness (p < 0.005) and hardness
(p < 0.00005) partial regression coefficients were significant versus
BS, while all TPA parameters [(cohesiveness (p < 0.0005), adhesive-
ness (p < 0.00005), hardness (p < 0.05), and springiness (p < 0.05)]
partial regression coefficients were significant versus EF. In addi-
tion, b values suggest that hardness and adhesiveness are the most
important TPA parameters in BS and EF determination, respectively.
In the galantine samples, it was possible to find a high signifi-
cant multiple linear regression (R
2
= 0.937, p < 0.05) between
Table 5
Multiple linear regression analysis of tension mechanical parameters (breaking strength and energy to fracture) versus texture profile analysis (TPA) parameters of cooked meat
sausages
Dependent variable R
2
SE Independent variable Regression coefficcient t-Values b- Values
Chopped
Breaking strength 0.733
****
0.651 Constant À0.148
Cohesiveness 6.455 4.065
***
0.694
Adhesiveness À3.285 À3.360
***
À0.706
Hardness 0.048 5.735
****
0.866
Springiness À506.07 À5.196
****
0.999
Energy to fracture 0.573 4.796 Constant À9.109
Cohesiveness 6.307 0.407 0.092
Adhesiveness À2.681 À0.584 À0.205
Hardness 0.258 1.710
***
0.464
Springiness 44.884 0.058 0.030
Mortadella
Breaking strength 0.864
****
0.535 Constant À3.817
Cohesiveness 6.359 3.003
**
0.503
Adhesiveness À2.890 À3.798
**
0.574
Hardness 0.061 6.510
****
0.999
Springiness À97.42 0.498 À0.147
Energy to fracture 0.809
****
2.638 Constant À24.028
Cohesiveness 33.289 3.914
***
0.898
Adhesiveness À19.206 À5.066
****
0.998
Hardness 0.106 2.135
*
0.440
Springiness 1038.82 1.937
*
0.590
Galantines
Breaking strength 0.937
*
0.206 Constant 2.930
Cohesiveness À3.068 À1.708 À0.650
Adhesiveness À1.218 À3.879
**
À0.889
Hardness À0.012 À1.434 À0.583
Springiness À86.20 À0.969 À0.436
Energy to fracture 0.509 2.973 Constant 10.395
Cohesiveness À11.530 À0.451 À0.198
Adhesiveness 1.097 0.251 0.111
Hardness 0.036 0.333 0.148
Springiness À562.72 À0.507 À0.222
Combination of all cooked meat sausages
Breaking strength 0.745
****
0.643 Constant À0.160
Cohesiveness 6.600 4.462
***
0.633
Adhesiveness À1.255 À3.670
***
À0.509
Hardness 0.048 6.118
****
0.834
Springiness À506.31 À5.271
****
À0.778
Energy to fracture 0.491
****
3.921 Constant À4.487
Cohesiveness À11.530 1.797 0.264
Adhesiveness 1.097 À2.443
*
À0.355
Hardness 0.036 3.861
***
0.531
Springiness À562.72 À1.680 À0.251
SE = standard error; R
2
= Coefficient of determination (Correlation coefficient square).
*
p < 0.05.
**
p < 0.005.
***
p < 0.0005.
****
p < 0.00005.
A.M. Herrero et al. /Meat Science 80 (2008) 690–696
695
breaking strength and TPA parameters, although only Student’s
t-value of adhesiveness partial regression coefficient was signifi-
cant versus BS. Energy to fracture was not significant correlated
(p > 0.05) with TPA parameters (Table 5) for galantines.
For all cooked meat sausages, a highly significant multiple linear
regression was found between breaking strength (R
2
= 0.745,
p < 0.00005) and TPA parameters (Table 5). The Student’s t-values
of cohesiveness, adhesiveness, hardness and springiness partial
coefficients were significant [BS versus cohesiveness (p < 0.0005),
BS versus adhesiveness (p < 0.0005), BS versus hardness (p <
0.00005), BS versus springiness (p < 0.00005)]. In addition, b values
suggest that hardness plays the most important role in breaking
strength determination. Also, a significant regression was found
between energy to fracture (R
2
= 0.491, p < 0.00005) and TPA
parameters (Table 5) but only Student’s t-values of adhesiveness
and hardness partial coefficients were significant [EF versus
adhesiveness (p < 0.05) and EF versus hardness (p < 0.0005)].
Therefore, the best regression model to predict tensile proper-
ties for cooked meat sausages is using BS as the dependent
variable and TPA parameters as independent variables. The
resulting regression model is BS = À0.160 + 6.600
*
cohesiveness À
1.255 * adhesiveness + 0.048 * hardness À 506.31 * springiness. The
correlation coefficient R was 0.863, the R
2
adjusted for degrees
of freedom 0.715, and the mean absolute error was 0.511. Results
of the multivariate analysis confirm that TPA parameters chosen
were relevant for constructing regression models to predict BS
for cooked meat sausages. Therefore with only a TPA analysis it
could be possible to obtain both the TPA and tensile parameters
such as the breaking strength.
4. Conclusions
The determination of breaking strength (BS) and the energy to
fracture (EF) by tensile test can be used together with the TPA, to
determine textural properties of cooked meat sausages. With these
analyses complementary information is obtained, which permits
grouping of cooked meat sausages into three different textural pro-
files. These textural profiles are characterized by the values BS,
hardness, adhesiveness and cohesiveness.
The multivariate analysis confirms that TPA parameters (cohe-
siveness, adhesiveness, hardness and springiness) could be used
to construct regression models to predict breaking strength.
Therefore, with only a TPA analysis it could be possible to obtain
both the TPA and tensile parameters such as the breaking
strength.
Acknowledgements
This work was funded by the (Project AGL04-6773). A.M. Herre-
ro was supported by a contract from the Juan de la Cierva Program
and M.D. Romero de Avila was awarded a grant, from the Ministe-
rio de Educación y Ciencia. Authors are also grateful to the Univers-
idad Complutense and Comunidad de Madrid for their financial
support to the research group ‘‘920276-Tecnología de Alimentos
de Origen Animal”.
References
Bourne, M. C. (1978). Texture profile analysis. Food Technology, 32, 62–66.
Bourne, M.C. (2002). Principles of objective texture measurement. In M. C. Bourne
(Ed.), Food texture and viscosity: Concept and measurement (pp. 107–188). San
Diego, USA.
Christensen, M., Purslow, P. P., & Larsen, L. M. (2000). The effect of cooking
temperature on mechanical properties of whole meat, single muscle fibres and
perimysial connective tissue. Meat Science, 55, 301–307.
Christensen, M., Young, R. D., Lawson, M. A., Larsen, L. M., & Purslow, P. P. (2003).
Effect of added (l-calpain and post-mortem storage on the mechanical
properties of bovine single muscle fibres extended to fracture. Meat Science,
66, 105–112.
Desmond, E. (2006). Reducing salt: A challenge for the meat industry. Meat Science,
74, 188–196.
Farouk, M. M., Hall, W. K., Harrison, M., & Swan, J. E. (1999). Instrumental and
sensory measurement of beef patty and sausage texture. Journal of Muscle Foods,
10, 17–28.
Farouk, M. M., Zhang, S. X., & Waller, J. (2005). Meat spaghetti tensile strength and
extensibility as indicators of the manufacturing quality of thawed beef. Journal
of Food Quality, 28, 452–466.
García, M. L., Cáceres, E., & Selgas, M. D. (2006). Effect of inulin on the textural and
sensory properties of mortadella, a Spanish cooked meat product. International
Journal of Food Science and Technology, 41, 1207–1215.
Giese, J. (1996). Fats, oils and fat replacers. Food Technology, 50, 78–83.
Hanson, S. W. F., & Olley, J. (1963). Application of the Blight and Dyer method of
lipid extraction to tissue homogenates. Biochemical Journal, 89, 101–120.
Herrero, A. M., Ordóñez, J. A., Romero de Ávila, M. D., Herranz, B., de la Hoz, L., &
Cambero, M. I. (2007). Breaking strength of dry fermented sausages and their
correlation with Texture Profile Analysis (TPA) and physico-chemical
characteristics. Meat Science, 77, 331–338.
Honikel, K. O. (1998). Reference methods for the assessment of physical
characteristics of meat. Meat Science, 49, 447–457.
Jiménez-Colmenero, F. (2000). Relevant factors in strategies for fat reduction in
meat products. Trends in Food Science and Technology, 11, 56–66.
Kemi, V. E., Karkkainen, M. U., & Lamberg-Allardt, C. J. E. (2006). High phosphorus
intakes acutely and negatively affect Ca
2+
and bone metabolism in a dose-
dependent manner in healthy young females. British Journal of Nutrition, 96,
545–552.
Kerr, W. L., Wang, X., & Choi, S. G. (2005). Physical and sensory characteristics of
low-fat Italian sausage prepared with hydrated oat. Journal of Food Quality, 28,
62–77.
Kilcast, D. (2004). Force/deformation techniques for measuring texture. In D. Kilcast
(Ed.). Texture in food (Vol. 2, pp. 109–145). Abington, Cambridge UK: Woodhead
Publishing Ltd
Lepetit, J., & Culioli, J. (1994). Mechanical properties of meat. Meat Science, 36,
203–237.
Lewis, G. J., & Purslow, P. P. (1989). The strength and stiffness of perimysial
connective tissue isolated from cooked beef muscle. Meat Science, 26, 255–269.
Mielnik, M. B., Aaby, K., Rolfsen, K., Ellekjr, M. R., & Nilsson, A. (2002). Quality of
comminuted sausages formulated from mechanically deboned poultry meat.
Meat Science, 61, 73–84.
Mor-Mur, M., & Yuste, J. (2003). High pressure processing applied to cooked sausage
manufacture: Physical properties and sensory analysis. Meat Science, 65,
1187–1191.
Mutungi, G., Purslow, P., & Warkup, C. (1995). Structural and mechanical changes in
raw and cooked single porcine muscle fibres extended to fracture. Meat Science,
40, 217–234.
Rust, R., & Olson, D. (1988). Making good ‘‘lite” sausage. Meat and Poultry, 34, 10–16.
Ruusunen, M., & Puolanne, E. (2005). Reducing sodium intake from meat products.
Meat Science, 70, 531–541.
Scott-Blair, G. W. (1958). Rheology in food research. Advances in Food Research, 8,
1–61.
Suzuki, T. (1981). Kamaboko (fish cake). In Fish and krill protein. Processing
technology (pp. 62–191). London: Applied Science Publishers Ltd
Willems, M. E. T., & Purslow, P. P. (1996). Effect of postrigor sarcomere length on
mechanical and structural characteristics of raw and heat-denatured single
porcine muscle fibres. Journal of Texture Studies, 27, 217–233.
Yılmaz, I., Simsek, O., & Isıklı, M. (2002). Fatty acid composition and quality
characteristics of low-fat cooked sausages made with beef and chicken meat,
tomato juice and sunflower oil. Meat Science, 62, 253–258.
696 A.M. Herrero et al. /Meat Science 80 (2008) 690–696