energy relaxation in cdse nanocrystals the effects of morphology and film preparation
Bạn đang xem bản rút gọn của tài liệu. Xem và tải ngay bản đầy đủ của tài liệu tại đây (1.16 MB, 8 trang )
Energy relaxation in CdSe nanocrystals: the
effects of morphology and film preparation
Bryan T. Spann, Liangliang Chen, Xiulin Ruan, and Xianfan Xu
*
School of Mechanical Engineering and Birck Nanotechnology Center, Purdue University, West Lafayette, IN 47906,
USA
*
Abstract: Ultrafast time-resolved absorption spectroscopy is used to
investigate exciton dynamics in CdSe nanocrystal films. The effects of
morphology, quantum-dot versus quantum-rod, and preparation of
nanocrystals in a thin film form are investigated. The measurements
revealed longer intraband exciton relaxation in quantum-rods than in
quantum-dots. The slowed relaxation in quantum-rods is due to mitigation
of the Auger-relaxation mechanism from elongating the nanocrystal. In
addition, the nanocrystal thin film showed long-lived confined acoustic
phonons corresponding to the ellipsoidal breathing mode, contrary to others
work on colloidal systems of CdSe nanocrystals.
©2012 Optical Society of America
OCIS codes: (320.7130) Ultrafast processes in condensed matter, including semiconductors;
(160.4236) Nanomaterials; (350.6050) Solar energy.
References and links
1. V. I. Klimov, “Optical nonlinearities and ultrafast carrier dynamics in semiconductor nanocrystals,” J. Phys.
Chem. B 104(26), 6112–6123 (2000).
2. V. I. Klimov, A. A. Mikhailovsky, S. Xu, A. Malko, J. A. Hollingsworth, C. A. Leatherdale, H. Eisler, and M. G.
Bawendi, “Optical gain and stimulated emission in nanocrystal quantum dots,” Science 290(5490), 314–317
(2000).
3. P. Kambhampati, “Hot exciton relaxation dynamics in semiconductor quantum dots: radiationless transitions on
the nanoscale,” J. Phys. Chem. C 115(45), 22089–22109 (2011).
4. P. Kambhampati, “Unraveling the structure and dynamics of excitons in semiconductor quantum dots,” Acc.
Chem. Res. 44(1), 1–13 (2011).
5. M. B. Mohamed, C. Burda, and M. A. El-Sayed, “Shape dependent ultrafast relaxation dynamics of CdSe
Nanocrystals: Nanorods vs Nanodots,” Nano Lett. 1(11), 589–593 (2001).
6. A. Nozik, “Quantum dot solar cells,” Physica E. 14(1-2), 115–120 (2002).
7. K. Tvrdy and P. V. Kamat, “Substrate driven photochemistry of CdSe quantum dot films: charge injection and
irreversible transformations on oxide surfaces,” J. Phys. Chem. A 113(16), 3765–3772 (2009).
8. K. Tvrdy, P. A. Frantsuzov, and P. V. Kamat, “Photoinduced electron transfer from semiconductor quantum dots
to metal oxide nanoparticles,” Proc. Natl. Acad. Sci. U.S.A. 108(1), 29–34 (2011).
9. M. C. Beard and R. J. Ellingson, “Multiple exciton generation in semiconductor nanocrystals: Toward efficient
solar energy conversion,” Laser Photon. Rev. 2(5), 377–399 (2008).
10. I. Robel, V. Subramanian, M. Kuno, and P. V. Kamat, “Quantum dot solar cells. harvesting light energy with
CdSe nanocrystals molecularly linked to mesoscopic TiO2 films,” J. Am. Chem. Soc. 128(7), 2385–2393 (2006).
11. A. Salant, M. Shalom, Z. Tachan, S. Buhbut, A. Zaban, and U. Banin, “Quantum rod-sensitized solar cell:
nanocrystal shape effect on the photovoltaic properties,” Nano Lett. 12(4), 2095–2100 (2012).
12. C. Murray, D. Norris, and M. Bawendi, “Synthesis and characterization of nearly monodisperse CdE (E= sulfur,
selenium, tellurium) semiconductor nanocrystallites,” J. Am. Chem. Soc. 115(19), 8706–8715 (1993).
13. F. Shieh, A. E. Saunders, and B. A. Korgel, “General shape control of colloidal CdS, CdSe, CdTe quantum rods
and quantum rod heterostructures,” J. Phys. Chem. B 109(18), 8538–8542 (2005).
14. W. Wang, S. Banerjee, S. Jia, M. L. Steigerwald, and I. P. Herman, “Ligand control of growth, morphology, and
capping structure of colloidal CdSe nanorods,” Chem. Mater. 19(10), 2573–2580 (2007).
15. J. Nanda, B. Kuruvilla, and D. Sarma, “Photoelectron spectroscopic study of CdS nanocrystallites,” Phys. Rev. B
59(11), 7473–7479 (1999).
16. J. Nanda, S. Sapra, D. D. Sarma, N. Chandrasekharan, and G. Hodes, “Size-Selected Zinc Sulfide
Nanocrystallites: Synthesis, Structure, and Optical Studies,” Chem. Mater. 12(4), 1018–1024 (2000).
17. D. J. Norris and M. G. Bawendi, “Measurement and assignment of the size-dependent optical spectrum in CdSe
quantum dots,” Phys. Rev. B Condens. Matter 53(24), 16338–16346 (1996).
#175480 - $15.00 USD
Received 4 Sep 2012; revised 31 Oct 2012; accepted 5 Nov 2012; published 12 Nov 2012
(C) 2012 OSA
14 January 2013 / Vol. 21, No. S1 / OPTICS EXPRESS A15
18. R. J. Ellingson, M. C. Beard, J. C. Johnson, P. Yu, O. I. Micic, A. J. Nozik, A. Shabaev, and A. L. Efros,
“Highly efficient multiple exciton generation in colloidal PbSe and PbS quantum dots,” Nano Lett. 5(5), 865–
871 (2005).
19. L W. Wang, M. Califano, A. Zunger, and A. Franceschetti, “Pseudopotential Theory of Auger Processes in
CdSe Quantum Dots,” Phys. Rev. Lett. 91(5), 056404 (2003).
20. D. Sagar, R. Cooney, S. Sewall, E. Dias, M. Barsan, I. Butler, and P. Kambhampati, “Size dependent, state-
resolved studies of exciton-phonon couplings in strongly confined semiconductor quantum dots,” Phys. Rev. B
77(23), 235321 (2008).
21. L. Dworak, V. V. Matylitsky, M. Braun, and J. Wachtveitl, “Coherent Longitudinal-Optical Ground-State
Phonon in CdSe Quantum Dots Triggered by Ultrafast Charge Migration,” Phys. Rev. Lett. 107(24), 247401
(2011).
22. L. Saviot, B. Champagnon, E. Duval, I. Kudriavtsev, and I. Ekimov, “Size dependence of acoustic and optical
vibrational modes of CdSe nanocrystals in glasses,” J. Non-Cryst. Solids 197(2-3), 238–246 (1996).
23. H. Lamb, “On the vibrations of an elastic sphere,” Proc. Lond. Math. Soc. S1-13(1), 189–212 (1881).
24. A. Cretì, M. Anni, M. Zavelani-Rossi, G. Lanzani, L. Manna, and M. Lomascolo, “Ultrafast carrier dynamics
and confined acoustic phonons in CdSe nanorods,” J. Opt. A: Pure Appl. Opt. 10(6), 064004 (2008).
1. Introduction
It is well known that semiconductor nanocrystals (NCs) exhibit pseudo-molecular electronic
band structures. The discrete nature of these electronic states in NCs can effectively be
modified by controlling chemical synthesis conditions to dictate the final NC shape. It has
been shown in various studies, e.g., by Klimov [1,2], Kambhampti [3,4], and Mohamed et al.
[5] that controlling NC size lends itself to controlling electronic relaxation. The rate of
excited state electronic relaxation helps determine materials’ device applicability. For
instance, semiconducting NCs show promise as both optical gain media [2] as well as
photovoltaic [6–9] (PV) materials as a result of modification of relaxation between discrete
energy levels. CdSe NCs have tunable bandgap energies near the peak of the solar radiation
spectrum, thereby making CdSe a suitable candidate as a PV material. Aspects of the
relaxation mechanisms in CdSe NCs are investigated here.
CdSe NC sensitized PV cells are theorized have better performance than traditional Si
based PV cells because of the potential for hot-carrier extraction. Hot-carrier extraction is
thought to be possible as a result of large spacings between energy levels in the conduction
band [10]. Various studies have been performed on colloidal systems of CdSe quantum-dots
(QDs) [1,3,4] and quantum-rods (QRs) [5] to investigate the hot-exciton relaxation. However,
to understand how CdSe NCs will perform as a photovoltaic material, it is crucial to
implement experimental conditions close to an operating PV cell. CdSe QD solar cells are
often prepared in a film form [7,8,10]. The film deposition results in a dense packing of NCs
rather than a colloidal solution flown through a cuvette as commonly used in experimental
studies. We show that the film packing causes a slowing in intraband relaxation, and also
affects the non-adiabatic relaxation mechanism. A recent study has found that QRs act as
better sensitizers for NC solar cells than QDs [11]. In this study, we also investigate the
morphology effect, QD vs. QR, i.e., the effect of the confinement condition on the relaxation
pathways in NCs.
2. Experiment
The CdSe NCs were synthesized using the well-established pyrolysis of organometallic
compounds method [12–14], resulting in high-crystallinity monodisperse CdSe NCs. This
technique employs a hot-injection technique to facilitate a fast-nucleation process. A typical
synthesis involved three primary steps, preparation of selenium precursor, preparation of
cadmium precursor, and injection and growth.
To prepare the selenium precursor, a mixture of 0.1262g selenium (Se) and 3 ml tri-n-
octylphosphine (TOP) was loaded into a flask and heated up to 150 °C. After the solution
became visibly clear, the heater was removed, and the cooled solution was then transferred
into a syringe for injection. To prepare the cadmium precursor, a mixture of cadmium oxide
(CdO), surfactants, and solvent were loaded into a flask and then heated and maintained at
300 °C until the solution became visibly clear. For the QDs, 0.2054 g CdO, 0.4508 g
tetradecylphosphonic acid (TDPA), 10 ml oleic acid (OA), and 10 ml 1-octadecene (ODE)
#175480 - $15.00 USD
Received 4 Sep 2012; revised 31 Oct 2012; accepted 5 Nov 2012; published 12 Nov 2012
(C) 2012 OSA
14 January 2013 / Vol. 21, No. S1 / OPTICS EXPRESS A16
were used. For the QRs, 0.2054 g CdO, 0.4508 g TDPA, 0.2741 g hexylphosphonic acid
(HPA), and 3.2751 g TOPO were used. To grow the NCs, the Se precursor was quickly
injected into the Cd precursor solution at 300 °C with vigorous stirring; this process was
maintained for approximately 5 minutes. Generally, longer reaction time resulted in larger
NCs. After the reaction was complete, the hot solution was immediately quenched by a
mixture of ice and water. The as-prepared NCs were thoroughly cleaned by repeating the
cycle of precipitation and dissolution six times. Hexanes and ethanol were used as the
solvent/non-solvent couple. Finally, to prepare the films, the NCs were first dispersed in n-
butylamine and then drop-casted onto a glass substrate. To verify monodispersity, the samples
were then characterized by transmission electron microscopy (TEM), X-ray diffraction
(XRD), and UV-Vis absorption spectroscopy.
For the exciton relaxation studies, we employed pump-probe transient absorption (TA)
spectroscopy. The TA experiment consists of a Spectra Physics Tsunami oscillator that is fed
into a Spectra Physics Spitfire regenerative amplifier that produces pulses of approximately
70 fs full-width-half-maximum at a central wavelength of 800 nm and a repetition rate of 5
kHz. From the amplifier, the pulses are split into pump and probe legs. The probe leg is sent
into a Quantronix TOPAS optical parametric amplifier (OPA). The OPA produces dispersion
compensated ultrafast pulses ranging from 450 nm to 2500 nm. From the OPA, the pulses are
sent to a precision controlled optical delay stage. The pump beam is sent through a
mechanical chopper rotating at a frequency of 500 Hz, then through a second harmonic
crystal to generate 400 nm pulses for sample excitation (sufficient energy to excite electrons
into a continuum of states in the conduction band [3]). The pump and probe are then focused
on the sample non-collinearly with 1/e
2
spot diameters of 150 µm and 80 µm for pump and
probe respectively. The pump fluence was set to approximately 6 µJ/cm
2
.
Band-pass filters were used with a balanced photo-receiver to reduce noise and ensure
accuracy of probe wavelength contribution to the change in transmission signal. The signal
from the balanced photo-receiver is sent to a preamplifier then to a lock-in amplifier that is
frequency and phase locked with the chopper. The signal was averaged over approximately
1000 pulses at each temporal delay location. The stage was scanned 10 times to achieve
reasonable signal to noise ratios.
3. Results and discussion
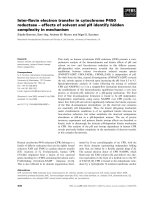
Analysis of TEM images shown in Figs. 1(a) and 1(d) show average QD diameters of ~4.0
nm with a standard deviation of 7% and average QR diameters of ~4.0 nm and lengths of
~10.0 nm with standard deviations of 9% and 12% for the diameters and lengths, respectively.
XRD experiments were used to characterize crystallinity and provide a secondary means of
measuring the average NC size. XRD results shown in Figs. 1(b) and 1(e) are consistent with
the zinc – blende cubic structure for CdSe. The XRD peaks have been fitted with Lorentzian
curves to calculate the average NC size using the Debye –Scherrer relationship;
cos( )
K
L
λ
β
θ
= (1)
where L is the average crystal size, K is the Scherrer constant assumed to be 0.9,
λ
is the
wavelength of the X-ray source (~0.154 nm for the Cu k – alpha source we employed),
β
is
the full width half maximum (FWHM) value of an XRD peak, and
θ
is the diffracted angle.
From L we can calculate an effective diameter given as D
eff
= (4/3)L [15,16]. Using these
relationships and selecting the most prominent (111) peak for the samples, an average QD
diameter was calculated as 3.9 nm which is close to the values obtained from the TEM. Using
the same method for the QR samples, an effective diameter found to be 6.8 nm, which is close
to the average of the length and the diameter from the TEM data (~7 nm). The
underestimation of crystal size by the Debye–Scherrer formula is likely due to additional
broadening of the XRD peak from lattice strain and instrument limitations. However the
agreement between methods is quite good.
#175480 - $15.00 USD
Received 4 Sep 2012; revised 31 Oct 2012; accepted 5 Nov 2012; published 12 Nov 2012
(C) 2012 OSA
14 January 2013 / Vol. 21, No. S1 / OPTICS EXPRESS A17
We purposely matched the diameters of the samples to investigate the effect of
morphology and the effective reduction in quantum confinement in one direction only.
Essentially, a comparison may be drawn between a pseudo-zero-dimensional structure and a
pseudo-one-dimensional structure. By elongating the QR past the CdSe Bohr radius of 5.6 nm
[17], this allows for the exciton to no longer be strongly spatially bound in one dimension,
resulting in intermediate exciton confinement.
UV-Vis absorption spectroscopy was used to characterize the electronic structure of the
QD and QR film samples. The absorption spectra for the QD and QR films are shown in Figs.
1(c) and 1(f) respectively. As mentioned above, the 4 nm diameter QDs are strongly confined,
resulting in a blue shifted 1S(e)-1S
3/2
(h) transition (~550 nm) when compared to the QR
1S(e)-1S
3/2
(h) transition (~625 nm). It should also be noted that the QD samples have a much
better monodispersity (~7%) resulting in a sharper 1S(e)-1S
3/2
(h) peak when compared with
the QR sample. This broadening of the QR samples 1S(e)-1S
3/2
(h) transition is due to non-
uniformity in the morphology between QRs combined with their dense packing; inducing
splitting of quantized levels. Figures 1(c) and 1(f) also show the scaled second derivatives of
the linear absorption spectra of the QD and QR films. Following the development by Klimov
[1], the second derivative data acts as a guide to the transient spectral evolution in TA
measurements of NCs. Furthermore, Figs. 1(c) and 1(f) note a B1 (bleaching) peak,
corresponding to the excited state 1S(e)-1S
3/2
(h) transition, and A1 peak corresponding to the
theorized energy for photo-induced absorption.
Fig. 1. TEM images, XRD, and UV - Vis absorption spectra with scaled second derivative data
of CdSe QD(a,b,c) and QR(d,e,f) films.
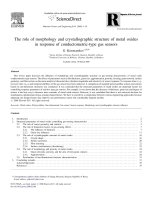
We will now discuss the exciton relaxation dynamics in the QD and QR films. TA results
for the QD film sample are shown in Fig. 2(a). The traces shown are a result of a 400 nm
pump pulse excitation, with various probe wavelengths chosen to probe the excited state B1
transition. The low pump fluence of approximately 6 µJ/cm
2
was used to ensure that the
number of electron – hole pairs generated by the pump per NC was less than unity thus
avoiding multi-particle Auger – recombination processes, such as two excitons recombining
non-radiatively to form one higher energy exciton [1]. The different color traces in Fig. 2(a)
correspond to the wavelengths shown in Fig. 2(b). The positive TA signals in the traces in
Fig. 2(a) are a result of state-filling induced bleach, stimulated emission, and the carrier-
#175480 - $15.00 USD
Received 4 Sep 2012; revised 31 Oct 2012; accepted 5 Nov 2012; published 12 Nov 2012
(C) 2012 OSA
14 January 2013 / Vol. 21, No. S1 / OPTICS EXPRESS A18
induced Stark effect (CISE), i.e., a superposition of all three processes [3]. The negative TA
signals arise from only the filling of newly available states as a result of the CISE.
Expounding on the photophysics further, consider the cases of probe energies near the B1
peak of the linear absorption spectra, i.e., 540, 550, and 560 nm probe wavelengths in Fig.
2(a). Before the pump photon arrives, one exciton has already been created by these probe
energies. When the pump photon arrives, another exciton is generated, and because the QDs
are strongly confined, the Coulomb interaction between the excitons in the system is
enhanced. As proposed by Klimov, this sequence of events creates carrier-induced Stark
shifts in the energy levels, which results in a red-shift of the B1 transition, consistent with the
second derivative of the linear absorption spectra. The newly shifted transitions (i.e. 1S(e)-
1S
3/2
(h) to B1) are filled, and from the Pauli exclusion principle, increases in transmission are
observed (i.e. state-filling induced bleach) [1]. The third contribution to positive transmission
signals comes from stimulated emission. State-filling induced bleach and stimulated emission
are indistinguishable in this experiment [3].
Now let us consider the remaining two probe wavelengths in Fig. 2(a), the 580 and 600
nm probe wavelengths. The 600 nm probe energy is not high enough to generate an exciton in
the QD. Therefore, before the pump photon arrives, no probe photons are absorbed. When the
pump photon arrives, the CISE indiscriminately shifts the levels regardless of electron
population, the probe photons are absorbed as a result of the red-shifted B1 transition,
resulting in a negative TA signal. This process has been coined photo-induced absorption
(PA) [1,3,18]. Both the negative and the subsequent positive trends exhibited by the 580 nm
probe wavelength in Fig. 2(a) are attributed to an initial PA process followed by bleaching
caused by the state-filling saturation.
Fig. 2. Transient absorption results (a) for the QD film using a 400 nm pump pulse and various
probe wavelengths shown in (b) where the color of the arrows corresponds to the respective
TA trace.
Now we will discuss the analogous experiment for the QR sample. The TA results for the
QR sample are presented in Fig. 3(a) with corresponding relative probe energies provided in
Fig. 3(b). Similar photo-physical processes are evident in the QR sample when compared
with the QD film for probing energies at and above the B1 state, i.e. 600, 620, and 640 nm
probes. Like the QD sample, the relative magnitudes in the TA traces between probing
energies at and above the B1 state follow the second derivative of the linear absorption
spectra quite well. However, unlike the QD sample, for probing energies below the B1 state,
i.e. 660 and 680 nm, the QR TA traces show only a small PA, thus deviating from the CISE
picture. This deviation can be explained by the relaxation of the confinement effect in the
QRs. Because the axial dimension of the QRs is greater than the Bohr radius, the exciton is no
longer heavily spatially bound, leading to a reduction in the local electric field via reduction
in the Coulomb interaction. Furthermore, the shift in energy of the 1S(e)-1S
3/2
(h) to B1 peak
for the QD and QR samples are 40 meV and 30 meV respectively. This is indicative of an
overall lower modification in energy levels for the QRs. This concept has also been shown for
#175480 - $15.00 USD
Received 4 Sep 2012; revised 31 Oct 2012; accepted 5 Nov 2012; published 12 Nov 2012
(C) 2012 OSA
14 January 2013 / Vol. 21, No. S1 / OPTICS EXPRESS A19
larger size QDs [1,3]. This reduced Coulomb interaction of a single exciton generated by the
pump photon (with probe energies below the B1 state) is not sufficient enough to create a
noticeable carrier-induced Stark shift in the energy levels. However, as mentioned above, the
CISE is evident for probe energies at and above the B1 state. This can be explained by the
addition of an exciton in the QR from the probe. This additional exciton creates a strong
enough Coulomb interaction to modify the electronic structure, thus showing evidence for
CISE.
Fig. 3. Transient absorption results (a) for the QR film using a 400 nm pump pulse and various
probe wavelengths shown in (b) where the color of the arrows corresponds to the respective
TA trace.
From a device perspective, e.g., hot-exciton solar cells, it is crucial to understand how the
electrons and holes relax in these materials so more efficient devices can be realized. This
information can be obtained from the TA results presented in Fig. 2(a) and Fig. 3(a). There
are three primary pathways of relaxation for electrons and two pathways for holes. Electrons
can relax via Auger – relaxation, non-adiabatic (i.e. by means of exciton-phonon interaction),
and through exterior transfer (e.g. through surface ligands). The holes relax primarily through
Auger – relaxation and non-adiabatic hole-phonon coupling [3]. Note that, unlike Auger –
recombination, Auger – relaxation refers to the process of hot electron transferring energy to
heavy hole in the valence band (VB) via inelastic electron – hole scattering causing the hole
to be farther removed from the VB edge. Due to the asymmetry about the Fermi level and the
differences in electron and hole masses (m
h
~6m
e
), the dense manifold of VB states allows
this hot-hole to relax quickly. This process is sometimes referred to as electron thermalization
[3] [19].
Hot-exciton PV performance relies on the disassociation of the electron and hole before
intraband relaxation of the electron and hole from the excited state to the band edge. The rise
time of the TA traces in Figs. 2(a) and 3(a), corresponds to the intraband exciton relaxation to
the respective probe energies. Therefore, the approximate time for an exciton to relax to the
band edge is the rise time of the B1 TA signal [1]. For the QD and QR sample, the intraband
relaxation times were approximately 700 fs and 1100 fs for the QD and QR respectively. The
increase in intraband relaxation for the QR sample is primarily due to mitigation of the Auger
– relaxation mechanism. This result is consistent with others work showing shorter relaxation
times due to an increase in the Auger mechanism caused by heavily confined NCs [3,4].
Furthermore, others have compared QD and QR samples in colloidal form, measuring
intraband relaxations of 400 fs and 1000 fs for QDs and QRs respectively [5]. However, the
samples presented in [5] were made have the same 1S(e)-1S
3/2
(h) transition rather than the
same diameter.
An additional outcome of the TA measurement was excitation of phonons at particular
probe wavelengths. From Fig. 2(a) and 3(a), the modulations in the TA signals are quite
obvious at the B1 probing wavelengths (i.e. 560 and 640 nm for the QD and QR samples
respectively). While other wavelengths near the B1 transition showed reduced oscillations,
the amplitude of the oscillations are maximized near the B1 peak for both samples. This
#175480 - $15.00 USD
Received 4 Sep 2012; revised 31 Oct 2012; accepted 5 Nov 2012; published 12 Nov 2012
(C) 2012 OSA
14 January 2013 / Vol. 21, No. S1 / OPTICS EXPRESS A20
strong amplitude modulation near the B1 peak is thought to be a result of non-Condon effects
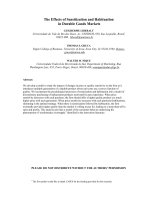
associated the transition moment [20]. We have computed the Fourier transforms of the B1
probe signals, and the results for the QD and QR samples are shown in Figs. 4(a) and 4(b)
respectively.
Fig. 4. Fourier transform of B1 probes for the QD (a) and QR (b) samples.
We can analyze the phonon oscillation by modeling the QDs as a spherical elastic
continuum [20–22]. Based on this assumption, the various acoustic phonon modes become
the eigenmodes of the Navier equation,
2
2
2
()()
u
udivu u
t
ρλ μ
∂
=+∇ +
∇
∂
(2)
where
u
is the directionally dependent lattice displacement,
ρ
is the mass density of CdSe,
and
λ
and
μ
are the Lamé constants. As initially proposed by Lamb [23], there are two
dominant vibrational modes for an elastic sphere. These modes are termed torsional and
spheroidal. The spheroidal modes contribute to the deformation of sphere. Because the
exciton acoustic phonon coupling is dominated by the deformation potential of the material
[20–22], the spheroidal mode will be the primary mode shown in TA measurements.
According to the mathematical development given by Sagar et al., the solution to Eq. (2) for
spheroidal modes is given by the following relationship [20],
() ( ) ( )
lm lm lm lm
ur p L hr q N kr=+ (3)
where
lm
L and
lm
N are eigenfrequency dependent spherical harmonics. h and k are related
to the eigenfrequencies by
222
(2)hk
ρ
ωλ
μμ
=+ = .
lm
p and
lm
q are constants associated
with the vibrational mode and the subscripts l corresponds to the quantum number of the
eigenmode and m is order of the eigenmode [22]. Solving these equations exactly for a CdSe
QD, it can be shown that the frequency is given as
/(2 )
lm lm i
Sv a
ω
= (4)
where
i
v is either the longitudinal acoustic velocity in CdSe (3570 m/s) or the transverse
acoustic velocity in CdSe (1540 m/s). a is the QD radius, and
lm
S is a constant associated with
boundary conditions. The two dominant modes are the radial breathing mode and the
ellipsoidal breathing mode. The radial breathing mode consists of longitudinal acoustic
phonons only, where
i
v is the longitudinal acoustic velocity, and l = 0 and m = 1 for the
primary mode. The ellipsoidal breathing mode consists of both transverse and longitudinal
acoustic phonons, where
i
v is the transverse acoustic velocity, l = 2 and m = 1 for the
#175480 - $15.00 USD
Received 4 Sep 2012; revised 31 Oct 2012; accepted 5 Nov 2012; published 12 Nov 2012
(C) 2012 OSA
14 January 2013 / Vol. 21, No. S1 / OPTICS EXPRESS A21
primary mode, and
lm
S is a function of both longitudinal and transverse acoustic phonon
velocities (see [22] for more details related to this development).
The frequencies shown in Fig. 4 are approximately 0.28 THz (9.3 cm
−1
) and 0.18 THz (6.0
cm
−1
) for the QD and QR samples respectively. Using Eq. (4) and assuming the ellipsoidal
mode, i.e.
i
v = transverse acoustic phonon velocity, 2 nm as the QD radius and a
calculated
lm
S = 0.84 (from [22]), results in a frequency of 0.32 THz, which is close to the
experimental value of 0.28 THz. The radial breathing mode frequency was calculated as 0.85
THz. Therefore, the ellipsoidal mode is dominant for the QD film sample. This result is not
consistent with previous works on colloidal CdSe QDs of similar diameter [20,21]. The
frequencies obtained from those works are roughly 0.6 THz (20.0 cm
−1
) for 5.4 nm diameter
QDs, which corresponds to the frequency of the calculated radial breathing mode.
Furthermore, because the radial breathing mode is dominated by longitudinal acoustic
phonons, colloidal QR samples with the same diameter as QD samples should have the same
vibrational frequency [24]. This again is not consistent with our results. In our case, the QRs
show much lower frequency compared to the result of the QDs of the same diameter. We
attribute our result to the transverse phonon propagation in the axial direction of the QR,
resulting in an overall lower frequency of lattice vibration. A closed form solution of the
ellipsoidal breathing mode for QRs similar to Eq. (4) above for QRs does not exist in the
literature (and deriving it is beyond the scope of this study). However, we can roughly
estimate the QR as a QD by taking an effective radius of 3.5 nm which is the average of half
its length and radius,
i
v = transverse acoustic phonon velocity, and
lm
S = 0.84 (from [22]).
The calculated vibrational frequency of the ellipsoidal breathing mode is 0.19 THz (6.3 cm
−1
)
which matches well with the measured frequency of 0.18 THz.
While the above results show strong evidence for the ellipsoidal breathing mode for non-
adiabatic relaxation, future TA studies are needed to further validate the above hypothesis.
For example, by considering different diameters for the QD samples and different aspect
ratios for the QR samples, the ellipsoidal mode phonon relaxation channel would be further
validated for CdSe NC films.
4. Conclusion
We found that both morphology and sample preparation play a role in hot-exciton relaxation.
For the QD film samples, the TA spectra was found to evolve in time consistent with the
CISE theory, while for the QR film samples the TA spectra evolved in time consistent with
the CISE only for probing energies greater than the B1 state. The deviation from the CISE
picture for QR samples for probing energies below the B1 state is due to the reduction in the
Coulomb interaction as a result of the relaxation in spatial confinement. The hot-exciton
intraband relaxation was found to be approximately 400 fs longer for the QR sample than in
the QD sample. This is thought to be due to a reduction in in the Auger – relaxation
mechanism for the QR samples. Furthermore, when compared with other works focusing on
colloidal NCs, e.g [5], the film samples measured here had longer hot-exciton intraband
relaxation for both QRs and QDs. We have also shown the phonon relaxation channel is
comprised of both transverse and longitudinal acoustic phonons for films, which is contrary to
colloidal QDs and QRs showing only longitudinal acoustic phonons.
Acknowledgment
Support to this work by the National Science Foundation is gratefully acknowledged.
#175480 - $15.00 USD
Received 4 Sep 2012; revised 31 Oct 2012; accepted 5 Nov 2012; published 12 Nov 2012
(C) 2012 OSA
14 January 2013 / Vol. 21, No. S1 / OPTICS EXPRESS A22