mode wise thermal conductivity of bismuth telluride
Bạn đang xem bản rút gọn của tài liệu. Xem và tải ngay bản đầy đủ của tài liệu tại đây (857.89 KB, 6 trang )
Yaguo Wang
Bo Qiu
School of Mechanical Engineering
and Birck Nanotechnology Center,
Purdue University,
West Lafayette, IN 47907
Alan J. H. McGaughey
Department of Mechanical Engineering,
Carnegie Mellon University,
Pittsburgh, PA 15213
Xiulin Ruan
Xianfan Xu
e-mail:
School of Mechanical Engineering
and Birck Nanotechnology Center,
Purdue University,
West Lafayette, IN 47907
Mode-Wise Thermal Conductivity
of Bismuth Telluride
Thermal properties and transport control are important for many applications, for
example, low thermal conductivity is desirable for thermoelectrics. Knowledge of mode-
wise phonon properties is crucial to identify dominant phonon modes for thermal trans-
port and to design effective phonon barriers for thermal transport control. In this paper,
we adopt time-domain (TD) and frequency-domain (FD) normal-mode analyses to inves-
tigate mode-wise phonon properties and to calculate phonon dispersion relations and
phonon relaxation times in bismuth telluride. Our simulation results agree with the previ-
ously reported data obtained from ultrafast time-resolved measurements. By combining
frequency-dependent anharmonic phonon group velocities and lifetimes, mode-wise ther-
mal conductivities are predicted to reveal the contributions of heat carriers with different
wavelengths and polarizations. [DOI: 10.1115/1.4024356]
Keywords: phonon dispersion, phonon lifetime, bismuth telluride, thermal conductivity
1 Introduction
Lattice thermal conductivity is associated with phonon trans-
port [1]. For many applications, thermal transport properties and
thermal transport control are important, for example, low thermal
conductivity is desirable for thermoelectrics. To tailor lattice
thermal conductivity effectively, a detailed understanding of
mode-wise phonon properties is necessary. Because of limitations
of experimental techniques, which only detect several specific
phonon modes, numerical approaches are needed to obtain a com-
plete picture of phonon dynamics [2]. As such, dominant phonon
modes for thermal transport can be identified and various phonon
barriers can be designed to tailor thermal transport properties [3].
For bismuth telluride (Bi
2
Te
3
), a widely used thermoelectric
material, phonon dynamics of a number of phonon modes has
been studied in experiments using ultrafast time-resolved techni-
ques [4–6]. Although molecular dynamics (MD) simulations have
been performed to predict lattice thermal conductivity [7,8], no
detailed theoretical work has been performed to reveal mode-wise
phonon relaxation times and mode-wise thermal conductivity in
bismuth telluride.
In this study, we adopt two-body interatomic potentials to study
the anharmonic mode-wise phonon properties of bulk Bi
2
Te
3
using TD and FD normal-mode analysis (NMA). The predicted
phonon velocities and phonon life times at a number of modes in
Bi
2
Te
3
are compared with experimental results. Our calculations
also yield mode-wise lattice thermal conductivity, which is help-
ful for analyzing thermal transport in nanostructured materials.
2 Numerical Methods
MD is a powerful tool for studying details of phonon dynamics.
A requirement for MD studies is a suitable potential function that
describes interatomic interactions. Bulk Bi
2
Te
3
has a rhombohe-
dral primitive cell belonging to the space group R
3m. At room
temperature, the corresponding conventional cell is hexagonal,
consisting of periodic fivefold layer along the c-axis: Te
1
–Bi–
Te
2
–Bi–Te
1
. The bonding force is covalent within the fivefold
layer and van der Waals between the layers [7]. The nearest-
neighbor distances between atoms in different monatomic layers
are 3.04 A
˚
for Te
1
–Bi bond, 3.24 A
˚
for Te
2
–Bi bond, and 3.72 A
˚
for Te
1
–Te
1
bond [9]. Huang and Kaviany developed a set of
three-body potentials for bulk Bi
2
Te
3
[7]. Even though the proper-
ties predicted by this 24-parameter-potential agree well with
experimental results, the computation cost is prohibitive to imple-
ment it into MD simulations. Qiu and Ruan developed two-body
potentials using density-functional theory calculations [8], which
we use here. The lattice thermal conductivities predicted from this
potential agree with experimental results between temperatures
of 150 to 500 K [8]. The two-body potentials are expressed as
follows:
U
ij
¼ U
s
ij
þ
q
i
q
j
r
ij
¼ D
e
½1 À exp½Àrðr
ij
À r
0
Þ
2
no
þ
q
i
q
j
r
ij
(1)
Here, the short-range potential U
s
ij
takes the Morse form, where
D
e
corresponds to the depth of potential well, r
0
denotes the equi-
librium bond distance, and r is the bond elasticity. The parameters
for the short-range potentials are listed in Table 1. Only the
nearest-neighbor interactions are considered in this set of poten-
tials and r
c
represents the cut-off distance for each pair of atoms.
To evaluate the long-range Coulomb interaction effectively,
Wolf’s summation [10] was applied with a cut-off radius of
11.28 A
˚
. q
i
and q
j
the last terms in Eq. (1) are the effective charges
of the ions, which are 0.38, À0.26, and À0.24 for Bi, Te
1
, and
Te
2
, respectively [8].
The lattice thermal conductivity j
L
is the sum over the contri-
butions from all phonon modes in the first Brillouin zone, j
j
for
mode j, called mode-wise thermal conductivity [11]
j
L
¼
X
j
j
j
¼
X
a
ð
C
V
t
2
g
sdk
*
(2)
Contributed by the Heat Transfer Division of ASME for publication in the
J
OURNAL OF HEAT TRANSFER. Manuscript received June 10, 2012; final manuscript
received November 2, 2012; published online July 26, 2013. Assoc. Editor: Pamela
M. Norris.
Journal of Heat Transfer SEPTEMBER 2013, Vol. 135 / 091102-1Copyright
V
C
2013 by ASME
Downloaded From: on 08/02/2013 Terms of Use: />where a corresponds to the mode polarization (LA, TA, LO, and
TO). As shown in Eq. (2), the three components of j
j
include
mode-wise volumetric heat capacity C
V
, phonon velocity t
g
, and
phonon lifetime s. Since Bi
2
Te
3
has a relatively low Debye tem-
perature, 155 K, we can simply use the high temperature limit
C
V
¼k
B
/V to estimate thermal conductivity at 300 K, where k
B
is
the Boltzmann constant where V is the volume of the MD simula-
tion cell. The second component anharmonic phonon velocity is
the gradient of anharmonic phonon dispersion, t ¼ @x=@k, where
k
*
is the phonon wave vector and x is the phonon angular fre-
quency. The third component is the anharmonic phonon lifetime.
Hence, in determining the mode-wise thermal conductivity j
j
, two
key quantities need to be calculated: the anharmonic phonon dis-
persion and the phonon lifetime. In what follows, two numerical
approaches—TD-NMA and FD-NMA will be described for pre-
dicting the anharmonic phonon dispersion and the phonon lifetime
in bulk Bi
2
Te
3
.
2.1 TD-NMA for Computing Anharmonic Phonon
Dispersion and Phonon Lifetimes. The time-domain normal-
mode analysis is based on lattice dynamics (LD). The essential
part of LD is to solve the equations of motion of the lattice
which is represented in the form of a dynamical matrix. The
eigenvectors of the dynamical matrix are the polarization vectors
of atomic motions and the square roots of corresponding eigen-
values are phonon frequencies. The wave-like solutions of LD
represent uncoupled motions of orthogonal oscillators, called
normal modes. Any harmonic motion c an be exactly expressed
as a superposition of normal modes. Harmonic displacement of
individual atoms can be written as the summation of all of t he
normal modes [12]
^
d
i
ðtÞ¼N
1=2
X
k
*
;a
Sða; k
*
Þe
*
ða; k
*
Þexp iðk
*
Á r
*
0
i
À xða; k
*
ÞtÞ
hi
(3)
where S denotes the normal-mode amplitude and e
*
is the polariza-
tion vector associated with the direction of motions. r
*
0
i
is the equi-
librium position of each atom denoted by i. Conversely, the
amplitude of every normal mode can be written as the summation
of displacements of all atoms
S
j
ða; k
*
Þ¼N
À1=2
X
i
m
1
2
i
expðÀik
*
Á r
*
0
i
Þe
*
Ã
j
ða; k
*
ÞÁ
^
d
i
(4)
where * denotes the complex conjugate. The harmonic angular fre-
quency x and polarization vector e
*
are computed through diagonaliz-
ing the dynamical matrix in LD using the software GULP [13]. k
*
is
specified based on the crystal structure and the size of the MD do-
main. m is the atomic mass, 208.98 for Bi and 127.60 for Te.
^
d
i
¼ r
*
i
À r
*
0
i
represents the displacement of atom i from its equilib-
rium position r
*
0
i
. The equilibrium position r
*
0
i
and displacement
^
d
i
are
computed from MD using the potential function described in Eq. (1).
The total energy of an individual mode under harmonic approx-
imation is computed as
E
j
ðtÞ¼E
j;P
þ E
j;K
¼
x
2
j
^
S
Ã
j
^
S
j
2
þ
^
_
S
Ã
j
^
_
S
j
2
(5)
where E
j,P
is the potential energy, E
j,K
is the kinetic energy, x
j
is
the quasi-harmonic angular frequency, and “Á” indicates deriva-
tive. The anharmonic phonon frequency is half of the oscillating
frequency of autocorrelation function of mode-wise potential
energy or kinetic energy [14]. Therefore, for every specified wave
vector, the corresponding anharmonic phonon frequency at finite
temperatures can be extracted from the oscillations of autocorrela-
tion of mode-wise potential/kinetic energy obtained from Eq. (5).
Applying this to all of the sampled wave vectors in the first Bril-
louin zone, anharmonic phonon dispersion curves can be
constructed.
A number of studies have investigated phonon lifetimes. The
decay of the autocorrelation of the total energy of argon was used
to deduce the effective phonon lifetimes [15]. Henry and Chen [2]
employed the definition of Ladd et al. [16] to extract phonon life-
time of silicon. For bismuth telluride, it is not trivial to perform
exponential fitting of the autocorrelation of the total energy due to
residual oscillation. Also, the phonon lifetimes defined by Ladd
et al. are not easy to converge because the numerical errors over-
whelm the actual phonon signal at longer time. Therefore, as
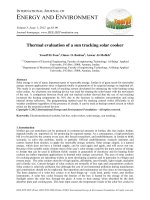
depicted in Fig. 1, we obtain the phonon relaxation time via fitting
a time constant of the integrated autocorrelation of potential
energy.
Figure 1 also shows the oscillations of the autocorrelation func-
tion of mode-wise potential energy, which has a frequency twice
of the corresponding anharmonic phonon frequency. In a sense,
NMA bridges the real space analysis and the phonon space analy-
sis by mapping the anharmonic information obtained in MD
(atomic displacement) to the phonon space with normal-mode
amplitude S.
2.2 FD-NMA. An alternative approach is the frequency-
domain normal-mode analysis. According to Ladd et al. [16], the
normal-mode amplitude can be written under the single mode
relaxation time approximation as
S
j
ða; k
*
Þ¼S
j;0
ða; k
*
Þe
Àiðxða; k
*
ÞÀiCða; k
*
ÞÞt
(6)
where the phonon spectral linewidth C is related to phonon life-
time s as follows:
s ¼ 1=2C (7)
Then, the Fourier transform of the time derivative of normal-
mode amplitude as given in Eq. (6) is
Fig. 1 Normalized autocorrelation of phonon potential energy,
integration of the autocorrelation, and the exponential fitting to
deduce phonon relaxation time
Table 1 Parameters of short-range potential [8]
Bond D
e
(eV) r (1/A
˚
) r
0
(A
˚
) r
c
(A
˚
)
Bi–Bi 0.085 2.212 4.203 5.5
Bi–Te
1
0.975 1.285 3.089 4.0
Bi–Te
2
0.582 1.257 3.251 4.0
Te
1
–Te
1
0.076 1.675 3.642 5.0
Te
1
–Te
2
0.807 0.731 4.497 5.5
Te
2
–Te
2
0.066 2.876 4.312 5.0
091102-2 / Vol. 135, SEPTEMBER 2013 Transactions of the ASME
Downloaded From: on 08/02/2013 Terms of Use: />F½
_
S
j
ða; k
*
Þ ¼
1
ffiffiffiffiffiffi
2p
p
ð
1
À1
S
j;0
ða; k
*
ÞðÀixða; k
*
ÞÀCða; k
*
ÞÞ
 e
Àiðxða;k
*
ÞÀxÞt
e
ÀCða; k
*
Þt
dt (8)
If we define the spectral energy density (SED) function as the
norm square of Eq. (8), then it can be shown that the SED function
is in the Lorentzian form [17]
wða; k
*
; f Þ
F½
_
S
j
ða; k
*
Þ
2
¼
Cða; k
*
Þ
½4psða; k
*
Þðf Àf ða; k
*
Þ
2
þ 1
(9)
Here Cða; k
*
Þ is the combination of coefficients which character-
izes the phonon spectral peak intensity and f ¼ x=2p is the pho-
non frequency. Based on the time history of atomic velocities
generated by MD simulations and eigen-displacements from
LD calculations, the normal-mode coordinates can be obtained
according to Eq. (6). Then, the SED function can be constructed
and fitted with Eq. (9) to extract the anharmonic phonon fre-
quency f ða; k
*
Þ and lifetime sða; k
*
Þ.
It should be emphasized that for both the time-domain and
frequency-domain NMA, not all of the k
*
vectors are allowed in a
specific MD domain due to the periodicity requirements. Only
those k
*
vectors in the first Brillouin zone associated with the
chosen unit cell satisfying e
Àik
*
Ár
*
¼ 1 can be supported by the MD
domain and thus resolved. Here, r
*
¼
P
3
i¼1
n
i
A
i
, where A
i
is
the length vector of the MD domain in direction i. As a result,
thermal conductivity contributions from phonons with very long
wavelength, which are near zone center phonons, are excluded.
The exclusion of these modes may lead to domain size effects.
Nonetheless, a reasonably sized simulation domain should
preserve the validness of at least the qualitative description of
physical processes.
3 Results and Discussion
3.1 Anharmonic Phonon Dispersion and Phonon
Velocity. LD calculations are first performed to produce har-
monic phonon dispersion and polarization vectors of atomic
motions, through diagonalizing dynamical matrix using
GULP.A
single rhombohedral primitive cell is computed in
GULP and 13 k
*
points are sampled between 0 and p/a along the U-Z direction. a
is the lattice parameter, 10.478 A
˚
for the rhombohedral unit cell.
MD simulation is then conducted to compute equilibrium posi-
tions and displacements of all of the atoms. At every MD step,
normal-mode amplitude S
j
is calculated according to Eq. (4), com-
bining information of wave vectors and polarization vectors. The
MD simulation domains contain 6, 9, and 12 rhombohedral unit
cells along each direction of three primitive vectors, with periodic
boundaries conditions. Starting with a pre-equilibrated sample,
MD runs in NVE (constant atom number, volume and total
energy) ensemble for 400 ps to calculate equilibrium positions of
all of the atoms and then another 5 ns to compute normal-mode
amplitudes. For every phonon branch, normal-mode amplitudes of
each phonon mode will be output at each MD step and stored in a
file for post analysis.
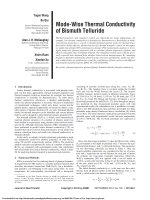
Following the method described in Sec. 2.1, the anharmonic
phonon dispersion curves at 300 K are constructed through TD-
NMA, marked as red dots in Fig. 2(a), where 6 out of 15 phonon
branches are shown, along the U-Z direction. Compared with
harmonic phonons calculated with LD, shown as closed dots,
anharmonic phonons at 300 K are softened and hence the phonon
dispersion curve is flattened due to anharmonicity. Anharmonicity
at finite temperatures comes from two aspects: lattice expansion
on temperature rise and anharmonic interaction among atoms. To
evaluate contribution to anharmonicity solely from lattice expan-
sion around 300 K, a quasi-harmonic case is evaluated, for which
LD calculation is conducted in
GULP but with the lattice constants
of 300 K. Quasi-harmonic results, shown as blue lines in Fig. 2(a),
indicate that the anharmonicity at 300 K mainly comes from lat-
tice expansion.
The predicted phonon frequency of the LO phonon at U point is
about 1.85 THz, agreeing well with the experimental result 1.86
THz [5]. Figure 2(c) gives the anharmonic dispersion curves of
acoustic phonons computed with different sample sizes, indicating
that the size effect is negligible. Phonon velocities are obtained by
calculating the slope of phonon dispersion curves. The predicted
sound velocity with the TD-NMA is about 2300 m/s for Bi
2
Te
3
,
about 10% smaller than that measured in pump-probe experi-
ments, $2600 m/s [4].
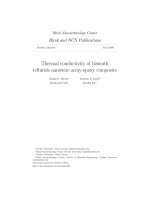
3.2 Phonon Lifetime. Figure 3(a) illustrates lifetimes of
acoustic and optical phonons for both longitudinal and transverse
polarizations along U-Z direction at 300 K, predicted by the
TD-NMA. Three regions are marked in Fig. 3(a) as acoustic pho-
nons, low-frequency optical phonons, and high-frequency optical
phonons. The phonon lifetimes increase when the wave vector
becomes smaller (wavelength becomes longer). The optical pho-
non lifetimes are about the same order as those acoustic phonons
near the edge of the Brillouin zone. No obvious size effect other
than uncertainty is observed in phonon lifetimes when computing
with different sample sizes. It is also noted that the lifetimes
of acoustic phonons generally exhibit power law dependence on
phonon frequencies as s / f
À2
, as predicted by Klemens [18].
Figure 3(b) plots the fitting for LA phonons, including results
from all three simulations domains to obtain sufficient number of
Fig. 2 (a) Dispersion curves of longitudinal and transverse
acoustic phonons. Solid lines: harmonic LD results (0 K);
dashed lines with open diamonds: quasi-harmonic results;
solid triangles: anharmonic NMA results (300K); (b) Velocity of
longitudinal and transverse acoustic phonons. (c) Anharmonic
phonon dispersion computed with different sample sizes.
Journal of Heat Transfer SEPTEMBER 2013, Vol. 135 / 091102-3
Downloaded From: on 08/02/2013 Terms of Use: />k
*
points near the C point. The longitudinal acoustic phonons
detected in experiments reported previously [4] have a wavelength
of about 125 nm, corresponding to a wave vector about 0.05 nm
À1
and a frequency of 0.016 THz. To access phonons with wave-
length as long as 125 nm, a simulation domain larger than 120
unit cells along the c-axis (more than 48,600 atoms) is required,
which poses computational challenges. Therefore, instead of
direct computation, the lifetimes of acoustic phonons with long
wavelength/low wave vectors can be extracted from the power
law fitting. The lifetimes of the 125 nm-phonon extrapolated from
the TD-NMA are 16.9 ns, which is consistent with experimental
measurements [4], where the 125 nm phonon does not show
obvious decay when traveling for about 400 ps in Bi
2
Te
3
.
The lifetime of the A
1g
optical phonon at the C point predicted
by TD-NMA is 4.2 ps, following the same approach of calculating
the lifetimes of acoustic phonons. Alternatively, by using the FD-
NMA at the C point and fitting the spectral peak of A
1g
optical
phonon mode to Eq. (9), the corresponding lifetime is found to be
5.6 ps. These predicted lifetimes agree with the experimental
result (5.3 ps) obtained using ultrafast time-resolved measure-
ments [5].
3.3 Cross-Plane Lattice Thermal Conductivity. A com-
plete set of mode-wise lattice thermal conductivity requires multi-
ple discrete points in the first Brillouin zone, outlined by primary
symmetry directions. This would involve a large amount of calcu-
lations for Bi
2
Te
3
because of its complex Brillouin zone and
proper simplifications are sought. Because of the large aspect ratio
of in-plane and cross-plane lattice constants, the first Brillouin
zone of Bi
2
Te
3
has a disk-like shape. If isotropic phonon disper-
sion in the in-plane radial direction is assumed and with the vol-
ume of the first Brillouin zone roughly preserved, the lattice
thermal conductivity can be expressed as follows:
j
z
L
¼
1
2p
2
X
a
ð
k
z;max
0
ð
k
x;max
0
c
V
t
2
g;z
ðk
x
; k
z
Þsðk
x
; k
z
Þk
x
dk
x
dk
z
(10)
where the double integration of k
x
, k
z
goes up to the Brillouin
zone boundaries k
x,max
, k
z,max
in each direction. Under this
approximation, the Brillouin zone is effectively approximated as a
cylindrical disk, as shown in Fig. 4(a).
The discretized k-grid is illustrated in Fig. 4(b). Therefore,
according to Eq. (10), the thermal conductivity is evaluated as a
sum of contributions from rings with radius equals to k
x
, thickness
equals to Dk
x
, and height equals the Brillouin zone thickness in
the z direction, as illustrated in Fig. 4(c). Due to the finite size of
the simulation domain, thermal conductivity contributions from
phonons with very long effective wavelength in x direction are
excluded. The exclusion of these modes will lead to domain size
effects in thermal conductivity prediction.
The size effect is tested using three simulation domains
6 Â4 Â4, 12 Â8 Â4, and 24 Â4 Â4 within the FD-NMA. It is
also found that the phonon relaxation times are not significantly
affected by the different domain sizes, indicating they are well-
converged. As suggested by Turney et al. [15] and Schelling et al.
[19], the inverse of the thermal conductivity is linearly propor-
tional to the system size. In the present study, due to the use of
isotropic approximation, we expect the inverse of thermal conduc-
tivity to be linearly proportional to the inverse of the dimension in
x direction. As seen in Fig. 5, the data do show good linear corre-
lation and the inverse of the y-intercept of the linear fitting gives
the cross-plane lattice thermal conductivity of bulk Bi
2
Te
3
. The
extrapolated value is 0.85 W/(mK), which does agree well with
the value of 0.89 W/(mK) predicted using Green-Kubo’s method
and the same two-body classical potentials in our earlier work [8].
Using the same approach, the extrapolated lattice thermal conduc-
tivity from TD-NMA is 0.93 W/(mK).
Fig. 3 (a) Lifetimes of phonons along the U-Z direction
computed using TD-NMA, L represents the number of cells
along c-axis. (b) Lifetimes of low-frequency acoustic phonons
along U-Z direction and their power law fittings.
Fig. 4 (a) The Brillouin zone of Bi
2
Te
3
.(b) Approximation of
the Brillouin zone with a cylindrical disk and the corresponding
discretized k-grid in the Z-C-X plane. (c) Integration of the whole
cylindrical disk to estimate the total thermal conductivity.
Fig. 5 Inverse of lattice thermal conductivity obtained based
on Eq. (10) as a function of the inverse of simulation domain
length L in x direction. The straight line is the linear fit for
extrapolation.
091102-4 / Vol. 135, SEPTEMBER 2013 Transactions of the ASME
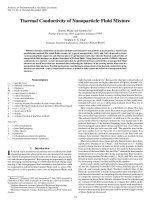
Downloaded From: on 08/02/2013 Terms of Use: />Figure 6(a) shows the contributions to the lattice thermal con-
ductivity with respect to phonon mean free path, computed with
the 12 Â12 Â12 simulation domain in TD-NMA. Phonons with
mean free path between 1 and 10 nm comprise about 80% of the
total lattice thermal conductivity. Figure 6(b) shows the contribu-
tions to lattice thermal conductivity of different phonon wave-
lengths, indicating that about 80% of the thermal conductivity is
attributed to phonons with wavelength less than 6 nm. Due to the
limited number of discretized k
*
points, the accumulative lattice
thermal conductivity in Fig. 6(b) does not have the smoothness as
that in Ref. [2]. The results shown in Fig. 6 provide new insight to
the size dependence of thermal conductivity in nanostructured
Bi
2
Te
3
. In particular, since the maximum phonon mean free
path in nanostructures is approximately equal to or less than the
characteristic dimension size (thickness for thin film, diameter for
nanowires and nanoparticles), Bi
2
Te
3
nanostructures with a sub-
10 nm characteristic size are needed to achieve significant reduc-
tion of lattice thermal conductivity in order for enhanced ZT. For
example, Venkatasubramanian [20] has shown the minimum lat-
tice thermal conductivity in Bi
2
Te
3
/Sb
2
Te
3
superlattice with
periods between 4 and 6 nm, which are comparable to the wave-
lengths of these dominant phonons. It should be noted that many
early measurements have shown a few times to an order of magni-
tude reduction in thermal conductivity in 20–100 nm nanostruc-
tures, such as in Ref. [21]. In light of our simulation data, those
low values are unlikely due to the size effect alone. Instead, point
defects, impurities, grain boundaries (in polycrystal nanostruc-
tures), and nonuniform composition might be responsible. There-
fore, one should be cautious in dealing with nanostructures for the
search of ZT enhancement. On the other hand, a recent experi-
mental measurement on a 52-nm Bi
2
Te
3
nanowire [22] and an
MD simulation on a 30-nm Bi
2
Te
3
nanowire [23] both show little
reduction in thermal conductivity, which are consistent with our
results here.
4 Summary
We adopted time-domain and frequency-domain normal-mode
analyses to calculate phonon dispersion relation and phonon relax-
ation times in bismuth telluride. Phonon velocities were extracted
from the gradients of phonon dispersion, which was calculated
with TD-NMA. Lifetimes of the A
1g
optical phonon at the C point
predicted by TD-NMA and FD-NMA agree with the experimental
value, and the lifetimes of acoustic phonons are consistent with
the experimental observation of the 125 nm-wavelength longitudi-
nal acoustic phonon. By combining the frequency-dependent
anharmonic phonon group velocities and lifetimes, mode-wise
thermal conductivities are predicted to reveal the contributions of
heat carriers with respect to phonon mean free path and wave-
length. It is found that over 80% of the lattice thermal conductiv-
ity is contributed by phonons with mean free path below 10 nm,
indicating that Bi
2
Te
3
nanostructures with sub-10 nm feature size
are needed to achieve significant size effect in lattice thermal
conductivity.
Acknowledgment
Support to this work by the National Science Foundation and
the Air Force Office of Scientific Research is gratefully
acknowledged.
Nomenclature
A
i
¼ length vector of the MD domain in direction i
C
v
¼ mode-wise volumetric heat capacity, m
2
kg s
À2
K
À1
Cða; k
*
Þ¼coefficients for the phonon spectral peak intensity, eV/Hz
D
e
¼ depth of potential well, eV
E
j
¼ mode-wise total energy, eV
^
d ¼ atomic displacement from their equilibrium position, A
˚
f ¼ phonon frequency, THz
k ¼ wave vector, m
À1
q ¼ effective charge
r
ij
¼ interatomic distance, A
˚
r
0
¼ equilibrium position of atom, A
˚
r
c
¼ cut-off distance of Wolf’s summation, A
˚
S ¼ normal-mode amplitude, A
˚
U ¼ interatomic potential, eV
a ¼ mode polarization (LA, TA, LO, and TO)
C ¼ phonon spectral line width, ps
À1
r ¼ bond elasticity of interatomic potential, A
˚
À1
e
*
¼ polarization vector associated with the direction
of motions, unit vector
K
L
¼ total thermal conductivity, W/mK
j
j
¼ mode-wise thermal conductivity, W/mK
t
g
¼ phonon velocity, m/s
s ¼ phonon relaxation time, ps
w ¼ spectral energy density, eV/Hz
x ¼ angular phonon frequency, rad/s
References
[1] Hook, J. R., and Hall, H. E., 1991, Solid State Physics, Vol. xxi, Wiley,
Chichester; New York, p. 474.
[2] Henry, A. S., and Chen, G., 2008, “Spectral Phonon Transport Properties of
Silicon Based on Molecular Dynamics Simulations and Lattice Dynamics,”
J. Comput. Theor. Nanosci., 5, pp. 141–152. Available at />nanoengineering/publications/PDFs/Henry_JCompTheoNanoSci_2008.pdf
[3] Huang, Z., Fisher, T. S., and Murthy, J. Y., 2010, “Simulation of Phonon Trans-
mission Through Graphene and Graphene Nanoribbons With a Green’s Func-
tion Method,” J. Appl. Phys., 108, p. 094319.
[4] Wang, Y., Liebig, C., Xu, X., and Venkatasubramanian, R., 2010, “Acoustic
Phonon Scattering in Bi
2
Te
3
/Sb
2
Te
3
Superlattices,” Appl. Phys. Lett., 97,p.
083103.
[5] Wang, Y. G., Xu, X. F., and Venkatasubramanian, R., 2008, “Reduction in
Coherent Phonon Lifetime in Bi
2
Te
3
/Sb
2
Te
3
Superlattices,” Appl. Phys. Lett. ,
93, p. 113114.
[6] Wu, A. Q., Xu, X., and Venkatasubramanian, R., 2008, “Ultrafast Dynamics of
Photoexcited Coherent Phonon in Bi
2
Te
3
Thin Films,” Appl. Phys. Lett., 92,p.
011108.
[7] Huang, B. L., and Kaviany, M., 2008, “Ab Initio and Molecular Dynamics Pre-
dictions for Electron and Phonon Transport in Bismuth Telluride,” Phys. Rev.
B, 77, p. 125209.
[8] Qiu, B., and Ruan, X. L., 2009, “Molecular Dynamics Simulations of Lattice
Thermal Conductivity of Bismuth Telluride Using Two-Body Interatomic
Potentials,” Phys. Rev. B, 80, p. 165203.
[9] Richter, W., Kohler, H., and Becker, C. R., 1977, “Raman and Far-Infrared
Investigation of Phonons in Rhombohedral V
2
-V
3
Compounds—Bi
2
Te
3
,
Bi
2
Se
3
,Sb
2
Te
3
and Bi
2
(Te
1Àx
Se
x
)
3
(0 < x < 1), (Bi
1Ày
Sb
y
)
2
Te
3
(0 < y < 1),”
Phys. Status Solidi B, 84, pp. 619–628.
Fig. 6 Percentage of accumulative thermal conductivity (a)
with respect to phonon mean free path and (b) with respect to
phonon wavelength
Journal of Heat Transfer SEPTEMBER 2013, Vol. 135 / 091102-5
Downloaded From: on 08/02/2013 Terms of Use: />[10] Wolf, D., Keblin ski, P., Phillpot, S. R., and Eggebrecht, J., 1999, “Exact
Method for the Simulation of Coulombic Systems by Spherically Truncated,
Pairwise r
À1
Summation,” J. Chem. Phys., 110, pp. 8254–8282.
[11] McGaughey, A. J. H., and Jain, A., 2012, “Nanostructure Thermal Conductivity
Prediction by Monte Carlo Sampling of Phonon Free Paths,” Appl. Phys. Lett.,
100, p. 061911.
[12] Kaviany, M., 2008, Heat Transfer Physics, Vol. xxi, Cambridge University
Press, Cambridge, UK, p. 661.
[13] Gale, J. D., 1997, “
GULP: A Computer Program for the Symmetry-Adapted Sim-
ulation of Solids,” J. Chem. Soc., Faraday Trans., 93, pp. 629–637.
[14] McGaughey, A. J. H., and Kaviany, M., 2004, “Quantitative Validation of
the Boltzmann Transport Equation Phonon Thermal Conductivity Model Under
the Single-Mode Relaxation Time Approximation,” Phys. Rev. B, 69,
p. 094303.
[15] Turney, J., Landry, E., McGaughey, A., and Amon, C., 2009, “Predicting
Phonon Properties and Thermal Conductivity From Anharmonic Lattice
Dynamics Calculations and Molecular Dynamics Simulations,” Phys. Rev. B,
79, p. 064301.
[16] Ladd, A. J. C., and Moran, B., 1986, “Lattice Thermal Conductivity: A Com-
parison of Molecular Dynamics and Anharmonic Lattice Dynamics,” Phys.
Rev. B, 34, pp. 5058–5064.
[17] Larkin, J. M., Massicotte, A. D., Turney, J. E., McGauphey, A. J. H., and Amon,
C. H., “Comparison and Evaluation of Spectral Energy Methods for Predicting
Phonon Properties,” J. of Comp. and Theoretical Nano. (to be published).
[18] Klemens, P. G., 1951, “The Thermal Conductivity of Dielectric Solids at Low
Temperatures—Theoretical,” Proc. R. Soc. London, Ser. A, 208, pp. 108–133.
[19] Schelling, P. K., Phillpot, S. R., and Keblinski, P., 2002, “Comparison of
Atomic-Level Simulation Methods for Computing Thermal Conductivity,”
Phys. Rev. B , 65, p. 144306.
[20] Venkatasubramanian, R., 2000, “Lattice Thermal Conductivity Reduction and
Phonon Localizationlike Behavior in Superlattice Structures,” Phys. Rev. B, 61,
pp. 3091–3097.
[21] Borca-Tasciuc, D. A., Chen, G., Prieto, A., Martı´n-Gonza´lez, M. S., Stacy, A.,
Sands, T., Ryan, M. A., and Fleurial, J. P., 2004, “Thermal Properties of Elec-
trodeposited Bismuth Telluride Nanowires Embedded in Amorphous Alumina,”
Appl. Phys. Lett., 85, pp. 6001–6003.
[22] Mavrokefalos, A., Moore, A. L., Pettes, M. T., Li, S., Wang, W., and Li, X.,
2009, “Thermoelectric and Structural Characterizations of Individual Electrode-
posited Bismuth Telluride Nanowires,” J. Appl. Phys., 105, p. 104318.
[23] Qiu, B., Sun, L., and Ruan, X. L., 2011, “Lattice Thermal Conductivity Reduc-
tion in Bi
2
Te
3
Quantum Wires With Smooth and Rough Surfaces: A Molecular
Dynamics Study,” Phys. Rev. B, 83, p. 035312.
091102-6 / Vol. 135, SEPTEMBER 2013 Transactions of the ASME
Downloaded From: on 08/02/2013 Terms of Use: />