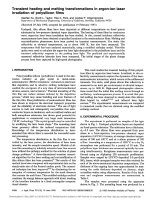
transient heating and melting transformations in argon ion laser irradiation of polysilicon films
Bạn đang xem bản rút gọn của tài liệu. Xem và tải ngay bản đầy đủ của tài liệu tại đây (981.4 KB, 9 trang )
Transient heating and melting transformations in argon-ion laser
irradiation of polysilicon films
Xianfan Xu, Scott L. Taylor, Hee K. Park, and Costas P. Grigoropoulos
Department of Mechanical Engineering, University of California, Berkeley, California 94720
(Received 29 July 1992; accepted for publication 19 February 1993)
Undoped, thin silicon films have been deposited at different temperatures on fused quartz
substrates by low-pressure chemical vapor deposition. The heating of these films by continuous
wave, argon-ion laser beam irradiation has been studied. In
situ,
normal incidence reflectivity
measurements have been obtained at specified locations in the semiconductor films. Melting and
recrystallization phenomena have been probed by transient measurements. The static film
reflectivity at elevated temperatures, up to about 1400 K, has also been measured. The
temperature field has been analyzed numerically, using a modified enthalpy model. Thin-film
optics were used to calculate the argon-ion laser light absorption in the polysilicon layer and the
transient reflectivity response to the probing laser light. The predicted and experimentally
measured reflectivity histories have been compared. The initial stages of the phase change
process have been captured by high-speed photography.
I. INTRODUCTION
Polycrystalline silicon ( polysilicon) is used in the elec-
tronics
industry
as gate
metal in
metal-oxide-
semiconductor ( MOS ) transistors. * Advances in electronic
film deposition and in selective etching techniques have
enabled the emergence of a new class of micromechanical
devices, sensors, and actuators2 Thermal annealing of the
thin film can reduce stresses induced by the deposition
process, 3 which may cause buckling and even fracture of
the thin film. Recrystallization of semiconductor films has
been shown to improve the electrical transport properties
and the reliability of electronic devices4 The use of light
sources to melt and subsequently recrystallize thin semi-
conductor layers on insulators, such as oxidized wafers and
bulk amorphous substrates, has shown good potential for
applications to commercial very large scale interaction
(VLSI) technology.5 The crystal growth may be controlled
by modifying the laser beam shape.6 The annealing laser
beam geometry affects the induced temperature field.
Knowledge of the temperature distribution in laser-
annealed thin silicon lilms is essential for successful mate-
rial processing.
The temperature distribution in the thin film is con-
trolled by the laser power, the distribution of laser beam
intensity, and the sample translation speed. Models of sil-
icon film annealing by infinitely extensive laser line sources
have utilized the enthalpy method for the solution of phase
change problems.7 A three-dimensional transient numeri-
cal algorithm for the laser melting and recrystallization of
thin silicon films has been presented.a The results of this
method have been compared with experimental data on the
steady-state size of the formed molten pools. The numeri-
cal technique has been improved’,” by eliminating the as-
sumption of constant temperature for the mesh elements
that contain the melt front. This modified enthalpy method
combines the energy balance approach with direct tracking
of the interface boundary in a fixed rectangular computa-
tional domain.
This work studies the transient heating of thin polysil-
icon lilms by argon-ion laser beams. Localized,
in situ
re-
flectivity measurements capture the dynamics of the laser-
semiconductor interaction, which occurs at the millisecond
timescale. The static, solid phase silicon film reliectivity is
measured in an inert gas environment at elevated temper-
atures, up to 1400 K. High-speed photographic observa-
tions reveal that the initial film melting occurs through an
oscillatory, nonhomogeneous process. It is noted that par-
tial melting has been observed in steady-state thin silicon
films heated by visible*“‘~r2 and infrared laser light
sources.r3 The experimental measurements are compared
to numerical results that are obtained using the modified
enthalpy method.
II. EXPERIMENTAL PROCE-DURE
The experiment is performed on samples of the type
shown in Fig. 1. Undoped polysilicon layers are deposited
on fused quartz substrates. The substrates have a thickness,
d,=O.5 mm. The silicon films were prepared from pure
silane in a front-injection, low-pressure chemical vapor
deposition (LPCVD) furnace, at average chamber temper-
atures of 580 and 630 “C and at a silane pressure of 300
mTorr. Annealing at a temperature of 1050 “C in a dry N,
atmosphere was performed for a period of 30 min. The
polysilicon layer thickness was measured optically by scan-
ning interferometry. Roughness measurements were per-
formed using an Alphastep 200 automatic profilometer.
Samples were capped by LPCVD deposited OS-pm-thick
SiO, layers, while uncapped samples were also retained for
each of the above-mentioned deposition temperatures. The
thickness of the capping layer was approximated by mea-
suring the oxide thickness deposited on dummy, single
crystalline wafers using ellipsometry. Results of the thick-
ness and roughness measurements are summarized in
Table I.
The samples were processed using the apparatus
shown in Fig. 2. The annealing beam was produced by a
8088
J. Appl. Phys. 73 (12), 15 June 1993
0021-8979/93/128088-09$06.00
@ 1993 American Institute of Physics
8088
Downloaded 13 Dec 2007 to 128.46.193.173. Redistribution subject to AIP license or copyright; see />radiation +
convection
transparent capping
thin silicon film
glass substrate
radiation +
annealing
convection
laser beam
FIG. 1. Structure of the sample used during these experiments.
continuous-wave (cw) argon-ion laser. The laser was used
as a single line source with a wavelength ;1= 5 14.5 nm. The
maximum power associated with this wavelength is about
2.5 W. The laser operates in the TEM, mode and the
output beam has a Gaussian intensity distribution. A
beamsplitter is used to provide a reference signal corre-
sponding to the annealing laser beam power. Measurement
of the reference signal shows that the beam is completely
unobstructed after about 0.2 ms. The laser is focused by a
spherical lens with a focal length of 7 cm. The annealing
laser power incident on the sample is calibrated to the
reference signal using a thermopile detector.
The l/e irradiance radius of the annealing beam was
measured after it passed through the spherical lens (Fig.
3). These measurements were obtained using a rotating
chopper technique. A Gaussian laser beam envelope, de-
fined by a minimum beam radius and a focal waist position
was fitted by a least-squares error minimization to the ex-
perimental data. The radius of the focal waist on the
Gaussian fit is 19.3 ,um. The experimentally measured min-
imum beam radius was 17.4 pm. Point by point compari-
son of experimental data showed a variation of *7%.
Normal incidence reflectivity measurements’4 are
made using the setup shown in Fig. 2. A HeNe laser is used
as the probing beam. This source emits at a wavelength
h=632.8 nm. The probing beam is focused on the sample
by a 30x microscope objective lens with a focal length of
6 mm. Using experimental techniques and Gaussian laser
beam theory, the l/e irradiance radius corresponding to
the focal waist was determined to be 4.3 pm. As a result,
TABLE I. Sample parameters.
Deposition temperature (“C)
580 630
uncapped
capped uncapped
capp~
Polysilicon
6190*74
6055h62 6208*50 5944h 59
thickness (6;)
Polysilicon 35
35 45
45
roughness (A)’
Capping layer
4894*326
4864*134
thickness (A)
‘rms roughness, on 50 pm scan lines.
FIG. 2. Schematic of the laser annealing apparatus.
the spatial resolution of the microprobe is about 9 pm. The
localized reflectivity measurement experiments were per-
formed with the sample placed at the focal waist of the
probing laser beam. The entire reflectivity microprobe can
be moved on a plane parallel to the sample by two piezo-
electric motors. The repeatable positioning accuracy of
these motors is 1 pm. Signals from the reflected light, de-
tector 2, and the annealing laser beam reference, detector
3, are measured by a digitizing oscilloscope. The probing
laser beam reference, detector 1, is measured using the
high-speed voltmeter accessory of a data acquisition con-
1001 I I
I
I I
o Experimental
-Gaussian Fit
0
I I ,
-12 -8 -4 0 4 8 12
Displacement from Focal Point (mm)
FIG. 3. Radius of the annealing laser beam as a function of the distance
from the focal waist.
8089
J. Appl. Phys., Vol. 73, No. 12, 15 June 1993
Xu et al.
8089
Downloaded 13 Dec 2007 to 128.46.193.173. Redistribution subject to AIP license or copyright; see />trol unit. The acquisition frequency for both devices is set
to 100 kHz. A computer controller uses internal triggering
commands and a two-channel function generator to simul-
taneously trigger the electronic shutter and the data acqui-
sition hardware. The accuracy of the reflectivity micro-
probe apparatus was checked by measuring the reflectivity
of oxidized crystalline silicon samples. These wafers were
well characterized by ellipsometry. The reflectivity of the
samples was measured by placing a HeNe laser head at a
distance of about 2 m from the sample. The HeNe laser
beam was incident on the sample at a small angle ( -0.50)
with respect to the normal to the sample surface. These
measurements and the reflectivity microprobe measure-
ments were in close agreement (absolute reflectivity devi-
ation within 0.005).
Thin-film optical theory is used to derive the optical
properties of the sample structure. The encapsulation layer
and the polysilicon film are sufficiently thin for wave optics
to be important. The substrate, however, has a large thick-
ness to wavelength ratio, dJA, so that light interference
effects in that region are smoothed out by variations of the
substrate thickness and flatness. Electromagnetic wave in-
terference must therefore be considered in the thin films,
while light reflection and transmission in the substrate can
be modeled using ray tracing. The following expressions
for reflectivity 5%‘: and transmissivity .F,’ are obtained for
a bare substrate, in the case of normal incidence:
.g+gJls+y-“;‘;” )
sl 32
In the above, sil is the reflectivity at the interface of the
media
i,j:
Yfj= l-LL%ijp
(2b)
for
i,
j = 1 (region above the top sample surface), 2 (region
below the bottom substrate surface), or s (substrate re-
gion). The superscript ( + ) indicates light incident onto
the top surface of the thin films. The refractive indices
nl =nZ= 1, while the substrate is transparent for the an-
nealing and probing laser light wavelengths, having a real
refractive index, n, .
The characteristic transmission matrix Ji (Refs. 15
and 16)) representing an absorbing thin layer of thickness
dj, and having a complex refractive index, fij is given by
(3)
In the above, /z is the laser light wavelength and
i
is the
imaginary unit.
The two-layer transmission matrix .&!f for light
ema-
nating from region 1 is
(lb)
-4ff=J,qXUfZ~i*
(4)
The reflection and transmission coefficients
r?
and
tF;)
are
2
f’-;=W;(1,1)+4(1,2)n,]+[4(2,1)+“4;(2,2)n,] *
The film reflectivity and transmissivity in terms of
rf+
and
t$ follow:
&fs’4l ff+ I 2-
(6b)
Let ssfl and Fs,,
be the two-film reflectivity and trans-
missivity, but for light propagating in the substrate-film-air
direction. Equations (la) and (lb) then yield the follow-
ing expressions for the structure total reflectivity and trans-
missivity:
g9+
82,Fl
fs-Kf
1
total=~lfr+ l-$Jf,.gJp, ’
(W
(74
(54
(5b)
71 f&2
r&al= 1 -gsflg2, *
Ub)
The annealing laser beam is incident on the bottom surface
of the substrate. The substrate reflectivity (9;) can be
calculated using ray tracing:
~is1~2rs2
K=%.sfl W 9 .
s2 sl
(8)
The total reflectivity is obtained by replacing B’S1 with
92
sfI,
which corresponds to light propagation in the
polysilicon/SiOZ structure:
SsfF23-a
~t&d=~23+
1-9 gJ
.
s2
sfl
(9)
8090 J. Appl. Phyi., Vol. 73, No. 12, 15 June 1993
Xu et al.
8090
Downloaded 13 Dec 2007 to 128.46.193.173. Redistribution subject to AIP license or copyright; see />0.80
0.70
CT
0.60
.& 0.50
>
‘.i=
ii 0.40
z 0.30
111 0.20
0.10
0.00
=-0.620
I
I
I
I
300 600 900 1200 1500 1800
Temperature, T (K)
FIG. 4. Calculated normal incidence reflectivity 97 of the &=062pm-
thick, uncapped sample, as a function of the silicon layer temperature for
the probing laser beam (/1=632.8 nm).
In the above, the superscript ( - ) indicates light incident
onto the bottom surface of the substrate. Experimental
data for the complex refractive index of solid, single crys-
talline silicon in the bulk form” were used in predictions of
the sample optical properties. The reflectivity as a function
of temperature for a 0.62~,um-thick, uncapped sample is
shown in Fig. 4. This figure also shows that the sample
reflectivity is very sensitive to variations of the silicon layer
thickness. Variations of the silicon layer thickness by f 60
A change the room temperature reflectivity by F lo%, and
produce a shift of the temperature for minimum reflectivity
by T 200 K. There is a discontinuous change in the optical
properties upon melting. The bulk liquid silicon complex
refractive index” is used to determine the optical proper-
ties of molten silicon. Reflectivity values of 0.57 and 0.75
are expected for the capped and uncapped thin silicon film
upon irradiation by the probing laser.
The apparatus for static, normal incidence reflectivity
measurements at high temperatures is shown in Fig. 5. The
sample is mounted on a graphite susceptor of 1 in. diam-
interference
Filter
Potartring
Beamsplltte
Quarter wave Plate
Chopper
Tilting Stage
I I
Thermocouples
FIG. 5. Schematic of the experimental apparatus for measurement of the
static normal incidence reflectivity at high temperatures.
TABLE II. Sample optical properties.
Deposition
temperature (“C) 4, (pm) 9 7 A
580, annealed 0.62 0.51 0.29 3.92 ti0.032
630, annealed 0.62 0.33 0.33 3.99+iD.o44
eter, heated by a computer-controlled induction heating
coil. The temperature of the stage is measured by a Pt-
30%Rh/Pt-6%Rh (B-type) thermocouple. The unifor-
mity of the sample temperature was verified by measuring
the temperature at different locations. The chamber is
evacuated to a pressure of low2 Torr and is backfilled with
argon gas. The reflectivity probe is a low-power ( 1 mW)
HeNe laser (2=632.8 nm). An optical chopper is used to
modulate the laser beam signal to a given frequency, thus
avoiding detection of the significant thermal emission from
the sample and the graphite susceptor. The detector 4 mea-
sures a reference signal that yield’s
the
instantaneous power
of the probing laser. The reflected beam is transmitted
through the polarizing beamsplitter to the silicon diode
detector 5. Red light interference filters at 632.8 nm are
used to block stray light to the detectors 4 and 5. The
signals of these two detectors yield the normal incidence
reflectivity of the sample, with proper account of the re-
flectivity by the chamber port fused silica window. The
HeNe laser spot area on the sample surface is about 1 mm
0.60 ,
I I I I
I I
I
0.50
CT 0.40
s
-5 0.30
5
z 0.20
cc
0.10 1 I I I I I , 1 I
0 12 3 4 5 6 7 8
0.60
I
I I
I
I I I
(b)
P,(W) -0.5
-4-1.0
*1.5
-2.0
0.30
0.20
'1
012'3 4 5 6 7 "_
Time, t (msec)
FIG. 6. Transient reflectivity responses of the d,=0.62+m-thick, un-
capped, annealed sample to irradiation by an argon-ion laser beam with
W=60 pm and different laser beam powers. ‘The polysilicon deposition
temperature is (a) 580 “C and (b) 630 “C!.
8091
J. Appt. Phys., Vol. 73, No. 12, 15 June 1993
Xu et al. 8091
Downloaded 13 Dec 2007 to 128.46.193.173. Redistribution subject to AIP license or copyright; see />0.70,
I
I I I
I
I
0.60
0.60
0.50
(4
PT (W) +0.5
*1 .o
*1.5
i
0.60
0.50
0.40
(b)
PT (W) e-o.5
a-l .o
*1.5
-2.0
0.30
0.20
0.10
0.00 1
1 ,
I , I 1
r I
0
12 3 4 5 6
7 8
Time, t (msec)
FIG. 7. Transient reflectivity responses of the &=0.60pm-thick,
FIG. 8. Experimentally measured (indicated by
m),
static reflectivities of
wwd, hap
~0.50 pm, annealed sample to irradiation by an argon-ion
uncapped samples deposited at (a) 580 “C and (b) 630 “C as functions of
laser beam with W=60 pm and different laser beam powers. The poly-
temperature vs predicted values (indicated by c) for a c&=0.62-pm-thick
silicon deposition temperature is (a) 580 ‘C and (b) 630 “C.
silicon layer.
in diameter, thus much larger than the 9-,um-diam spot
size of the reflectivity probe shown in Fig. 2. It is noted
that the transient heating experiments were conducted on
sample regions where the static reflectivity had been mea-
sured as discussed in this paragraph.
III. RESULTS
The complex refractive index of the silicon film was
obtained at room temperature, from reflectivity S? and
transmissivity Y measurement, using the optics model
mentioned in the preceding section, and an iterative ap-
proximating procedure. The effect of a native oxide layer of
thickness up to 50 %, on the film optical properties is neg-
ligible. The results are summarized in Table II. For com-
parison, it is recalled that the single crystalline silicon com-
plex refractive index at a wavelength A.=632.8 nm and at a
temperature T=300 K is fi,,=3.88+iO.O2. The measured
value of the as-deposited and annealed silicon film complex
refractive index is consistent with reported results.‘9-22
These investigations have shown that the complex refrac-
tive index is a strong function of the deposition conditions
and the post-processing annealing procedure. It is also
known that polysilicon films may be modeled as mixtures
of void fractions, amorphous and single crystalline compo-
nents using effective medium theory.23 The relative phase
weights vary with the deposition conditions.
-+-Calculated
O-Measured
0.60 0.60
0.50 0.50
0.40 0.40
0.30 0.30
0.20 0.20
0.10 0.10
-o-Calculated -o-Calculated
*Measured *Measured
Temperature (K)
Normal incidence reflectivity measurements have been
obtained with the optical microprobe placed at the center
of the annealing laser beam. Results are presented for
capped and uncapped films (Figs. 6 and 7 correspond-
ingly), deposited by LPCVD, at deposition temperatures
580 and 630 “C. These films are subjected to irradiation by
a laser beam with l/e irradiance radius W=60 pm and
total powers PT=0.5, 1.0, 1.5, and 2.0 W. Experimentally
0.75
~ 0.65
.I-
:? 0.55
z
p 0.45
aI
lx 0.35
0.25
’ a-B
P,(W)
e-O.50
-e-l .oo
*1.50
0.15 ’
I I
I
I I
I
I
0 1 2 3 4
5 6 7
Time (ms)
8
FIG. 9. Predicted transient reflectivity at the center of the heating laser
beam for uncapped samples of thickness
d,=O.62
pm.
8092
J. Appt. Phys., Vol. 73, No. 12, 15 June 1993
Xu
et al.
8092
Downloaded 13 Dec 2007 to 128.46.193.173. Redistribution subject to AIP license or copyright; see />0.60
s 0.50
>
P
‘S
g 0.40
G=
I? 0.30
0.20
0.10
0 2
Time4(ms)
6
8
FIG. 10. Predicted transient reflectivity at the center of the heating laser
beam for capped samples of thickness
d,=O.60
pm,
d,,,=O.50
pm.
measured, static, normal incidence reflectivities for both
capped and uncapped samples are given in Figs. 8(a) and
8 (b). Predicted film reflectivities based on the data for the
complex refractive index of bulk silicon” are also shown in
the same figure. It can be seen that the normal incidence
reflectivity for the 580 “C-deposited film approaches more
closely the crystalline silicon behavior. Examination of Fig.
6 versus Fig. 8 shows that the transient signals exhibit the
trends shown by the static measurement. Moreover, the
0.80
I I I I
I
2. 0.70
.Z
-2 0.60
0
g 0.50
liz
0.40
0.20
e-Numerical e-Numerical
*Experimental *Experimental
0
0.5 1 1.5 2 2.5 3
0.80
, I I I I I
.r” 0.70
>
2 0.80
;I:
a, 0.50
lx
*Experimental
0.20 IV
I
I
I I
0 4 8 12 16 20
Time (ms)
FIG. 11. Comparison between experimental and computed transient re-
flectivities for the uncapped,
d,=O.62
pm sample, irradiated by an argon-
ion laser beam with W=60 pm, Pr=2.0 W: (a) over 3 ms and (b) over
20 ms.
0.60
1-9
0.10 1 ’
I I
I I
I
0 0.5 1 1.5 2 2.5 3
0.60 1 _I*,
+ J-+ j
.g
0.50
>
z
a,
0.40
rt
:
0.30
-Numerical
-EI-Experimental
0.10 1’
I
I
I I
I
0 4 8 12 16 20
Time (ms)
FIG. 12. Comparison between experimental and computed transient re-
flectivities for the capped,
d,=O.60
pm,
d,,,=O.50
pm sample, heated by
an argon-ion laser beam with
W=60
pm, Pr=2.0 W: (a) over 3 ms and
(b) over 20 ms.
correspondence of the room-temperature reflectivity, the
minimum reflectivity, and the value of the high-
temperature reflectivity plateau is reasonable.
The heat transfer in the silicon film during the irradi-
ation by the laser beam is calculated using a modified en-
thalpy model. 10*24 The predicted transient reflectivity re-
sponses at the center of the annealing laser beam for the
laser beam parameters of Figs. 6 and 7 for uncapped and
capped samples are shown in Figs. 9 and 10, respectively.
Phase change for IV=60 pm is experimentally observed
for a laser beam power PT=2.0 W. The comparison be-
tween the experimental and computed reflectivities for un-
capped and capped samples is shown in Figs. 11 and 12.
On the experimental signal, the transition to melting is not
marked by a sharp increase to the liquid silicon value. A
positive slope of the reflectivity signal with time is ex-
pected, due to the finite size of the probing laser beam, but
the observed oscillatory trend of the reflectivity signal is a
new finding.
Samples of 0.5 pm thickness were also tested. Figure
13 shows the measured static, temperature-dependent re-
flectivity for capped polysilicon samples, with d,=O.5 ,um,
d,,,=O.5 ,um. Comparisons of the experimental and com-
putational results for this type of film, using laser process-
ing parameters of IV=60 ,um and PT=1.8 W and 1.4 W
are shown in Figs. 14 and 15, respectively. The change in
the behavior of the experimental signal at about 2.0 ms
matches with the predicted onset of melting. This sample,
8093
J. Appl. Phys., Vol. 73, No. 12, 15 June 1993
Xu
et al. 8093
Downloaded 13 Dec 2007 to 128.46.193.173. Redistribution subject to AIP license or copyright; see />.= r 0.30
a,
G=
0.30
‘i;
g
d
0.20
c
0.20
+Numerical
t2 0.10
0.10
Temperature (K)
0.60
FIG. 13. Experimentally measured temperature dependence of the static
t;
al 0.40
reflectivity of the capped, d,=O.50 pm, &,=0.50 pm, polysilicon sam-
ple.
Z
al
c 0.30
like all the others tested, showed transition to melting
through a periodic process.
The observed oscillatory trend of the reflectivity signal
when change of phase occurs is very interesting. The tem-
poral width of the successive reflectivity peaks increases
progressively with time, till a steady reflectivity value is
established. The oscillatory behavior occurs on the milli-
0.60
I I
,, ,
i
go.50
>
-z
Q) 0.40
z
2 0.30
0.20
-o-Numerical
-Experimental -
0.10 1 I I I ,
I
0 1 2
3 4
5
o.60 I
h 0.50
C
.>
‘;;
aI 0.40
z
0
= 0.30
0
5
10
15 20
Time (msec)
FIG. 14. Comparison between experimental and computed transient re-
Aectivities for a capped, d,=O.50 pm, d,,,=O.50 pm sample, heated by an
argon-ion laser beam with
W=60pm, P,=
1.8 W: (a) over 5 ms and (b)
over 20 ms.
0
4
8
12
16 20
Time (msec)
FIG. 15. Comparison between experimental and computed transient re-
flectivities for the capped, t&=0.50 pm, d,,=O.50 pm sample, heated by
an argon-ion laser beam with
W=60
pm,
P,=
1.4 W: (a) over 5 ms and
(b) over 20 ms.
second timescale, and is more pronounced and persisting
for lower powers. Figure 16 shows a sequence of high-
speed microscopy photographs of the melting process, for
P,= 1.8 W, W=60 ,um, corresponding to the reflectivity
curve of Fig. 14. The solid-state camera recorded the visi-
ble thermal radiation emitted from the samples, with the
acquisition speed set at 1 frame/ms. Solid silicon at tem-
peratures close to the melting temperature has a higher
emissivity than liquid silicon. Thus, bright regions in the
heated spot represent solid silicon, while darker regions
correspond to molten material. The photographs initially
show a ring of molten material (t=2 ms), which appears
to grow in area (t= 6 ms) . At t= 8 ms, a substantial part of
the heated zone returns to the solid phase, then remelts at
t= 14 ms. The partial melting/recrystallization cycle is re-
peated, yielding an increased solid phase fraction at t= 18
ms. The same trend but with a smaller heat affected zone
was observed for a laser power PT= 1.4 W (Fig. 17), cor-
responding to the transient reflectivity measurement shown
in Fig. 15. The transient melting in all the uncapped and
capped samples examined in this work exhibited the
same
characteristic trends.
Dark spots of approximately 5-10 pm size are ob-
served near the center of the heated area. Post-processing
microscopy examination using reflected light confirmed
that these
spots
correspond to voids formed in the transient
8094
J. Appl. Phys., Vol. 73, No. 12, 15 June 1993
Xu
et al. 8094
Downloaded 13 Dec 2007 to 128.46.193.173. Redistribution subject to AIP license or copyright; see />t = 2 msec
t = 4 msec
t = 6 msec
t = 8 msec
t = 10 msec
t = 12 msec
t = 14 msec
t = 16 msec
t = 18 msec
FIG. 16. Sequence of photographs showing the initiation of the phase
change process in a capped, &=0.5 pm, d,,s=O.5 pm, sample. The
sample is irradiated by an argon-ion laser beam with W=60 pm and
PT= 1.8 W. Each frame shows a region of approximately 160x 160 pm’.
melting process. Such defects have been observed25 in the
“explosive” melting and recrystallization of Si films on pat-
terned SiO, using lamp sources. These defects have been
attributed’” to mass transfer in the molten zone, combined
with the sudden volumetric contraction of Si upon melting
(-S%), and possibly to the mechanical deformation of
the capping layer under the ambient pressure. Surface ten-
sion forces in the composite structure of the molten silicon-
solid silicon-capping layer-substrate are enhanced because
of the thinness of the silicon film, and may also be impor-
tant in the transient melting process.
IV. CONCLUSIONS
The transient response of thin silicon films during
argon-ion laser annealing has been studied. A technique for
acquiring localized,
in situ
reflectivity measurements was
presented. The spatial resolution achieved is determined by
the spot size of the probing HeNe laser beam, and is about
9 pm. Experimentally measured transient surface reflectiv-
ities followed the trends obtained by static reflectivity mea-
surements at high temperatures while the material re-
mained in the solid phase. Depending upon the deposition
conditions, the optical properties of the thin films may
exhibit large deviations from the bulk, single crystalline
values. Surface reflectivity measurements were also com-
pared to numerical predictions. The acquired reflectivity
signals at the beginning of the phase change process in both
capped and uncapped samples exhibit an oscillatory behav-
t = 8 msec t = 10 msec
t = 12 msec
t = 14 msec t = 16 msec
t = 18 msec
FIG. 17. Sequence of photographs showing the initiation of the phase
change process in a &=0.5-pm-thick, capped sample. The sample is
heated by an argon-ion laser beam with W=60 pm and PT= 1.4 W. Each
frame shows a region of approximately 160X 160 pm*.
ior at the millisecond timescale. High-speed photography
experiments confirmed the nonhomogeneous periodic na-
ture of the melting process. Recent work*’ includes the
detailed experimental investigation of radiative properties
of thin semiconductor films at high temperatures.
ACKNOWLEDGMENT
Support to this work by the National Science Founda-
tion, under Grant CTS-9096253, is gratefully acknowl-
edged.
‘T. I. gamins, Polycrystalline Silicon for Integrated Circuit Applications
(Kluwer Academic, Boston, 1988).
‘R. T. Howe, in Micromachining and Micropackaging of Transducers,
edited by C. D. Fung, P. W. Cheung, W. H. Ko, and D. G. Fleming
(Elsevier, Amsterdam, 1985), p. 169.
‘R. T. Howe and R. S. Muller, J. Appl. Phys. 54, 4674 (1983).
4G. K. Celler, J. Cryst. Growth 63, 429 (1983).
‘B. Y. Tsaur, in Proceedings of Materials Research Society, edited by A.
Chiang, M. W. Geis, and L. Pfeiffer (MRS, Pittsburgh, PA, 1986), Vol.
53, p. 365.
“S. Kawamura, J. Sakurai, M. Nakano, and M. Takagi, Appl. Phys. Lett.
40, 394 (1982).
‘K. Kubota, C. E. Hunt, and J. Frey, Appl. Phys. Lett. 46, 1153 (1985).
‘C. P. Grigoropoulos, W. E. Dutcher, and A. F. Emery, J. Heat Transfer
113, 21
(1991).
9A. A. Rostami and C. P. Grigoropoulos, Proceedings
of
the 1991 ASME
Winter Annual Meeting (ASME, New York, 1991), Vol. HTD-184, p.
53.
“C
P Grigoropoulos, X. Xu, S. L. Taylor, and H. K. Park, in Proceed- . .
ings
of
Materials Research Society, edited by G. S. Was, L. E. Rehn, and
D. M. Follstaedt (MRS, Pittsburgh, PA, 1992), Vol. 235, p. 95.
8095
J. Appl. Phys., Vol. 73, No. 12, 15 June 1993
Xu
et al.
8095
Downloaded 13 Dec 2007 to 128.46.193.173. Redistribution subject to AIP license or copyright; see />“M. A. Bosch and R. A. Lemons, Phys. Rev. L&t. 47, 1151 (1981).
12R. A. Lemons and M. A. Bosch, Appl. Phys. Lett. 40, 703 (1982).
13R. J. Nemanich, D. K. Biegelsen, and W. G. Hawkins, Phys. Rev. B 27,
7817 (1983).
“C. P. Grigoropoulos, W. E. Dutcher, and K. E. Barclay, J. Heat Trans-
fer 113,657 (1991).
“M. Born and E. Wolf, Principles
of
Optics, 6th ed. (Pergamon, United
Kingdom, 1980), pp. 55,.611.
“Z. Knittl, Optics of Thin Fihns (Wiley, Prague, Czechoslovakia, 1976),
p. 240.
“G. E. Jellison, Jr. and H. H. Burke, J. Appl. Phys. 60, 841 (1986).
‘sK. M. Shvarev, B. A. Baum, and P. V. Gel’d, Sov. Phys. Solid State 16,
2111 (1975).
19S. Chandrasekhar, A. S. Vengurlekar, V. T. Karulkar, and S. K. Roy,
Thin Solid Films 169, 205 (1989).
8096
J. Appl. Phys., Vol. 73, No. 12, 15 June 1993
“T. I. Kamins, J. Electrochem. Sot. 127, 686 (1980).
21G. Harbeke, L. Krausbauer, E. F. Steigmeier, A. E. Widmer, H. F.
Kappert, and G. Neugebauer, J. Electrochem. Sot. 131, 675 (1984).
**E. A. Irene and D. W. Dong, J. Electrochem. Sot. 129, 1347 (1982).
*‘B. G. Bagley, D. E. Aspnes, A. C. Adams, and C. J. Mogab, Appl.
Phys. Lett. 38, 56 (1981).
24C. P. Grigoropoulos, A. A. Rostami, X. Xu, S. L. Taylor, and H. K.
Park, Int. J. Heat Mass Transfer 36, 1219 (1993).
*5D. Dutartre, Appl. Phys. Lett. 48, 350 (1986).
26D. Dutartre, in Proceedings
of
Materials Research Society, edited by J.
C. Strum, C. K. Chen, L. Pfeitfer, and P. L. F. Hemment (MRS,
Pittsburgh, 1988), Vol. 107, p. 157.
*’ X. Xu and C. P. Grigoropoulos (unpublished).
Xu et al.
8096
Downloaded 13 Dec 2007 to 128.46.193.173. Redistribution subject to AIP license or copyright; see />