jhttransport phenomena and droplet formation during pulsed laser interaction with thin films
Bạn đang xem bản rút gọn của tài liệu. Xem và tải ngay bản đầy đủ của tài liệu tại đây (730.98 KB, 8 trang )
D. A. Willis
X. Xu
1
e-mail:
School of Mechanical Engineering,
Purdue University,
West Lafayette, IN 47907
Transport Phenomena and Droplet
Formation During Pulsed Laser
Interaction With Thin Films
This work investigates transport phenomena and mechanisms of droplet formation during
a pulsed laser interaction with thin films. The surface of the target material is altered
through material flow in the molten phase induced by a tightly focused laser energy flux.
Such a process is useful for developing a laser-based micromachining technique. Experi-
mental and numerical investigations of the laser-induced fluid flow and topography varia-
tions are carried out for a better understanding of the physical phenomena involved in the
process. As with many machining techniques, debris is often generated during laser-
material interaction. Experimental parametric studies are carried out to correlate the
laser parameters with the topography and droplet formations. It is found that a narrow
range of operation parameters and target conditions exists for ‘‘clean’’ structures to be
fabricated. The stop action photography technique is employed to capture the surface
topography variation and the melting development with a nanosecond time resolution and
a micrometer spatial resolution. Numerical simulations of the laser-induced surface de-
formation are also performed to obtain the transient field variables and to track the
deforming surface. The comparison between the numerical and experimental work shows
that, within the energy intensity range investigated in this work, the surface deformation
and droplet formation are attributed to the surface-tension-driven flow, and the recoil
pressure effect plays an insignificant role in the surface topography development.
͓S0022-1481͑00͒02903-0͔
Keywords: Heat Transfer, Instability, Laser, Surface Tension, Visualization
1 Introduction
Droplet formation is a common problem in laser machining.
Many studies have attributed droplet formation to fluid flow insta-
bilities that develop from disturbances in the molten surface of the
target ͓͑1͔͒. These disturbances lead to a wavy surface due to
thermocapillary effects, which grow into surface structures due to
the capillary wave instability. Droplets may then form from the
capillary wave instability itself, or due to other instability mecha-
nisms. The initial temperature disturbances can be attributed to a
number of factors, including laser spatial intensity distributions
that oscillate over time, as is the case with non-Gaussian laser
beams, or a surface roughness that may cause nonuniform absorp-
tion of the incident laser beam.
The purpose of this work is to study the transport phenomena
and droplet formation in a pulsed laser thin film interaction. Little
work has been done on analyzing droplet formation arising from
the use of lasers with Gaussian intensity distribution where the
fluid flow is dominated in the radial direction. Because of the
intensity distribution of the Gaussian laser beams, it is doubtful
that capillary wave instabilities are contributing factors to droplet
formation. Balandin et al. ͓2͔ studied the flow of iron containing
surface active impurities irradiated by a nanosecond pulsed laser.
No discussion of droplet formation was included. Dimitrov ͓3͔
observed droplets in his study but gave no explanations or theories
to the droplet mechanisms either. Bennett et al. ͓4͔ used a finite
element method to study the fluid flow and heat transfer in a
nanosecond pulsed laser texturing process of magnetic disk sub-
strates. Fluid flow was attributed to both thermocapillary and
chemicapillary forces. The chemicapillary forces resulted from
mass diffusion of phosphorous due to a concentration gradient
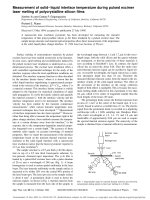
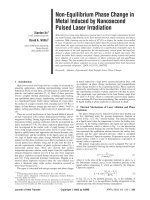
caused by depletion of phosphorous at the free surface. Willis
et al. ͓5͔ performed a parametric study which demonstrated that
for a narrow range of laser pulse energy, holes could be formed
due to the flow in the radial direction as shown in Fig. 1, with no
debris found in the surrounding area. However, above this
narrow energy range, the strong radial flow could lead to droplet
formation.
In a pulsed laser micromachining process, flow acceleration is
high. Common instability mechanisms such as Rayleigh-Taylor or
Kelvin-Helmholtz can occur. The Rayleigh-Taylor instability oc-
curs when two superposed fluids of different densities are accel-
erated toward each other. If the density of the overlying fluid is
less than the underlying fluid, the motion will be unstable for
disturbance wavelengths greater than the critical wavelength, ⌳
c
,
which is calculated by ͓͑6͔͒:
⌳
c
ϭ 2
ͩ
␥
g
͑
1
Ϫ
2
͒
ͪ
1/2
(1)
1
To whom correspondence should be addressed.
Contributed by the Heat Transfer Division for publication in the J
OURNAL OF
HEAT TRANSFER. Manuscript received by the Heat Transfer Division, Aug. 16,
1999; revision received, Apr. 19, 2000. Associate Technical Editor: A. Majumdar.
Fig. 1 Laser-induced phase change and Marangoni flow
Copyright © 2000 by ASMEJournal of Heat Transfer NOVEMBER 2000, Vol. 122 Õ 763
where
1
is the density of the underlying fluid,
2
is the density of
the overlying fluid,
␥
is the surface tension, and g is the accelera-
tion of gravity.
The Kelvin-Helmholtz instability can occur at the interface of
two fluids of different density in relative horizontal motion. Flows
will be stable for relative velocities given by the criteria
͑v
1
Ϫ
v
2
͒
2
Ͻ
2
͑
1
ϩ
2
͒
͕
␥
g
͑
1
Ϫ
2
͒
͖
1/2
1
2
. (2)
The critical wavelength above which instability can develop for
the Kelvin-Helmholtz instability is also given by Eq. ͑1͒. It should
be noted that Eqs. ͑1͒–͑2͒ are approximations developed for in-
viscid, two-dimensional flows. In reality, flow instabilities will be
three dimensional in nature, possibly due to nonuniform heating
by the laser, which will lead to nonuniform velocity, density, and
recoil pressure distributions.
In the pulsed laser-induced fluid flow, the gravitational force is
small compared to the acceleration forces that result from the
large surface tension gradient at the molten surface. The gravita-
tional term in the above equations therefore should be replaced
with a flow acceleration term in a flow stability analysis.
In this work, the possible mechanisms of droplet formation dur-
ing pulsed laser interaction with thin chromium films are investi-
gated. An in situ photography technique with a nanosecond time
resolution is employed. This experiment shows the transient to-
pography changes of a thin chromium film irradiated by a pulsed
Nd:YLF laser with a 20-nsec pulse width. A numerical code is
used to calculate the transient velocity and temperature fields and
free surface motion. Results of experimental and numerical work
are used to analyze the possible mechanisms of droplet formation.
2 Experimental Study
A parametric study ͓͑5͔͒ was performed on laser machining of
thin chromium films deposited on glass substrates. Topography
changes and debris formation patterns induced by a pulsed
Nd:YLF laser were investigated. A narrow range of energy den-
sity levels was found in which debris-free surface structures could
be obtained. This energy range lies between a threshold for hole
formation at low energy, and a threshold for droplet formation. At
low pulse energy, above the threshold for hole formation, the
pulse energy is large enough that surface-tension gradients induce
hole opening. As pulse energy increases, radial flow becomes
rapid enough that inertial effects dominate and cause droplets to
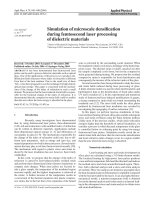
separate from the molten pool. A summary of the resulting topog-
raphy changes and droplet formations resulting from 20-nsec
pulses focused to a 9.5-
m radius is shown in the microphoto-
graphs in Fig. 2. A debris-free 7.5-
m diameter hole created in
the chromium film by a 0.95-
J pulse is shown in Fig. 2͑a͒.
Increasing pulse energy to 1.6
J resulted in a 10-
m hole diam-
eter and formation of droplets. At this energy level the holes are
still relatively clean since few droplets are formed; however, in-
creasing the energy further increases the number of droplets. This
is seen in Fig. 2͑c͒ for an 11-
m hole created by a 2.0-
J laser
pulse. Figure 2͑d͒ again shows an increased number of droplets
for a 13-
m hole resulting from a 2.7-
J pulse. This pattern con-
tinues as energy increases, and the droplets become uniformly
dispersed around the outer edge of the hole, as seen in Fig. 2͑e͒
for a 15-
m hole created by a 3.6-
J pulse. Atomic Force Mi-
croscopy verified that the surface deformations seen in Fig. 2 are
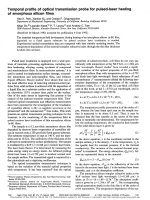
holes. The holes created by 0.9 and 2.1-
J pulses are shown in
Fig. 3. The 0.9-
J pulse energy is just above the threshold for
hole formation, and the resulting hole is asymmetric. However,
the hole does show that material is displaced to the outer edge of
the hole and built up around the edges due to the surface-tension-
driven flow as illustrated in Fig. 1. The 2.1-
J pulse energy shows
a similar pattern with improved symmetry. Power densities in this
study are on the order of 62 MW/cm
2
for the highest energy used.
No plasma is formed at the highest laser power density.
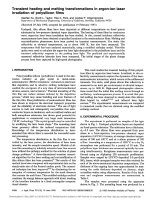
An in situ photography technique, the stop action photography,
is developed to capture the transient melting and fluid flow pro-
cesses ͓͑5͔͒. The experimental diagram is shown in Fig. 4. A
pulsed nitrogen laser pumped dye laser with a visible wavelength
of 600 nm and pulse width of 2.5 nsec was used to illuminate the
surface of the specimen. The dye laser illuminates the specimen
through a long working distance microscope objective system,
which magnifies the specimen surface by 400x. Both the dye laser
and the Nd:YLF laser are triggered by a pulse-delay generator.
The delay between the two laser pulses is controlled by the pulse-
delay generator, such that the dye laser is triggered after the
Nd:YLF laser and exposes the film at the desired time. A 35-mm
camera captures the illumination of the dye laser and stops the
motion of the fluid on film. A 600-nm filter with a 40-nm band-
width is placed in front of the camera to remove any light from
sources other that the nitrogen laser pumped dye laser. This elimi-
Fig. 2 Results of experimental parametric study for 0.3
m chromium film on
quartz substrate
Fig. 3 AFM results: „
a
… 0.9
J pulse. Vertical scale is 0.4
mÕ
div., horizontal scale is 0.86
mÕdiv. „
b
… 2.1
J pulse. Vertical
scale is 0.3
mÕdiv., horizontal scale is 1.1
mÕdiv.
764 Õ Vol. 122, NOVEMBER 2000 Transactions of the ASME
nates infrared light from the Nd:YLF laser that is reflected from
the specimen surface, and thermal emission from the specimen
surface and hot vapor. Only one photograph can be taken of each
hole resulting from a laser pulse, therefore many photographs
were taken at each pulse energy level and trigger delay setting.
The experiments were repeatable, and the photos shown are rep-
resentative of the results of several experiments at each delay
time. The actual delay is measured by two fast photodiodes, and
corrections are made for differences in optical path lengths and
times for signals to reach the oscilloscope through cables. The
measured delay is between laser peaks by approximating temporal
distributions of the lasers as triangles. Two photographs are taken
of each hole, one in situ, and the other several seconds after the
laser pulse has ended ͑ϱ͒. Comparison of the two photographs
allows the determination of the time at which changes in the hole
geometry have ended. The 35-mm camera views an area of ap-
proximately 250ϫ 250
m, which limits the resolution of the op-
tical system since only a small area of approximately 60
ϫ 60
m is of interest in experiment. Only enlargements of the
area of interest are presented.
The stop action photography is performed for 20-nsec full-
width half-maximum ͑FWHM͒ laser pulses incident on 0.3-
m
chromium films deposited by DC sputtering in ultrahigh vacuum.
The focused laser radius is again 9.5
m. The parametric study
͑Fig. 2͒ showed that randomly dispersed droplets were created
around the outer edge of the hole for the 1.6, 2.0, and 2.7-
J
pulses, with the number of droplets increasing with pulse energy.
The 3.6-
J pulse increased the number of droplets and scattered
them further away from the edge of the hole as seen in Fig. 2͑e͒.
The in situ photographs for a 2.0-
J experiment are shown in Fig.
5. Surface deformation within the laser-irradiated zone is seen at
11 nsec. The deformed region within the laser-irradiated zone
undergoes a rapid change between 17 and 34 nsec as shown in
Figs. 5(b –d). There is also a central region which has a higher
reflectivity than the rest of the deformed area, Figs. 5(d – j). This
central region decreases in brightness with time until it is not
visible in the 150-nsec photo in Fig. 5͑k͒. The explanation for the
high reflectivity spot is that the surface tension gradient is lower
near the center of the laser-irradiated zone than it is near the outer
edge of the laser-irradiated zone. Therefore, the center area of the
irradiated zone does not begin to flow as early as the outer region.
As time progresses, the flow pulls the chromium away from the
center of the molten pool, leaving only glass in the center and thus
decreasing the reflectivity. After 249 nsec no changes are seen in
the surface geometry, indicating that the surface deformation pro-
cess is complete. The final hole diameter is approximately 11
m.
Note that the photographs taken by the stop action photography
͑Fig. 5͒ have slightly poorer spatial resolution than those taken
under an optical microscope after the process is complete ͑Fig. 2͒.
Individual droplets are not clearly seen in Fig. 5.
Photographs of the transient surface topography resulting from
2.7-
J laser pulses are shown in Fig. 6. Surface deformation is
visible at 14 nsec and the hole size increases little after this time.
Similar to the 2.0-
J experiment, a central high reflectivity spot
appears within the laser-irradiated zone that dissipates in bright-
ness with time. The modified area becomes distorted at the outer
edge between 98 and 184 nsec. This is the unstable fluid flow
leading to the formation and separation of droplets. This distortion
is due to scattering of light by droplets in all directions, making
less light incident on and reflected off the target. This results in a
blurring effect, making the holes appear larger, thus the final holes
are smaller when compared to those in the intermediate times.
Thermal lensing may also contribute to this blurring, but it only
affects the very vicinity of the hole since the heat-affected zone,
on the order of 1 micron, is much smaller than the blurred area.
Individual droplets become visible in the photograph at 184 nsec.
After 283 nsec no changes are seen in the hole diameter or droplet
patterns surrounding the hole, indicating that the surface modifi-
cation process is complete. The final hole diameter is approxi-
mately 13
m.
Photographs of the transient surface topography induced by
3.6-
J laser pulses are shown in Fig. 7. Surface deformation is
seen at 14 nsec followed by expansion of the deformed area until
25 nsec. A central high reflectivity spot, similar to those seen in
Fig. 4 Experimental diagram of stop-action photography
Fig. 5 Transient micrographs of 0.3-
m chromium film irradi-
ated by 2.0-
J 20-nsec laser pulses. Indicated time is with re-
spect to the beginning of the laser pulse at
t
Ä0.
Fig. 6 Transient micrographs of 0.3-
m chromium film irradi-
ated by 2.7-
J 20-nsec laser pulses. Indicated time is with re-
spect to the beginning of the laser pulse at
t
Ä0.
Journal of Heat Transfer NOVEMBER 2000, Vol. 122 Õ 765
Figs. 5–6, is also seen in the photographs at 3.6
J, but this bright
spot diminishes after 50 nsec. Similar to the previous experiments,
the outer edge becomes distorted from 64 to 152 nsec due to the
separation of droplets from the edge of the hole. Changes in the
surface topography continue much longer in this experiment, and
droplets are not seen until 281 nsec, as seen in Fig. 7͑o͒. The flow
has ceased at 429 nsec since no changes in the surface topography
are seen after this time. The final hole diameter is approximately
15
m.
The three in situ experiments presented here all indicate melt-
ing within the first 20 nsec of the laser pulse, with rapid hole
expansion while the laser pulse is incident on the surface. Fluid
flow is observed long after the laser pulse is completed at 40 nsec
and lasts for over 250 nsec. Solidification time increases with
increasing pulse energy, ranging from approximately 249 nsec for
a 2.0-
J pulse, to about 429 nsec for a 3.6-
J pulse. The experi-
ments show rapid flow development and droplet formation after
the end of the laser pulse. The flow lasts longer with increasing
pulse energy.
3 Numerical Modeling
A numerical model of the pulsed laser surface modification
process is developed. The energy transfer and fluid flow induced
by the laser irradiation are governed by the mass, momentum, and
energy conservation equations
ٌ•vϭ 0 (3)
ץ
v
ץ
t
ϩ
͑
v•ٌ
͒
vϭϪٌpϩ ٌ
͑
ٌ•v
͒
(4)
ץ
h
ץ
t
ϩ
͑
v•ٌh
͒
ϭ ٌ•
ͩ
k
c
p
ٌh
ͪ
ϩ Q (5)
In these equations, v is the velocity vector, p the pressure, and h
the enthalpy. The thermophysical properties
,
, k, and c
p
are,
respectively, the density, viscosity, thermal conductivity, and spe-
cific heat. The enthalpy method ͓͑7͔͒ is employed in the energy
equation, Eq. ͑5͒, to calculate the solid-liquid phase change. Phase
transition in the glass substrate is neglected, and flow of the soft-
ened glass is neglected due to its high viscosity. The volumetric
heating term Q is used to describe the nonuniform absorption of
the laser energy in the target, since the laser energy is absorbed
exponentially along the optical axis, and is Gaussian in distribu-
tion along the radius of the laser beam. The absorption of laser
energy is modeled as instantaneous heating with a triangular tem-
poral distribution of 20 nsec ͑FWHM͒. Therefore, the entire
length of the laser pulse is 40 nsec. The absorbed laser energy is
estimated by calculating the reflectivity of chromium at the laser
wavelength, which is calculated from the complex index of refrac-
tion of chromium to be 63 percent.
At the surface of the laser melted region, fluid flow is induced
due to the tangential forces of the surface tension gradient created
by the temperature gradient along the free surface. Therefore, the
boundary condition at the free surface in the tangential direction is
expressed as
t•
ϭ t•ٌ
␥
ϩ
͑
t•ٌT
͒
ץ
␥
ץ
T
ϭ
n•ٌ
͑
v•t
͒
(6)
The boundary condition normal to the free surface is the balance
between the normal component of the surface traction vector and
the surface tension forces due to the curved free surface and the
pressure
n•
ϭϪ
␥
R
c
Ϫ p
r
(7)
where R
c
is the radius of curvature, p
r
is the recoil pressure, and
␥
is the surface tension. The equation that governs variations of
the free surface with time is given by
ץ
⌺
ץ
t
ϩ v•ٌ⌺ϭ 0 (8)
where ⌺ is the free surface geometry.
At the free surface, the recoil pressure is related to surface
temperature by the kinetic theory ͓͑8͔͒ as
p
r
ϭ p
o
exp
ͭ
⌬H
l
v
͑
TϪ T
l
v
͒
RTT
l
v
ͮ
(9)
The molar mass flux, j
¯
v
due to evaporating atoms at the free
surface is given by ͓͑8͔͒
j
¯
v
ϭ Ap
r
͑
2
MRT
͒
Ϫ 1/2
(10)
and this molar mass flux is related to the thermal boundary con-
dition at the evaporating surface as
k
l
ٌTϭϪ⌬H
l
v
j
¯
v
. (11)
Equations ͑9͒–͑11͒ are used as boundary conditions for the energy
equation. p
o
is the atmospheric pressure, ⌬H
l
v
is the enthalpy of
vaporization, T
l
v
is the equilibrium boiling temperature, T is the
Fig. 7 Transient micrographs of 0.3-
m chromium film irradiated by 3.6-
J
20-nsec laser pulse. Indicated time is with respect to the beginning of the laser
pulse at
t
Ä0.
766 Õ Vol. 122, NOVEMBER 2000 Transactions of the ASME
surface temperature, and R is the universal gas constant. In Eq.
͑10͒, A is a ‘‘sticking coefficient,’’ which is the fraction of vapor
particles hitting the surface that stick to it. For metals, the value of
A is approximately unity ͓͑8͔͒.
Boundary conditions at the far field are given by
vϭ 0 (12)
ٌTϭ 0. (13)
A no-slip boundary condition is used at the chromium/glass inter-
face, because the dynamics of three-phase interface is not well
known and thus not considered in this work. Numerical calcula-
tions are carried out using the computational fluid dynamics code,
FIDAP ͑Fluent Inc., Lebanon, NH͒. The system is modeled as
two-dimensional axisymmetric due to the symmetry of the inci-
dent laser beam. Thermophysical properties used in the simula-
tions are listed in Table 1. Whenever possible, temperature-
dependent material properties are used. The temperature
dependence of viscosity is modeled as an Arrenhius relationship
given by ͓͑9,10͔͒
ϭ
o
exp
͑
E/RT
͒
(14)
where
o
is a reference viscosity which is normalized such that
Eq. ͑14͒ results in the viscosity at the melting temperature given
in Table 1 when the melting temperature is used in Eq. ͑14͒. E is
the activation energy and is estimated by ͓͑9͔͒
Eϭ 0.431T
m
1.348
(15)
The surface tension data are for pure chromium obtained from
Brandes and Brook ͓10͔. The original values are from Allen
͓͑11,12͔͒ which were measured at the melting temperature ͓͑11͔͒
and calculated for higher temperatures ͓͑12͔͒. The surface tension
of metals that have been exposed to atmospheric conditions will
have chemically active surface impurities such as oxygen and sul-
fur. It has been reported that these surface active impurities will
alter the surface tension significantly, such that the surface tension
can actually increase at temperatures slightly above the melting
temperature ͓͑13–15͔͒. Bostanjoglo and Nink ͓16͔ and Balandin
et al. ͓2͔ reported that the effect of an increased surface tension
above the melting point in metals during laser melting of thin
films could cause thickening of the thin film at the center of the
laser spot. Therefore, the effect of oxidation could be significant.
Fig. 8 Calculated transient velocity field of a 0.3-
m chromium film irradi-
ated by a 2.0-
J, 20-nsec laser pulse
Table 1 Thermophysical properties of chromium „†10,18–22‡…
Melt Temperature 2133 K Enthalpy of Fusion 16.933 kJ/mol
Equilibrium Boiling Temperature 2953 K Enthalpy of
Vaporization
344.3
Refractive Index @ ϭ 1.047
m 4.52ϩ i4.29 Molar Weight 52.01 kg/kmol
Activation Energy Eϭ55 kJ/mol Density 7100 kg/m
3
Viscosity at Melt Temperature
ϭ 0.000684 kg/m•sec
Surface tension
␥
ϭ 1.700Ϫ0.00032(TϪT
m
)N/m
Thermal Conductivity
kϭ69.9ϩ0.15979TϪ0.0004212T
2
ϩ 3.9265ϫ10
Ϫ 7
T
3
Ϫ 1.5974ϫ10
Ϫ 10
T
4
ϩ 2.4025ϫ10
Ϫ 14
T
5
W/m•K
Specific Heat
c
p
ϭ 236.23ϩ1.0788TϪ0.0015052T
2
ϩ 9.7379ϫ10
Ϫ 7
T
3
Ϫ 1.8628ϫ10
Ϫ 10
T
4
J/kg•K
Journal of Heat Transfer NOVEMBER 2000, Vol. 122 Õ 767
However, for chromium with oxygen and sulfur impurities, the
only experimental data in literature shows a negative temperature
coefficient ͓͑17͔͒. Therefore, only a negative temperature coeffi-
cient of surface tension is considered in the simulation.
Calculations are performed for incident laser pulse energies of
2.0 and 2.7
J with 20 nsec pulse width ͑FWHM͒ and a radius of
9.5
m incident on a 0.3
m chromium film. A domain with a
radius of 12
m and axial depth of 0.9
m is used. The axial
depth consists of the 0.3-
m thin chromium film and a 0.6-
m
glass substrate. The glass substrate is much thinner than that used
in the experiments; however, the thermal penetration depth into
the glass is very small within the time period of interest, approxi-
mately 0.13
m. Due to the same reason, the domain size in the
radial direction, 12
m, is large enough to contain the temperature
and fluid field development. The grid size of the thin film is 60
nodes in the radial direction and 12 nodes in the axial direction. A
grid independence study is performed for the 2.0
J, 20 nsec laser
pulse by varying the number of grids in the radial direction. Grid
sizes of 60ϫ 12 and 80ϫ 12 were tested and little differences were
found. The Quasi-Newton ͑Broyden’s update͒ method is used to
solve the system of nonlinear equations. Time integration is per-
formed by the backward Euler method. Approximately 200 hours
of CPU time is required to complete each simulation on a Hewlett
Packard 715/50.
The transient velocity field resulting from a 2.0
J pulse is
plotted as a half-domain in Fig. 8, with the z-axis as the axis of
symmetry. The velocity field begins to develop on the thin melted
surface layer halfway into the laser pulse, seen at 24 nsec in Fig.
8͑a͒, and flows away from the center of the irradiated area due to
the surface tension gradient along the free surface. The flow ac-
celerates to 11.7 m/sec at a time of 53 nsec in Fig. 8͑b͒, and the
velocity peaks at 13.7 m/sec at 99 nsec, and decreases slowly after
this time. The velocity is still well developed with a maximum
velocity of 8.5 m/sec at a time of 192 nsec, as seen in Fig. 8͑d͒.At
238 nsec, the maximum velocity has actually increased when the
location of the maximum velocity is moving toward the center of
the irradiated zone. The size of the velocity field has decreased
significantly since the molten pool is solidifying. The maximum
velocity decreases rapidly until it is almost zero at 258 nsec, as
seen in Fig. 8͑f ͒. Note that the fluid flow field does not develop
until after the laser pulse has ended ͑40 nsec͒ and topography
development occurs long after the laser pulse has ended. This can
be seen in Figs. 8͑c–f ͒. These results compare well with the ex-
perimental results. The experimental study showed droplets out-
side of the holes, resulting from the high velocity radial flow away
from the center of the molten pool. ͑This will also be discussed in
Section 4.͒ The numerical results also correlate well with the in
situ photography experiment, which showed flow development
during the later half of the laser pulse, and rapid changes in the
laser-irradiated area after completion of the laser pulse. The nu-
merical model also shows that the center of the laser-irradiated
zone will be thicker than the remaining modified area early in the
process because the surface tension gradient is the lowest there,
resulting in the lower velocity fluid flow.
The transient maximum temperature, velocity, and recoil pres-
sure are plotted in Figs. 9͑a͒, ͑b͒, and ͑c͒, respectively, for the 2.0
and 2.7-
J laser pulses. The maximum temperature is reached at
approximately 30 nsec, however, the fluid flow in the molten pool
is still accelerating at this time for both laser energy levels. Figure
9͑b͒ shows that the velocity continues to increase long after the
end of the laser pulse. Note that the radial velocity in the molten
pool increases rapidly when pulse energy increases, increasing
inertial effects. Recoil pressure peaks at the same time as the
maximum temperature ͑see Eq. ͑9͒͒, and is only significant during
the first 60 nsec of the process. Figure 8 shows that the topogra-
phy of the free surface developed long after the laser pulse ended,
therefore, it is unlikely that recoil pressure contributes signifi-
cantly to the process. This is due to the fact that the topography
development occurs long after the laser pulse has ended, while the
recoil pressure is negligible after 50–60 nsec. In order to deter-
Fig. 9 Transient „
a
… center node temperature, „
b
… maximum
velocity, and „
c
… center node recoil pressure of 0.3-
m chro-
mium film irradiated by 2.0 and 2.7-
J 20-nsec pulses
Fig. 10 Final surface topography of 0.3-
m chromium film ir-
radiated by 2.0 and 2.7-
J 20-nsec incident laser pulses
768 Õ Vol. 122, NOVEMBER 2000 Transactions of the ASME
mine if recoil pressure has an impact on the results, simulations
are performed with and without the recoil pressure term in Eq. ͑7͒
for both 2.0 and 2.7-
J laser pulses. Due to the time required to
perform a simulation with a temperature-dependent viscosity, the
tests are performed using a constant viscosity. The results of the
simulations show no changes in the transient velocity field or in
the final surface topography. It is thus concluded that surface ten-
sion dominates the fluid flow, and that the recoil pressure has no
significant influence on the processes studied in this work.
Plots of the final surface topography are shown in Fig. 10 for
2.0 and 2.7-
J 20-nsec incident laser pulses. The 2.0-
J pulse
results in a hole that is approximately 8
m in diameter and 0.2
m deep. The 2.7-
J pulse results in a hole that is approximately
12
m in diameter and 0.2
m deep. These diameters are smaller
than the experimental values of approximately 11
m for the
2.0-
J pulse, and 13
m for the 2.7-
J pulse. The differences
between the experimental and numerical hole sizes could be at-
tributed to limitations of the numerical model. One of the limita-
tions of the model is the limited knowledge of material properties.
This is because thin film thermal properties and high-temperature
thermal properties are not well known. The current model uses
bulk material properties that are linearly extrapolated for high
temperatures. Another limitation of the model is that the density
change from the solid to liquid phase is not accounted for, which
may affect the surface topography and the velocity field
development.
4 Instability of the Laser-Induced Fluid Flow
The results of the experimental and numerical studies are used
to analyze the instability mechanisms and droplet formation in the
laser-induced molten pool. Although flow instabilities and droplet
formation are not simulated due to their three-dimensional nature,
the results of the two-dimensional model can be used to obtain
acceleration data for an order of magnitude estimation. The cal-
culations for the 2.0 and 2.7-
J pulses predict maximum flow
accelerations of approximately 3.53ϫ 10
8
m/sec
2
and 1.29
ϫ 10
9
m/sec
2
, respectively. Replacing the gravitational accelera-
tion term in Eq. ͑1͒ with these acceleration values gives critical
wavelengths of approximately 5.5
m for the 2.0-
J pulse and 2.9
m for the 2.7-
J pulse. These values are on the same order of
magnitude as the molten pool diameter in the present study, there-
fore, perturbation in the molten pool can lead to a Rayleigh-
Taylor instability development. Growth of such an instability
could lead to a wavy surface, allowing droplets to initiate from the
peaks of the waves. Inspection of Figs. 2͑d–e͒ shows that the
ridges of material around the holes have a wavy pattern, and Fig.
2͑e͒ shows droplets connected to the peaks of the wavy ridge.
For the Kelvin-Helmholtz instability, if gravitational accelera-
tion is used, Eq. ͑2͒ predicts flows to be stable for relative veloci-
ties less than 24 m/sec, which is on the same order of the calcu-
lated maximum velocity. However, the critical wavelength is on
the order of 33 mm, much larger than the domain of interest in
this study. On the other hand, if acceleration of the melt is used in
Eqs. ͑1͒–͑2͒, the critical wavelength will decrease to the order of
several microns; however, the relative velocity below which the
flow is stable increases to values over 1000 m/s, much higher than
the velocities encountered in the present study. Therefore, it is
unlikely that the Kelvin-Helmholtz instability is present in the
process.
The microphotographs of the laser-irradiated surface shown in
Fig. 2 show droplets outside the edge of the holes. Numerical
simulations and in situ photographs suggest that these droplets are
due to the high radial flow velocity moving fluid away from the
center of the molten pool after the laser pulse has ended. Droplets
may form when the high velocity flow gains enough inertia to
overcome the surface tension forces which hold the fluid together,
allowing material to shear away from the ridge built up at the
outer edge of the holes. The Weber number is a nondimensional
ratio of inertial forces to surface tension forces and is defined as
Weϭ
1
v
2
L
c
␥
(16)
where
v
is the velocity,
␥
is the surface tension, and L
c
is a
characteristic length scale. Since resolutions of the current in situ
experimental techniques are not good enough to measure the melt
velocity, the calculated velocity values are used to estimate the
Weber number. A value of 0.5
m is used for the characteristic
length, which is approximately the diameter of the droplets mea-
sured by SEM. For the 2.0-
J simulation, a maximum velocity of
13.7 m/sec is achieved, and the Weber number is calculated to be
approximately 0.34, which indicates that surface tension forces
dominate. The Weber number for the 2.7-
J simulation is calcu-
lated to be 1.56 at a maximum velocity of 29.1 m/sec, indicating
that inertial forces dominate. These calculations of the Weber
number correlate well with experiments, which show that a large
increase of the number of droplets occurs when the laser pulse
energy varies from 2 to 2.7
J.
5 Conclusions
Fluid flow and droplet formation occurring in a pulsed laser
thin film interaction have been studied. Experimental in situ pho-
tography of the process shows rapid fluid flow after completion of
the laser pulse with evidence of flow instability at the outer edges
of the melted region. Results of a numerical model including the
flow development and total time duration correlate well with ex-
perimental results. Instability analysis shows that the critical in-
stability wavelength is smaller than the molten pool. Thus, pertur-
bations in the molten pool larger than the critical wavelength may
lead to instability development. The calculated Weber number
also correlated well with droplet formation. It is concluded that
the fluid flow and droplet formation are due to the surface-tension-
driven flow, and the recoil pressure due to surface evaporation
plays a minor role in the laser fluence range used in the work.
Acknowledgment
Support for this work by the National Science Foundation
͑CTS-9624890͒ and by the IBM Shared University Research Pro-
gram are gratefully acknowledged. The authors also wish to thank
Mr. Stephen Montgomery of the Ray W. Herrick Laboratories
Atomic Force Microscopy Center at Purdue University for per-
forming Atomic Force Microscopy measurements.
Nomenclature
A ϭ sticking coefficient
c
p
ϭ specific heat
E ϭ activation energy
G ϭ gravitational acceleration
H ϭ enthalpy
j
¯
v
ϭ molar mass flux
k ϭ thermal conductivity
L
c
ϭ characteristic length scale
M ϭ molar weight
N ϭ surface normal vector
P ϭ pressure
P
r
ϭ recoil pressure
p
o
ϭ ambient pressure
Q ϭ volumetric heat generation
R ϭ universal gas constant
R
c
ϭ radius of curvature
T ϭ surface tangential vector
T ϭ temperature
T
l
v
ϭ equilibrium boiling temperature
T
m
ϭ equilibrium melting temperature
V ϭ velocity vector
V ϭ velocity
We ϭ Weber number
Greek Symbols
Journal of Heat Transfer NOVEMBER 2000, Vol. 122 Õ 769
⌬H
l
v
ϭ enthalpy of vaporization
⌺ ϭ free surface geometry
␥
ϭ surface tension
⌳
c
ϭ critical instability wavelength
ϭ density
ϭ surface traction vector
ϭ viscosity
Subscripts
1 ϭ underlying fluid
2 ϭ overlying fluid
l ϭ liquid
s ϭ solid
References
͓1͔ Brailovsky, A. B., Gaponov, S. V., and Luchin, V. I., 1995, ‘‘Mechanisms of
Melt Droplets and Solid-Particle Ejection From a Target Surface by Pulsed
Laser Action,’’ Appl. Phys. A: Mater. Sci. Process., 61, pp. 81–86.
͓2͔ Balandin, V. Yu., Otte, D., and Bostanjoglo, O., 1995, ‘‘Thermocapillary Flow
Excited by Focused Nanosecond Laser Pulses in Contaminated Thin Liquid
Iron Films,’’ J. Appl. Phys., 78, No. 3, pp. 2037–2044.
͓3͔ Dimitrov, D. A., 1995, ‘‘Some Observations on Laser Trimming Platinum
Thin Films,’’ Platinum Met. Rev., 39, No. 3, pp. 129–132.
͓4͔ Bennett, T. D., Krajnovich, D. J., Grigoropoulos, C. P., Baumgart, P., and
Tam, A. C., 1997, ‘‘Marangoni Mechanism in Pulsed Laser Texturing of Mag-
netic Disk Substrates,’’ ASME J. Heat Transfer, 119, pp. 589–596.
͓5͔ Willis, D. A., Xu, X., Poon, C. C., and Tam, A. C., 1998, ‘‘Laser-Assisted
Surface Modification of Thin Chromium Films,’’ Opt. Eng., 37, No. 3, pp.
1033–1041.
͓6͔ Chandrasekhar, S., 1961, Hydrodynamic and Hydromagnetic Stability, Oxford
University Press, London.
͓7͔ Shamsundar, N., and Sparrow, E. M., 1975, ‘‘Analysis of Multidimensional
Conduction Phase Change Via the Enthalpy Model,’’ ASME J. Heat Transfer,
97, pp. 333–340.
͓8͔ von Allmen, M., 1987, Laser-Beam Interactions With Materials ͑Springer Se-
ries in Materials Science 2͒, Springer-Verlag, Berlin, pp. 146–151.
͓9͔ Grosse, A. V., 1963, ‘‘High Temperature Research,’’ Science, 140, pp. 781–
789.
͓10͔ Brandes, E. A., and Brook, G. B., 1992, Smithells Metals Reference Book,7th
Ed., Butterworth-Heinemann, Oxford.
͓11͔ Allen, B. C., 1964, ‘‘The Surface Tension of Liquid Chromium and Manga-
nese,’’ Trans. Metall. Soc. AIME, 230, pp. 1357–1361.
͓12͔ Allen, B. C., 1972, ‘‘The Surface Tension of Liquid Metals,’’ Liquid Metals,
Chemistry and Physics, S. Z. Beer, ed., Marcel Dekker, New York, pp. 161–
212.
͓13͔ Vitol, E. N., and Orlova, K. B., 1984, ‘‘The Surface Tension of Liquid Met-
als,’’ Russ. Metall., 4, pp. 34–40.
͓14͔ Tret’yakova, E. E., Baum, B. A., Tyagunov, G. V., Klimenkov, E. A., and
Tsepelev, V. S., 1986, ‘‘Surface Tension of Molten Steel,’’ Russ. Metall., 4,
pp. 25–28.
͓15͔ Filippov, K. S., 1992, ‘‘Density and Surface Tension of Iron and Fe-Cu-S
Melts,’’ Russ. Metall., 1, pp. 46–48.
͓16͔ Bostanjoglo, O., and Nink, T., 1997, ‘‘Liquid Motion in Laser Pulsed Al, Co
and Au Films,’’ Appl. Surf. Sci. , 109Õ110, pp. 101–105.
͓17͔ Chung, W. B., Nogi, K., Miller, W. A., and McLean, A., 1992, ‘‘Surface
Tension of Liquid Cr-O System,’’ Mater. Trans., JIM, 33, No. 8, pp. 753–757.
͓18͔ Martynyuk, M. M., 1983, ‘‘Critical Constants of Metals,’’ Russ. J. Phys.
Chem., 57, No. 4, pp. 494–501.
͓19͔ Barin, I., 1993, Thermochemical Data of Pure Substances, Part I, Ag–Kr,
VCH, Weinheim, Germany, pp. 418–419.
͓20͔ Incropera, F. P., and DeWitt, D. P., 1990, Fundamentals of Heat and Mass
Transfer, 3rd Ed., John Wiley and Sons, New York, p. A3.
͓21͔ Hunter, W. R., and Lynch, D., 1991, ‘‘An Introduction to the Data for Several
Metals,’’ Handbook of the Optical Constants of Solids II,E.D.Palik,ed.,
Harcourt Brace Jovanovich, Boston, Part II, Subpart I, pp. 374–385.
͓22͔ Boyer, H. E., and Gall, T. L., 1983, Metals Handbook Desk Edition, American
Society for Metals, Metals Park, OH, p. 2.19.
770 Õ Vol. 122, NOVEMBER 2000 Transactions of the ASME