planar laser imaging and modeling of matrix assisted pulsed laser
Bạn đang xem bản rút gọn của tài liệu. Xem và tải ngay bản đầy đủ của tài liệu tại đây (590.95 KB, 8 trang )
Planar laser imaging and modeling of matrix-assisted pulsed-laser
evaporation direct write in the bubble regime
Brent R. Lewis, Edward C. Kinzel, Normand M. Laurendeau,
a͒
Robert P. Lucht, and
Xianfan Xu
School of Mechanical Engineering, Purdue University, West Lafayette, Indiana 47907
͑Received 14 November 2005; accepted 28 May 2006; published online 10 August 2006͒
A combination of planar laser imaging and theoretical modeling has been used to examine
matrix-assisted pulsed-laser evaporation direct write ͑MAPLE-DW͒ in the bubble regime.
MAPLE-DW is a method for patterning substrates via laser-initiated forward transfer of an organic
fluid containing metallic particles and coated on a transparent support. For our conditions, best
deposition of a silver-based, thick-film ink was found to occur when laser-initiated vaporization
forces the ink outward as a bubble. Planar laser imaging was used to monitor bubble growth as a
function of time for three different ink films with nominal thicknesses of 12, 25, and 50
m and two
laser beam diameters of 30 and 60
m. From these measurements, correlations were developed for
predicting the maximum height and velocity of bubbles via three known process variables: laser
energy, ink thickness, and beam diameter. Further insight on the physics of the MAPLE-DW process
was obtained by developing a theoretical model for bubble growth based on a simple force balance
associating vapor-pocket pressure and viscous forces. Primary parameters specifying the subsequent
differential equation were related to the above process variables. Numerical solutions to the
differential equation were used to predict successfully bubble growth versus time for the conditions
analyzed in the imaging experiments. © 2006 American Institute of Physics.
͓DOI: 10.1063/1.2234542͔
I. INTRODUCTION
Demands for smaller feature sizes and rapid prototyping
have prompted investigations of matrix-assisted pulsed-laser
evaporation direct write ͑MAPLE-DW͒ as a potential pro-
cess for laser-based microfabrication. MAPLE-DW can be
used to deposit a single electronic component or a suitable
array of conformal devices over almost any surface at ambi-
ent conditions.
1
Furthermore, the versatility of MAPLE-DW
permits the manufacture of microelectronic components
across many fields, including commercial appliances, com-
mon household fixtures, chemical sensors, biosensor arrays,
and high-frequency devices.
2
Not only are small devices be-
ing installed into larger systems, but complete electrochemi-
cal systems are being created at the microscale using fully
integrated miniature power sources.
3
Because applications
for microelectronic devices are constantly emerging, funda-
mental mechanisms controlling the MAPLE-DW process
continue to warrant research investigations.
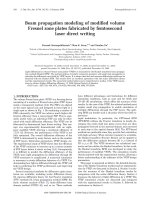
Applying time-resolved optical microscopy to MAPLE-
DW, Young et al.
4
previously identified three distinct re-
gimes of ink response ordered by rising laser fluence: sub-
threshold, jetting, and plume. Moreover, laser absorption
during the process was related to the formation of a vapor
pocket at the ink-quartz interface, as shown in Fig. 1. The
vapor pocket expands and deforms the ink layer on the as-
sociated ribbon, producing one of the three response
regimes.
In this paper, we employ planar laser imaging to charac-
terize more completely the interaction between laser absorp-
tion and subsequent outward expansion of ink, as commonly
used for microelectronics manufacturing. Images of the ex-
pansion process are obtained by pulsing a sheet of light cre-
ated via a Nd:YAG ͑yttrium aluminum garnet͒ laser. This
sheet illuminates the flow field from the side, providing tran-
sient images of the rheological fluid leaving the ribbon.
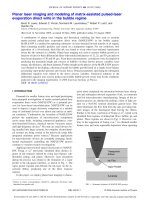
Similar to the basic conclusion of Young et al.
4
, initial work
identified three regimes of ablated ink flows: bubble, jet, and
plume. These regimes are shown in Fig. 2. However, con-
trary to the suggestion of Young et al.,
4
we obtained smaller
feature sizes and more repeatable deposition when operating
a͒
Author to whom correspondence should be addressed; electronic mail:
FIG. 1. Schematic diagram of MAPLE-DW process.
JOURNAL OF APPLIED PHYSICS 100, 033107 ͑2006͒
0021-8979/2006/100͑3͒/033107/8/$23.00 © 2006 American Institute of Physics100, 033107-1
Downloaded 19 Jan 2007 to 128.46.184.20. Redistribution subject to AIP license or copyright, see />in the bubble regime as opposed to the jet regime. The pri-
mary reason for this behavior appears to be the inconsistent
shape and high speed of the fluid jet that leaves the ribbon at
fluences beyond the bubble regime. Based on this result, we
focus here on planar imaging of the MAPLE-DW process
solely within the bubble regime.
Images obtained during this investigation were analyzed
and compared based on the primary process parameters of
laser energy, beam diameter, and ink-film thickness. To en-
hance our understanding of bubble formation, a theoretical
model was also developed using a simple force balance. The
resulting differential equation can ultimately be related to a
combination of intermediate variables and the above process
parameters. Numerical solutions to the characteristic differ-
ential equation were applied to actual measurements of
bubble growth versus time. To control accurately the size and
growth of bubbles, we investigated relations between mea-
sured bubble characteristics and different combinations of
ink thickness, beam diameter, and ablation energy. Correla-
tions to bubble growth data are provided to enable predic-
tions of maximum bubble height, bubble radius, and maxi-
mum bubble velocity.
II. EXPERIMENTAL SETUP
A detailed schematic of the experimental apparatus is
shown in Fig. 3. Vaporization of ink at the interface is
achieved by employing a Spectra-Physics 7300 Nd:YLF
laser-diode module. The 1047 nm diode output varies in fre-
quency from 1 to 10 000 Hz, with an adjustable power up to
2 W and a pulse width of 20 ns. The Nd:YLF output beam is
expanded by a factor of 10 using spherical lenses with focal
lengths of 30 and 300 mm. The laser energy can be varied by
using a 1064 nm half-wave plate and a thin-film plate polar-
izer. The effective beam diameter at the interface is con-
trolled by adjusting the position of a 75 mm spherical focus-
ing lens.
A frequency-doubled Continuum Surelite III Nd:YAG
laser is used to illuminate the vaporization process. At
532 nm, this laser provides an energy of 300 mJ/pulse at a
repetition rate of 10 Hz. To illuminate the flow field, a sheet
of light is created with two lenses. A cylindrical lens diverges
the Nd:YAG beam along the vertical axis. A spherical focus-
ing lens focuses the beam along the horizontal axis and
recollimates the beam along its vertical axis.
Images are captured with an Andor iXon electron-
multiplying charge-coupled device ͑EMCCD͒ camera, which
has a 512ϫ 512 CCD array and a pixel size of 16
m. An
objective lens with adjustable magnification between 2.5 and
10 provides a viewable field between 0.82 and 3.28 mm
square. The shortest available gate time of the iXon camera
is 20
s. However, this camera is capable of taking data at
the laser repetition rate of 10 Hz, enabling fast and efficient
data collection. Two Stanford Research Systems DG535 de-
lay generators are employed to ensure precise delays be-
tween the onset of vaporization and sequential images of
bubble growth.
The ink employed for this research is DuPont QS300, a
conductive paste developed for screen printing that contains
silver microparticles. While the viscosity of QS300 actually
varies with shear rate, its appearance at room temperature is
that of a thick gray paste. Moreover, its high viscosity at low
speeds prevents QS300 from smoothing out naturally when
coated onto ribbons with a 5
m wire roller. Therefore, ink
films were created by placing a droplet of ink at one end of a
soda-lime glass slide between two metal shims. A glass rod
was then pulled across the two shims, creating a flat layer of
ink at nearly the same thickness as that of the shims.
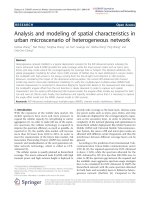
III. ANALYTICAL MODEL FOR BUBBLE GROWTH
A one-dimensional model was developed so as to pro-
vide a simple physical explanation for both laser-induced
evaporation and subsequent bubble expansion. The model
begins with a fundamental force balance, as shown in Fig. 4.
We assume that the pressure created in the vapor pocket and
the surrounding viscous response constitute the only two
forces acting on the column of ink, as given by
F
P
= ͑P − P
atm
͒A
C
͑1͒
and
F
V
=−k
v
, ͑2͒
respectively. The pressure force, given by Eq. ͑1͒, results
from the difference between the pressure created inside the
vapor pocket and atmospheric pressure acting on the ink sur-
face. The pressure inside the vapor pocket changes as the
pocket forces ink away from the ribbon. These pressure
forces act on the circular area of the ink column, A
C
=
R
2
.
FIG. 3. Experimental setup for planar laser imaging of MAPLE-DW
process.
FIG. 2. Pictorial views of plume, jet, and bubble classifications for ink-film
response.
033107-2 Lewis et al. J. Appl. Phys. 100, 033107 ͑2006͒
Downloaded 19 Jan 2007 to 128.46.184.20. Redistribution subject to AIP license or copyright, see />The viscous force, given by Eq. ͑2͒, is assumed to be
directly proportional to the average velocity of the ink col-
umn,
v
. The proportionality constant k can subsequently be
related to the contact area between the cylindrical column
and its surrounding ink. Therefore, we replace k with a new
viscous-force constant k
C
͑m
−2
s
−1
͒ given by
k
C
=
k
2
Rt
i
, ͑3͒
where R is the common radius of the ink column and vapor
pocket ͑
m͒, while t
i
is the nominal ink thickness ͑
m͒. For
simplicity, we take the contact area between the rigid-ink
cylinder and its surrounding ink to be constant during the
vaporization process.
Applying Newton’s second law to the viscous and pres-
sure forces, we may derive a characteristic differential equa-
tion for the bubble height y above the ink layer, given by
y
Љ
+
2k
C
i
R
y
Ј
−
P
0
t
0
i
t
i
y
−1
=−
P
atm
i
t
i
, ͑4͒
where
i
is the ink density ͑kg/m
3
͒, P
0
is the initial vapor-
pocket pressure ͑Pa͒, t
0
is the initial vapor-pocket thickness
͑
m͒, and P
atm
is the atmospheric pressure ͑Pa͒. Recall that
our specified process parameters are the nominal ink thick-
ness, laser-beam diameter, and ablation energy. Because the
viscous-force constant, ink density, ink column radius, initial
vapor-pocket thickness, and initial vapor-pocket pressure are
unknown, we require further assumptions to relate these in-
termediate variables to the above process parameters.
The viscous-force constant and ink density are assumed
to be constant throughout all variations of ink thickness,
beam diameter, and ablation energy. The actual geometry is
clearly not a cylinder, as evidenced by bubble pictures. Fur-
thermore, bubble growth is monitored via the tip of a para-
bolic bubble, which we attempt to match with an entire cyl-
inder. Therefore, we expect a model density of perhaps half
the actual ink density, as much less mass is moving outward
for the actual bubbles. As will be discussed later, the fluid
density determined by fitting the model to experimental data
is actually considerably lower than even this expected
density.
Another critical assumption is negligible heat transfer
from the vapor pocket during the process, when in reality
some energy must be lost in the radial direction. The vapor
trapped by the ink is also assumed not to condense through-
out its expansion, ruling out the possibility of an associated
reduction in pressure. Although thermal effects might still be
operative, our overall adiabatic assumption is reasonable
given the extremely rapid processes of evaporation and
bubble growth.
When the bubble stops moving, the acceleration and ve-
locity terms of Eq. ͑4͒ are zero. Therefore, the final bubble
height is given by
y
ss
=
P
0
t
0
P
atm
. ͑5͒
We thus find from Eq. ͑5͒ that the final bubble height y
ss
depends only on the initial vapor-pocket pressure P
0
and the
initial vapor-pocket thickness t
0
. Although absolute values
of P
0
and t
0
are unknown, their product can be calculated
directly by multiplying the experimental height y
ss
by P
atm
.
On this basis, P
0
t
0
can be determined via curve fitting a
single data set; further values can then be determined by
invoking a scaling ratio based on process variables. Scaling
ratios for vapor-pocket thickness and pressure are discussed
in Sec. III B.
A. Vapor-pocket radius
The radius of the ink column can be related quite easily
to the beam diameter and laser energy. If the energy within
the beam is distributed according to a Gaussian profile, then
the local fluence F can be described as a function of radius r
given by
F = F
0
exp
ͩ
−
r
2
2
2
ͪ
, ͑6͒
where
is the standard deviation of the spatial profile. The
nominal fluence F
N
can be calculated from the beam diam-
eter d and the pulse energy E by
F
N
=
4E
d
2
. ͑7͒
For this study, we define the beam diameter as the distance
between lateral positions of a razor edge at which the trans-
mitted energy drops from 90% to 10% of its full-scale value,
which corresponds to a radial distance of 2.564
.
5
The cen
-
terline fluence can thus be calculated directly from the nomi-
nal fluence by
F
0
= 1.28F
N
. ͑8͒
Assuming that the vapor-pocket radius can be deter-
mined by the radial position at which the local fluence passes
above a threshold F
t
, the radius R at which this threshold is
surpassed can be expressed as
FIG. 4. Force diagram of ink-column system showing vapor pocket.
033107-3 Lewis et al. J. Appl. Phys. 100, 033107 ͑2006͒
Downloaded 19 Jan 2007 to 128.46.184.20. Redistribution subject to AIP license or copyright, see />R =
d
ͱ
2ln͑F
0
/F
t
͒
2.564
. ͑9͒
We presume a threshold fluence F
t
=0.15 J/ cm
2
for all cal-
culations, because this value defines the lowest bubble-
producing fluence measured during the experiments of this
investigation. On this basis, Eq. ͑9͒ can be used to determine
the vapor-pocket radius for any specified beam energy and
diameter.
B. Vapor-pocket thickness and pressure
According to Beer’s law, incoming energy is absorbed
such that its value as a function of ink-film depth y is given
by
E͑y͒ = E
0
exp͑−
t
y͒, ͑10͒
where E
0
is the initial beam energy and
t
is an attenuation
coefficient. Although we cannot directly calculate the attenu-
ation coefficient, an exact value is not necessary because of
the relation between initial vapor-pocket thickness and final
bubble height given by Eq. ͑5͒. We thus assign a baseline
vapor-pocket thickness t
0,a
of 1
m to the previous data set
chosen for curve fitting. Employing Eq. ͑10͒ for this baseline
vapor-pocket thickness, defined as the depth at which the
laser energy has decayed to its threshold value E
t
, the initial
thickness of the vapor pocket for subsequent data sets can be
determined from
t
0,b
= t
0,a
ln͑E
b
/E
t
͒
ln͑E
a
/E
t
͒
, ͑11͒
where E
a
is the measured beam energy for the curve-fitted
data set. Based on a fluence threshold, F
t
=0.15 J/ cm
2
,we
find that the 30 and 60
m beam diameters yield equivalent
energy thresholds of 1.0 and 4.2
J, respectively.
The final unknown required for solving Eq. ͑4͒ is the
initial vapor-pocket pressure P
0
. Fortunately, once the initial
vapor-pocket thickness has been determined, the initial
vapor-pocket pressure can be easily calculated from Eq. ͑5͒.
However, a problem arises when attempting to determine
how the magnitude of this pressure changes with laser en-
ergy, ink thickness, and beam diameter. Assuming that these
variables all affect the initial vapor-pocket pressure, we sup-
pose that an unknown initial vapor-pocket pressure P
0,b
can
be determined from that based on curve-fitted data P
0,a
through
P
0,b
= P
0,a
ͩ
E
b
E
a
ͪͩ
t
i,b
t
i,a
ͪ
m
ͩ
d
b
d
a
ͪ
n
, ͑12͒
where m and n are variable exponents for ink thickness and
beam diameter, respectively. Although a least-squares fit was
used to determine m and n, this procedure is not the same as
fitting the initial pressure directly to final bubble heights via
Eq. ͑5͒. The difference is that the preferred method used here
provides a correlation between initial vapor-pocket pressure
and known process variables, which could be used in future
work. The final relation is given by
P
0,b
= P
0,a
ͩ
E
b
E
a
ͪͩ
t
i,a
t
i,b
ͪ
0.65±0.10
ͩ
d
a
d
b
ͪ
0.39±0.12
, ͑13͒
where the error bars for m and n have been defined by the
variations which increase the least-squares error by 10%.
Beginning with given process parameters, the bubble
height as a function of time can be determined from numeri-
cal solution of Eq. ͑4͒. Such solutions were obtained using
an initial value of y equal to the initial vapor-pocket thick-
ness with an accompanying velocity of zero. In reality, the
bubble height is initially zero, so that the initial vapor-pocket
thickness was always subtracted from numerical bubble
heights to correct for actual initial conditions.
Using the above expressions, we may fit the numerical
solution based on Eq. ͑4͒ to a single data set so as to deter-
mine values of the ink density and viscous-force constant.
Once these parameters have been evaluated, the above rela-
tions permit calculations of bubble growth for any other
combination of ink thickness, beam diameter, and ablation
energy.
IV. RESULTS AND DISCUSSION
A. Comparisons of experimental and predicted
behaviors
The spot sizes selected for analysis of pure QS300 ink
were 30 and 60
m. Experiments were conducted for ink
films coated using 0.5, 1, and 2 mil stainless steel shims,
nominally corresponding to 12, 25, and 50
m. For each
combination of beam diameter and ink thickness, three flu-
ences were chosen based on the highest fluence for which a
bubble was observed, the lowest, and one value of fluence
roughly halfway between the highest and lowest. Once pa-
rameters for every data set had been compiled, a differential
equation solver was used to compute bubble growth curves
for each case. Three of the six curves resulting from these
computations are plotted along with their corresponding data
sets averaged over 15 runs in Figs. 5–7. Error bars at the
68% confidence limit are shown for several individual data
points in each figure.
FIG. 5. Bubble growth data and model results for spot size of 30
mand
ink thickness of 50
m.
033107-4 Lewis et al. J. Appl. Phys. 100, 033107 ͑2006͒
Downloaded 19 Jan 2007 to 128.46.184.20. Redistribution subject to AIP license or copyright, see />In general, all bubble height versus time curves are char-
acterized by rapid growth for a short period after laser irra-
diation. Rapid expansion indicates a large force in the direc-
tion of bubble growth. This force is a result of high pressure
within the vapor pocket, which is created by the laser pulse.
As the bubble expands, pressure is relieved and the bubble
slows in its growth. Such inhibition can also arise from in-
terfacial cooling and partial condensation of the vapor
pocket.
Viscous forces combined with reduced vapor-pocket
pressures participate in slowing bubble expansion, so that the
bubble gradually reaches it maximum height. The peak
bubble height is greater for an increased laser fluence, larger
spot size, and thicker ink film. Once at its peak, the bubble
height slowly relaxes to its final value. Some bubbles remain
at their peak height, while others retract back toward the ink
film. This retraction is most significant for bubbles produced
with larger spot sizes and thicker ink films. Based on Figs.
5–7 deposition should be optimized when the bubble ex-
pands outward to a certain point and then retracts back to-
ward its original position along the ink film.
The separation between ink film and substrate must be
carefully selected based on the bubble size and shape. Be-
cause the bubble tip is round, the bubble radius varies greatly
with height near the tip. Consequently, small shot-to-shot
variations could cause chaotic depositions for ink-substrate
gaps close to the expected bubble height. In comparison, by
moving closer to the original ink-film surface, the bubble
radius becomes much less sensitive to height. Hence, for
gaps smaller than the expected bubble height, shot-to-shot
variations should have less effect on deposition behavior.
Consequently, repeatable depositions should prove more
likely when the substrate is spaced at a distance less than the
expected bubble height from the ink ribbon.
Based on Figs. 5–7 all bubbles begin expanding outward
from the initial ink-film layer between 50 and 250 ns after
the ablation pulse. These times are not noticeably affected by
variations in laser spot size. According to these data, the
determining factor for the beginning of bubble expansion is
ink thickness. Bubble growth is evident for the 12
m films
from 50 to 100 ns after the laser pulse, whereas the 50
m
films begin growing anywhere from 100 to 250 ns following
the laser pulse. Bubble heights peak anywhere from 750 ns
after laser irradiation for small spot sizes and ink thicknesses
to 3500 ns for large spot sizes and ink thicknesses.
From Figs. 5–7 we also conclude that relevant solutions
to Eq. ͑4͒ agree reasonably well with bubble growth data.
The data set used for baseline curve fitting is that shown in
Fig. 5 ͑2.01 J/cm
2
͒. As expected, the accuracy of the model
deteriorates somewhat as process variables deviate further
from those values used for curve fitting. Despite this mild
deterioration, the model can be used quite efficaciously when
comparing the most significant trends observed for bubble
growth.
Before discussing positive and negative features of pre-
dictions from the model, we first consider dynamic effects
arising from the three nonunity coefficients of the character-
istic differential equation, labeled c
1
, c
2
, and c
3
, as follows:
y
Љ
+ c
1
y
Ј
− c
2
y
−1
=−c
3
. ͑14͒
On this basis, parametric variations were conducted by vary-
ing only one coefficient and plotting curves of bubble height
versus time. The generic effects from the three coefficients
are illustrated in Fig. 8. These plots provide a qualitative
visualization of the behavior associated with all three curve-
fitting coefficients, which are each varied by ±20%. Based
on these results, the first coefficient, c
1
, affects only the sys-
tem overshoot. By increasing c
1
, the overshoot decreases and
the system reaches its final height with less oscillation, as
shown in Fig. 8͑a͒.
Although the second coefficient, c
2
, has little effect on
the time required to reach the maximum bubble height, it
greatly affects these values, as illustrated in Fig. 8͑b͒. The
entire bubble growth curve seems to shift upward in propor-
tion to the magnitude of c
2
. Final heights shift according to
Eq. ͑9͒ for changes in both c
2
and c
3
. Although the final
height is shifted inversely by the value of c
3
, bubble heights
occurring prior to the peak do not change substantially.
Changes in peak height are somewhat moderated in compari-
son to changes in final height, as shown in Fig. 8͑c͒.
FIG. 7. Bubble growth data and model results for spot size of 30
mand
ink thickness of 12
m.
FIG. 6. Bubble growth data and model results for spot size of 60
m and
ink thickness of 50
m.
033107-5 Lewis et al. J. Appl. Phys. 100, 033107 ͑2006͒
Downloaded 19 Jan 2007 to 128.46.184.20. Redistribution subject to AIP license or copyright, see />An important trend that the model estimates well is the
amount of retraction from the peak bubble height. Bubbles
created with larger beam diameters show greater amounts of
retraction. This trend is not as pronounced experimentally as
the model predicts for smaller ink thicknesses, but the model,
nevertheless, captures the general idea. Contrary to data,
however, the model predicts an increase in this retraction
with decreasing ink thickness. A potential cause for this dis-
crepancy is our calculation of initial vapor-pocket size. If
predicted values of initial vapor-pocket radius are too large,
then the value of c
1
is too small. As c
1
drops, the amount of
overshoot rises. In addition, if c
1
is incorrectly related to the
initial vapor-pocket radius, this same error might be ob-
served in the predictions.
The model predicts initial bubble growth quite well, es-
pecially for results obtained using a smaller beam diameter.
For larger beam diameters, the error associated with initial
bubble growth increases as the ink thickness drops with re-
spect to the curve-fitted ink thickness of 50
m. Based on
the individual behavior associated with each coefficient, ini-
tial bubble growth errors could be caused by either an inac-
curate ink density or an inaccurate value of c
2
͓see Fig. 8͑b͔͒.
Direct interpretation of this error is difficult owing to the
multiple relations embedded within the three coefficients of
Eq. ͑14͒.
At this point, the efficacy of the proposed model can be
partially assessed by combining Eq. ͑5͒ with Eq. ͑14͒ for
steady-state conditions, thus obtaining
y
ss
=
c
2
c
3
=
P
0
t
0
P
atm
, ͑15͒
which eliminates any requirement for knowledge of the ink
density. From Fig. 8, typical values for c
2
and c
3
are
500 m
2
/s
2
and 2.5ϫ 10
7
m/s
2
, respectively. Hence, given an
initial vapor-pocket thickness of 1
m, we find that the ini-
tial vapor-pocket pressure is ϳ2 MPa, which is certainly not
unreasonable. However, owing to the simplicity of the pro-
posed model, which requires an estimate for t
0
, physically
meaningful values for model parameters properly await a
more advanced model, as will be discussed further in Sec. V.
B. Correlations for bubble height, radius,
and velocity
Future applications of MAPLE-DW require that we
guarantee bubbles of a certain size; hence, we sought empiri-
cal relations between measured bubble dimensions and dif-
ferent combinations of laser energy, beam diameter, and ink
thickness. A suitable representation linking maximum bubble
height H
B
to beam diameter d, ink thickness t
i
, and laser
energy E, is shown in Fig. 9. This relation was determined by
first maximizing the correlation coefficient to determine ex-
ponents for beam diameter and ink thickness. Once these
exponents were determined, a least-squares fit was used to
determine the coefficients for a second-order polynomial in
beam energy. Maximum bubble height, beam diameter, and
ink thickness are given in micrometers, while the laser pulse
energy is given in microjoules. On this basis, a polynomial
correlation for maximum bubble height is given by
H
B
=
1
d
0.914
t
i
0.455
͑134.4 + 123.6E + 5.7E
2
͒, ͑16͒
where d and t
i
have been divided by 1
m, thus making
them properly dimensionless. The correlation coefficient for
QS300 when using Eq. ͑16͒ is 0.991. Uncertainties in the
exponents for beam diameter and ink thickness are both
±0.007, as defined by variations that increase the least-
squares error by 10%.
FIG. 8. Effects of variations in ͑a͒ first, ͑b͒ second, and ͑c͒ third coefficients
of Eq. ͑14͒ on projected bubble growth. Coefficient values correspond to a
spot size of 30
m and an ink thickness of 50
m.
FIG. 9. Correlation for maximum bubble height with respect to beam diam-
eter, ink thickness, and laser energy. The beam diameter d and ink thickness
t
i
are divided by 1
m to ensure proper dimensionality.
033107-6 Lewis et al. J. Appl. Phys. 100, 033107 ͑2006͒
Downloaded 19 Jan 2007 to 128.46.184.20. Redistribution subject to AIP license or copyright, see />As for the maximum bubble height, by investigating dif-
ferent relations combining ink thickness, beam diameter, and
laser energy, we obtained a related expression for the bubble
radius. The resulting equation was developed by using a
least-squares fit of bubble radius data to parametric functions
of the above process variables. Employing methods similar
to those used to determine the coefficients for Eq. ͑16͒, the
final relation specifying bubble radius, in micrometers, is
given by
R
B
=
t
i
0.13
d
0.68
͑39.9 + 14.0E͒, ͑17͒
where d and t
i
again represent dimensionless beam diameter
and ink thickness, respectively. Figure 10 shows a compari-
son between the predictions from Eq. ͑17͒ and actual bubble
radius data. The uncertainties in the exponents for beam di-
ameter and ink thickness were both ±0.01, as defined again
by independent variations which increase the least-squares
error by 10%. The correlation coefficient for this linear rela-
tion is 0.97.
Given Eqs. ͑16͒ and ͑17͒, the corresponding maximum
bubble height and radius can be estimated for any thickness
of pure QS300 ink based on the energy and diameter of the
vaporizing laser. Though these relations are imperfect, they
provide a good starting point when estimating the required
gap between the substrate and ink film for optimal
deposition.
To understand further the dynamics of ink ablation and
deposition, we examine next the velocity of bubble expan-
sion. In particular, we determine the maximum bubble veloc-
ity from derivatives of Lagrange interpolating polynomials
for every four data points.
6
As for the approach used to cor
-
relate maximum bubble height and radius to process vari-
ables, a similar correlation was applied to relate maximum
bubble velocity to beam diameter, ink thickness, and laser
energy. The result for this linear correlation is shown in Fig.
11. On this basis, the maximum bubble velocity can be speci-
fied, in m/s, by
V
B
=
1
d
1.23
t
i
1.03
͑− 27 100 + 14 000E͒, ͑18͒
where the laser energy is given in microjoules, while the
beam diameter and ink thickness are again dimensionless,
owing to division by 1
m. The uncertainties of the expo-
nents for beam diameter and ink thickness are both ±0.02, as
defined by changes in value which increase the least-squares
error by 10%. The correlation coefficient for this linear rela-
tion is 0.95.
For thicker ink films, the maximum bubble velocity
drops, owing to an increased amount of material that resists
bubble expansion. On the other hand, for a greater ink thick-
ness, the plume threshold becomes much less sensitive to
changes in laser spot size. Consequently, by increasing the
beam diameter, the irradiance drops, which vaporizes less
material. Less vaporization leads to a smaller pressure pulse,
which accordingly reduces the maximum bubble velocity.
The combination of effects from ink thickness and beam
diameter is difficult to visualize. Therefore, the maximum
bubble velocity has been plotted in Fig. 12 against terms in
Eq. ͑18͒ that include both of these variables. The front ve-
locity is shown for both maximum and minimum bubble-
generating fluences at each combination of ink thickness and
beam diameter. A noticeable rise in front velocity occurs near
the middle of this plot, indicating a potential maximum. If a
maximum in front velocity exists at the center of Fig. 12, it
would correspond to an ink thickness of ϳ25
m and a
beam diameter between 30 and 60
m.
V. CONCLUSIONS
Three different regimes of laser-ink interaction were
identified for the MAPLE-DW process: bubble, jet, and
plume. By combining temporal images with deposition re-
sults, we found that the bubble regime is best for writing
clean, repeatable patterns on substrates. Full data sets were
thus collected to characterize bubble growth versus time for
three different ink-film thicknesses of 12, 25, and 50
m and
for two laser-beam diameters of 30 and 60
m. The laser
FIG. 10. Correlation for maximum bubble radius with respect to beam di-
ameter, ink thickness, and laser energy. The beam diameter d and ink thick-
ness t
i
are divided by 1
m to ensure proper dimensionality.
FIG. 11. Correlation for maximum bubble velocity with respect to beam
diameter, ink thickness, and laser energy. The beam diameter d and ink
thickness t
i
are divided by 1
m to ensure proper dimensionality.
033107-7 Lewis et al. J. Appl. Phys. 100, 033107 ͑2006͒
Downloaded 19 Jan 2007 to 128.46.184.20. Redistribution subject to AIP license or copyright, see />fluences used for these data sets spanned the range of bubble-
producing energies for each set of experimental conditions.
A simple force balance was applied to generate a differ-
ential equation for bubble growth based on both intermediate
variables and known process parameters. Employing theoret-
ical relations and suitable approximations, the intermediate
variables were related to these process parameters. On this
basis, bubble height verus time curves were determined and
compared to the measured bubble data, as obtained via pla-
nar laser imaging.
The ink density obtained via the curve-fitting procedure
was significantly lower than that expected based on the high
metallic content of QS300 ink, even when accounting for the
larger, cylindrical volume of ink assumed in the model. Ul-
timately, predictions of bubble height versus time were rea-
sonably accurate considering the approximations made dur-
ing the modeling process. Although our simplified model
was based on a straightforward balance between vapor-
pocket pressure and viscous forces, it nevertheless ad-
equately predicts heights to which bubbles rise owing to
vapor-pocket expansion—although less so for smaller ink
thicknesses.
Correlations were developed to predict peak bubble
height and bubble radius based on beam diameter, ink thick-
ness, and laser energy. A correlation for the maximum bubble
velocity was also developed using these same process param-
eters. All three correlations relate the desired quantity to a
first multiplicand defined by the dimensionless beam diam-
eter and ink thickness and a second multiplicand containing
the laser energy. Based on these correlations, we suggest that
optimal deposition should be achieved when bubbles expand
outward, touch the substrate to deposit a small amount of
ink, and then retract back towards the original ink film. This
behavior is most often observed for larger beam diameters
and thicker ink films.
The model presented in this paper successfully captures
the dominant features of bubble development and expansion,
followed by collapse to a presumably steady-state displace-
ment. However, a number of assumptions and simplifications
in the model lead to disagreement between measured and
observed bubble heights. For example, the assumed constant
viscosity fails to capture the shear-thinning behavior of the
thick-film ink used in this research, which was specifically
designed to facilitate screen-printing processes.
7
By includ
-
ing this behavior in the model, we might be able to under-
stand why the bubble does not eventually regain its initial
shape. In addition, the existing model does not account for
surface tension effects, which may contribute to bubble re-
traction. Figure 2, in fact, demonstrates the presence of sur-
face tension as the bubble collapses to a jet at higher flu-
ences. The current model captures such forces driving bubble
collapse by solely invoking a negative gauge pressure arising
from vapor-pocket expansion. Further investigation is also
needed on the efficacy of a 1
m initial vapor-pocket thick-
ness for the existing model.
In summary, we have investigated the MAPLE-DW pro-
cess in the bubble regime via planar laser imaging and have
proposed a simplified theoretical model to represent bubble
growth trends. Correlations have been developed, which pro-
vide adequate approximations of maximum bubble height,
bubble radius, and maximum bubble velocity. While future
studies might lead to improved correlations, the relations de-
veloped in this work are probably sufficient for applying the
MAPLE-DW process on an industrial scale. A more sophis-
ticated model incorporating both varying viscosity and sur-
face tension effects is currently under development. Presum-
ably, a more robust model will lead to a better representation
of bubble geometry, a more accurate value of ink density,
and thus improved predictions of bubble height versus time.
ACKNOWLEDGMENTS
This project was supported by the Indiana 21st Century
Research and Technology Fund. Two of the authors ͑B.R.L.
and E.C.K.͒ acknowledge additional support from Lozar Stu-
dent Fellowships.
1
A. Piqué, B. R. Ringeisen, D. B. Chrisey, R. Modi, H. D. Young, H. D.
Wu, and R. C. Y. Auyeung, CLEO Conference on Lasers Electro-Optics,
Vol. 1, pp. 50-51, Chiba, Japan ͑2001͒.
2
A. Piqué, D. B. Chrisey, J. M. Fitz-Gerald, and R. A. McGill, J. Mater.
Res. 15, 872 ͑2000͒.
3
C. B. Arnold, T. E. Sutto, H. Kim, and A. Piqué, Laser Focus World 40,
S9 ͑2004͒.
4
D. Young, R. C. Y. Auyeung, A. Piqué, D. B. Chrisey, and D. D. Dlott,
Appl. Surf. Sci. 197–198, 181 ͑2002͒.
5
E. Kreysig, Advanced Engineering Mathematics, 8th ed. ͑Wiley, New
York, 1999͒.
6
E. W. Weisstein, Lagrange Interpolating Polynomial, in MathWorld, a
Wolfram Web Resource, />LagrangeInterpolatingPolynomial.html.
7
R. W. Kay et al., Proceedings of Conference on MicroSystem Technolo-
gies, Munich, Germany, 2003; see also J. J. Licari and L. R. Enlow,
Hybrid Microcircuit Technology Handbook ͑Noyes, Westwood, NJ, 1998͒.
FIG. 12. Maximum bubble velocity at maximum and minimum laser flu-
ences for each combination of beam diameter and ink thickness. The beam
diameter d and ink thickness t
i
are divided by 1
m to ensure proper
dimensionality.
033107-8 Lewis et al. J. Appl. Phys. 100, 033107 ͑2006͒
Downloaded 19 Jan 2007 to 128.46.184.20. Redistribution subject to AIP license or copyright, see />