Astm e 986 04 (2017)
Bạn đang xem bản rút gọn của tài liệu. Xem và tải ngay bản đầy đủ của tài liệu tại đây (137.87 KB, 3 trang )
This international standard was developed in accordance with internationally recognized principles on standardization established in the Decision on Principles for the
Development of International Standards, Guides and Recommendations issued by the World Trade Organization Technical Barriers to Trade (TBT) Committee.
Designation: E986 − 04 (Reapproved 2017)
Standard Practice for
Scanning Electron Microscope Beam Size Characterization1
This standard is issued under the fixed designation E986; the number immediately following the designation indicates the year of
original adoption or, in the case of revision, the year of last revision. A number in parentheses indicates the year of last reapproval. A
superscript epsilon (´) indicates an editorial change since the last revision or reapproval.
1. Scope
3. Terminology
1.1 This practice provides a reproducible means by which
one aspect of the performance of a scanning electron microscope (SEM) may be characterized. The resolution of an SEM
depends on many factors, some of which are electron beam
voltage and current, lens aberrations, contrast in the specimen,
and operator-instrument-material interaction. However, the
resolution for any set of conditions is limited by the size of the
electron beam. This size can be quantified through the measurement of an effective apparent edge sharpness for a number
of materials, two of which are suggested. This practice requires
an SEM with the capability to perform line-scan traces, for
example, Y-deflection waveform generation, for the suggested
materials. The range of SEM magnification at which this
practice is of utility is from 1000 to 50 000 × . Higher
magnifications may be attempted, but difficulty in making
precise measurements can be expected.
1.2 This standard does not purport to address all of the
safety concerns, if any, associated with its use. It is the
responsibility of the user of this standard to establish appropriate safety and health practices and determine the applicability of regulatory limitations prior to use.
1.3 This international standard was developed in accordance with internationally recognized principles on standardization established in the Decision on Principles for the
Development of International Standards, Guides and Recommendations issued by the World Trade Organization Technical
Barriers to Trade (TBT) Committee.
3.1 Definitions: For definitions of terms used in this
practice, see Terminology E7.
3.2 Definitions of Terms Specific to This Standard:
3.2.1 Y-deflection waveform—the trace on a CRT resulting
from modulating the CRT with the output of the electron
detector. Contrast in the electron signal is displayed as a
change in Y (vertical) rather than brightness on the screen. This
operating method is often called Y-modulation.
4. Significance and Use
4.1 The traditional resolution test of the SEM requires, as a
first step, a photomicrograph of a fine particulate sample taken
at a high magnification. The operator is required to measure a
distance on the photomicrograph between two adjacent, but
separate edges. These edges are usually less than one millimetre apart. Their image quality is often less than optimum
limited by the S/N ratio of a beam with such a small diameter
and low current. Operator judgment is dependent on the
individual acuity of the person making the measurement and
can vary significantly.
4.2 Use of this practice results in SEM electron beam size
characterization which is significantly more reproducible than
the traditional resolution test using a fine particulate sample.
5. Suggested Materials
5.1 SEM resolution performance as measured using the
procedure specified in this practice will depend on the material
used; hence, only comparisons using the same material have
meaning. There are a number of criteria for a suitable material
to be used in this practice. Through an evaluation of these
criteria, two samples have been suggested. These samples are
nonmagnetic; no surface preparation or coating is required;
thus, the samples have long-term structural stability. The
sample-electron beam interaction should produce a sharply
rising signal without inflections as the beam scans across the
edge. Two such samples are:
5.1.1 Carbon fibers, NIST—SRM 2069B.3
5.1.2 Fracture edge of a thin silicon wafer, cleaved on a
(111) plane.
2. Referenced Documents
2.1 ASTM Standards:2
E7 Terminology Relating to Metallography
E766 Practice for Calibrating the Magnification of a Scanning Electron Microscope
1
This practice is under the jurisdiction of ASTM Committee E04 on Metallography and is the direct responsibility of Subcommittee E04.11 on X-Ray and
Electron Metallography.
Current edition approved June 1, 2017. Published June 2017. Originally
approved in 1984. Last previous edition approved in 2010 as E986 – 04(2010). DOI:
10.1520/E0986-04R17.
2
For referenced ASTM standards, visit the ASTM website, www.astm.org, or
contact ASTM Customer Service at For Annual Book of ASTM
Standards volume information, refer to the standard’s Document Summary page on
the ASTM website.
3
Available from National Institute of Standards and Technology (NIST), 100
Bureau Dr., Stop 1070, Gaithersburg, MD 20899-1070, .
Copyright © ASTM International, 100 Barr Harbor Drive, PO Box C700, West Conshohocken, PA 19428-2959. United States
1
E986 − 04 (2017)
6. Procedure
6.1 Inspect the specimen for cleanliness. If the specimen
appears contaminated, a new sample is recommended as any
cleaning may adversely affect the quality of the specimen edge.
6.2 Ensure good electrical contact with the specimen by
using a conductive cement to hold the specimen on a SEM
stub, or by clamping the specimen on the stage of the SEM.
Mount the specimen rigidly in the SEM to minimize any image
degradation caused by vibration.
6.3 Verify magnification calibration for both X and Y directions. This can be accomplished by using Practice E766.
6.4 Use a clean vacuum of 1.33 by 10− 2 Pa (10− 4 mm Hg)
or better to minimize specimen contamination resulting from
electron beam and residual hydrocarbons interacting during
examination. The presence of a contamination layer has a
deleterious effect on image-edge quality.
6.5 Allow a minimum of 30 min for stabilization of electronic components, vacuum stability, and thermal equilibrium
for the electron gun and lenses. The selection of optimum SEM
parameters is at the discretion of the operator.4 For measuring
the ultimate resolution, these will typically be: high kV
(~30max.), short working distance (5 to 10 mm), smallest spot
size, and long scan time.
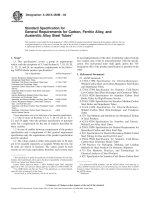
FIG. 1 Edge of Graphitized Natural Cellulose Fiber Used to Produce Line Traces (Fig. 3)
6.6 Any alternative set of conditions can be used to measure
probe size, but they will measure beam diameter under those
specific conditions, not ultimate resolution.
transition from white to black contrast (for example, fuzziness
) of at least 5-mm horizontal width in the photographed image.
6.13 Rotate the specimen, not the scan, and shift the field of
view on the specimen so that the desired edge is oriented
perpendicular to the horizontal scan direction near the center of
the CRT.
NOTE 1—The performance measurement must be repeated for each kV
setting used.
6.7 Saturate the filament and check both filament and gun
alignment for any necessary adjustment. Allow time for stabilization.
6.14 Make sure that no gamma or derivative processing is
employed.
6.8 Set all lens currents at a resettable value with the aid of
a suitable digital voltmeter, if available and allow time for
stabilization.
6.15 Obtain a line-trace photograph across the desired edge
using a recording time of at least 60 s. (See Fig. 2.)
6.15.1 Caution—Slow scan rates in the line-trace mode
may cause burning of the CRT-screen phosphor for improperly
adjusted analog SEM-CRT screens.
6.9 Cycle lens circuits OFF-ON two to three times to
minimize hysteresis effects. An alternate procedure may be
used to drive the lens through a hysteresis loop—increase
current above operating current, decrease below operating
current, then back up to operating current.
6.10 Adjust lens apertures and stigmator for optimum resolution (minimum astigmatism). Because of its higher
resolution, the secondary electron imaging mode is most
commonly used. This procedure may also be used to characterize SEM performance in the backscattered electron imaging
mode.
6.11 Locate a field on the chosen specimen that shows the
desired edge detail. (See Fig. 1.) Avoid tilting the stage since
this will change the magnification due to image foreshortening.
6.12 Select the highest magnification that is sufficient to
allow critical focusing of the image and shows image-edge
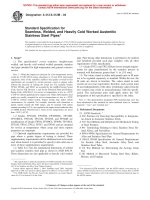
FIG. 2 Typical Waveform With 20 and 80 % Contrast Levels Illustrated
4
Newbury, D. E., “Imaging Strategy for the SEM–A Tutorial,” SEM, Vol. 1,
1981, pp. 71–78.
2
E986 − 04 (2017)
6.16 Locate the maximum and minimum Y-axis deflections
across the edge of the specimen in the line-trace photograph.
(See Fig. 2.)
6.17 The difference between these values is the full-edge
contrast produced in the line trace. From this contrast value,
compute the Y-axis positions that correspond to contrast levels
of 20 and 80 % of the full-contrast value.
20 % level 5 0.2 3 ~ γ max 2 γ min! 1γ min
(1)
80 % level 5 0.8 3 ~ γ max 2 γ min! 1γ min
(2)
6.17.1 These levels are illustrated schematically on Fig. 2.
Locate these positions in the line-trace photograph and measure the horizontal distance (D) in mm on the photograph
between these points. The slope of the line trace should have a
ratio (Y/D) of 2 to 4. The distance (D) should range between 2
to 4 mm. The performance parameter (P), expressed in
nanometres, is then defined as follows:
P 5 ~ D 3 106 ! /M
(3)
where M is the SEM calculated and corrected magnification
using an acceptable standard.
6.18 Photograph the field selected for later reference to aid
in the location of the image edge used for the performance
measurement.
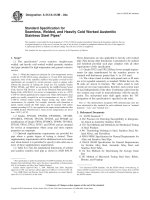
6.19 Repeat the line-trace photograph and measurement
process outlined in 6.15 through 6.17 at two additional edges in
the material studied. Three waveform traces using a graphitefiber edge are shown in Fig. 3.
6.20 Average the three results to produce the performance
parameter (P).
@ P 5 ~ P 1 1P 2 1P 3 ! # /3
FIG. 3 Set of Waveforms Measured to Determine Performance
Parameter (P) (Eq 1)
7.2 Another source of uncertainty arises from edge effects
including transmission of electrons through the edge of the
specimen when the beam diameter is very small.
8. Reproducibility
(4)
8.1 Reproducibility of the performance parameter may be
determined by repeating the steps in Section 6 at intervals
determined by the user’s requirements. Measurement of performance is recommended after repair or realignment of the
electron optical functions or after major changes in instrumentoperating parameters, for example, beam voltage or lens
settings, or both. A listing of instrument parameters that
influence the performance is included in the Annex of Practice
E766.
7. Precision and Bias
7.1 At the present time, it is not possible to give a specific
value for the precision and bias of the performance test based
on extensive experience. However, the sources of error and
their best estimates of uncertainties at a SEM magnification of
80 to 50 000 × under controlled operating conditions and with
experienced operators, are as follows:
Source
SEM magnification (M)
Measurement variation between
operators
Measurement of waveform (D)
Approximate overall uncertainty
Uncertainty, %
9. Keywords
±10
±2
9.1 electron beam size; E766; graphite fiber; magnification;
NIST–SRM 2069B; resolution; SEM; SEM performance; spot
size; waveform
±2
11
ASTM International takes no position respecting the validity of any patent rights asserted in connection with any item mentioned
in this standard. Users of this standard are expressly advised that determination of the validity of any such patent rights, and the risk
of infringement of such rights, are entirely their own responsibility.
This standard is subject to revision at any time by the responsible technical committee and must be reviewed every five years and
if not revised, either reapproved or withdrawn. Your comments are invited either for revision of this standard or for additional standards
and should be addressed to ASTM International Headquarters. Your comments will receive careful consideration at a meeting of the
responsible technical committee, which you may attend. If you feel that your comments have not received a fair hearing you should
make your views known to the ASTM Committee on Standards, at the address shown below.
This standard is copyrighted by ASTM International, 100 Barr Harbor Drive, PO Box C700, West Conshohocken, PA 19428-2959,
United States. Individual reprints (single or multiple copies) of this standard may be obtained by contacting ASTM at the above
address or at 610-832-9585 (phone), 610-832-9555 (fax), or (e-mail); or through the ASTM website
(www.astm.org). Permission rights to photocopy the standard may also be secured from the Copyright Clearance Center, 222
Rosewood Drive, Danvers, MA 01923, Tel: (978) 646-2600; />
3