Astm e 1865 97 (2013)
Bạn đang xem bản rút gọn của tài liệu. Xem và tải ngay bản đầy đủ của tài liệu tại đây (411.99 KB, 19 trang )
Designation: E1865 − 97 (Reapproved 2013)
Standard Guide for
Open-Path Fourier Transform Infrared (OP/FT-IR) Monitoring
of Gases and Vapors in Air1
This standard is issued under the fixed designation E1865; the number immediately following the designation indicates the year of
original adoption or, in the case of revision, the year of last revision. A number in parentheses indicates the year of last reapproval. A
superscript epsilon (´) indicates an editorial change since the last revision or reapproval.
1. Scope
3. Terminology
1.1 This guide covers active open-path Fourier transform
infrared (OP/FT-IR) monitors and provides guidelines for
using active OP/FT-IR monitors to obtain concentrations of
gases and vapors in air.
3.1 For definitions of terms relating to general molecular
spectroscopy used in this guide refer to Terminology E131. A
complete glossary of terms relating to optical remote sensing is
given in Ref (1).4
1.2 The values stated in SI units are to be regarded as
standard. No other units of measurement are included in this
standard.
1.3 This standard does not purport to address all of the
safety concerns, if any, associated with its use. It is the
responsibility of the user of this standard to establish appropriate safety and health practices and determine the applicability of regulatory limitations prior to use.
3.2 Definitions:
3.2.1 background spectrum, n—a single-beam spectrum that
does not contain the spectral features of the analyte(s) of
interest.
3.2.2 bistatic system, n—a system in which the IR source is
some distance from the detector. For OP/FT-IR monitoring,
this implies that the IR source and the detector are at opposite
ends of the monitoring path.
3.2.3 monitoring path, n—the location in space over which
concentrations of gases and vapors are measured and averaged.
3.2.4 monitoring pathlength, n—the distance the optical
beam traverses through the monitoring path.
3.2.5 monostatic or unistatic system, n—a system with the
IR source and the detector at the same end of the monitoring
path. For OP/FT-IR systems, the beam is generally returned by
a retroreflector.
3.2.6 open-path monitoring, n—monitoring over a path that
is completely open to the atmosphere.
3.2.7 parts per million meters, n—the units associated with
the quantity path-integrated concentration and a possible unit
of choice for reporting data from OP/FT-IR monitors because
it is independent of the monitoring pathlength.
3.2.8 path-averaged concentration, n—the result of dividing
the path-integrated concentration by the pathlength.
3.2.8.1 Discussion—Path-averaged concentration gives the
average value of the concentration along the path, and typically
2. Referenced Documents
2.1 ASTM Standards:2
E131 Terminology Relating to Molecular Spectroscopy
E168 Practices for General Techniques of Infrared Quantitative Analysis (Withdrawn 2015)3
E1421 Practice for Describing and Measuring Performance
of Fourier Transform Mid-Infrared (FT-MIR) Spectrometers: Level Zero and Level One Tests
E1655 Practices for Infrared Multivariate Quantitative
Analysis
1
This guide is under the jurisdiction of ASTM Committee E13 on Molecular
Spectroscopy and Separation Science and is the direct responsibility of Subcommittee E13.03 on Infrared and Near Infrared Spectroscopy.
Current edition approved Jan. 1, 2013. Published January 2013. Originally
approved in 1997. Last previous edition approved in 2007 as E1865 – 97 (2007).
DOI: 10.1520/E1865-97R13.
2
For referenced ASTM standards, visit the ASTM website, www.astm.org, or
contact ASTM Customer Service at For Annual Book of ASTM
Standards volume information, refer to the standard’s Document Summary page on
the ASTM website.
3
The last approved version of this historical standard is referenced on
www.astm.org.
4
The boldface numbers in parentheses refer to a list of references at the end of
this standard.
Copyright © ASTM International, 100 Barr Harbor Drive, PO Box C700, West Conshohocken, PA 19428-2959. United States
1
E1865 − 97 (2013)
extracted, or returned to the laboratory for analysis. Detection
limits in OP/FT-IR depend on several factors, such as the
monitoring pathlength, the absorptivity of the analyte, and the
presence of interfering species. For most analytes of interest,
detection limits typically range between path-integrated concentrations of 1.5 and 50 ppm·m.
is expressed in units of parts per million (ppm), parts per
billion (ppb), or micrograms per cubic meter (µgm−3).
3.2.9 path-integrated concentration, n—the quantity measured by an OP/FT-IR monitor over the monitoring path. It has
units of concentration times length, for example, ppm·m.
3.2.10 plume, n—the gaseous and aerosol effluents emitted
from a stack or other pollutant source and the volume of space
they occupy.
3.2.11 retroreflector, n—an optical device that returns radiation in directions close to the direction from which it came.
3.2.11.1 Discussion—Retroreflectors come in a variety of
forms. The retroreflector commonly used in OP/FT-IR monitoring uses reflection from three mutually perpendicular surfaces. This kind of retroreflector is usually called a cube-corner
retroreflector.
3.2.12 single-beam spectrum, n—the radiant power measured by the instrument detector as a function of frequency.
3.2.12.1 Discussion—In FT-IR absorption spectrometry the
single-beam spectrum is obtained after a fast Fourier transform
of the interferogram.
3.2.13 synthetic background spectrum, n—a background
spectrum made by choosing points along the envelope of a
single-beam spectrum and fitting a series of short, straight lines
or a polynomial function to the chosen data points to simulate
the instrument response in the absence of absorbing gases or
vapors.
NOTE 1—The OP/FT-IR monitor can be configured to operate in two
modes: active or passive. In the active mode, a collimated beam of
radiation from an IR source that is a component of the system is
transmitted along the open-air path. In the passive mode, radiation emitted
from objects in the field of view of the instrument is used as the source of
IR energy. Passive FT-IR monitors have been used for environmental
applications, such as characterizing the plumes of smoke stacks. More
recently these systems have been developed to detect chemical warfare
agents in military applications. However, to date, the active mode has been
used for most environmental applications of OP/FT-IR monitoring. In
addition to open-air measurements, extractive measurements can be made
by interfacing a closed cell to an FT-IR system. This type of system can
be used as a point monitor or to measure the effluent in stacks or pipelines.
6. Description of OP/FT-IR Systems
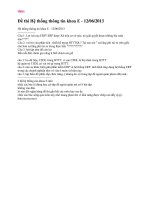
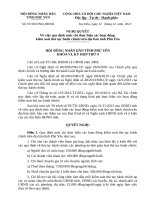
6.1 There are two primary geometrical configurations available for transmitting the IR beam along the path in active
OP/FT-IR systems. One configuration is referred to as bistatic,
while the other is referred to as monostatic, or unistatic.
6.1.1 Bistatic Configuration—In this configuration, the detector and the IR source are at opposite ends of the monitoring
path. In this case, the optical pathlength is equal to the
monitoring pathlength. Two configurations can be used for
bistatic systems. One configuration places the IR source,
interferometer, and transmitting optics at one end of the path
and the receiving optics and detector at the other end (Fig.
1(A)). Typically a Cassegrain or Newtonian telescope is used
to transmit and collect the IR beam. The advantage of the
configuration depicted in Fig. 1(A) is that the IR beam is
modulated along the path, which enables the unmodulated
ambient radiation to be rejected by the system’s electronics.
The maximum distance that the interferometer and the detector
can be separated in this configuration is limited because
communication between these two components is required for
timing purposes. For example, a bistatic system with this
configuration developed for monitoring workplace environments had a maximum monitoring pathlength of 40 m (5). The
other bistatic configuration places the IR source and transmitting optics at one end of the path and the receiving optics,
interferometer, and detector at the other end of the path (Fig.
1(B)). This is the most common configuration of bistatic
systems in current use. In this configuration the beam from the
IR source is collimated by a mirror shaped as a paraboloid. The
configuration shown in Fig. 1(B) allows the maximum monitoring path, in principle, to be doubled compared to that of the
monostatic configuration. The main drawback to this bistatic
configuration is that the IR radiation is not modulated before it
is transmitted along the path. Therefore, radiation from the
active IR source and the ambient background cannot be
distinguished by electronic processing.
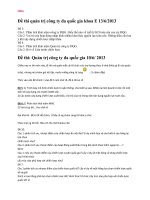
6.1.2 Monostatic
Configuration—In
monostatic
configurations, the IR source and the detector are at the same
end of the monitoring path. A retroreflector of some sort is
required at the midpoint of the optical path to return the beam
4. Significance and Use
4.1 This guide is intended for users of OP/FT-IR monitors.
Applications of OP/FT-IR systems include monitoring for
hazardous air pollutants in ambient air, along the perimeter of
an industrial facility, at hazardous waste sites and landfills, in
response to accidental chemical spills or releases, and in
workplace environments.
5. Principles of OP/FT-IR Monitoring
5.1 Long-path IR spectrometry has been used since the
mid-1950s to characterize hazardous air pollutants (2). For the
most part, this earlier work involved the use of multiple-pass,
long-path IR cells to collect and analyze air samples. In the late
1970s a mobile FT-IR system capable of detecting pollutants
along an open path was developed (3). The 1990 amendments
to the Clean Air Act, which may require that as many as 189
compounds be monitored in the atmosphere, have led to a
renewed interest in OP/FT-IR monitoring (4). The OP/FT-IR
monitor is a spectrometric instrument that uses the mid-IR
spectral region to identify and quantify atmospheric gases.
These instruments can be either transportable or permanently
installed. An open-path monitor contains many of the same
components as those in a laboratory FT-IR system, for example
the same types of interferometers and detectors are used,
except that the sample volume consists of the open atmosphere.
In contrast to more conventional point monitors, the OP/FT-IR
monitor provides path-integrated concentration data. Unlike
many other air monitoring methods, such as those that use
canisters or sorbent cartridges, the OP/FT-IR monitor measures
pollutants in situ. Therefore, no samples need be collected,
2
E1865 − 97 (2013)
FIG. 1 Schematic Diagram of the Bistatic OP/FT-IR Configuration Showing (A) a System with the IR Source and Interferometer at One
End of the Path and the Detector at the Opposite End, and (B) a System with the IR Source at One End of the Path and the Interferometer and Detector at the Opposite End
Because this loss of energy decreases the signal-to-noise ratio
(S/N), it can potentially be a significant drawback of this
configuration.
to the detector. Thus, the optical pathlength is twice the
distance between the source and the retroreflector. Two techniques are currently in use for returning the beam along the
optical path in the monostatic configuration. One technique
uses an arrangement of mirrors, such as a single cube-corner
retroreflector, at one end of the path that translates the beam
slightly so that it does not fold back on itself (Fig. 2(A)). The
other end of the path then has a second telescope slightly
removed from the transmitter to collect the returned beam.
Initial alignment with this configuration can be difficult, and
this type of monostatic system is normally used in permanent
installations rather than as a transportable unit. Another configuration of the monostatic monitoring mode uses the same
telescope to transmit and receive the IR beam. A cube-corner
retroreflector array is placed at the end of the monitoring path
to return the beam (Fig. 2(B)). To transmit and receive with the
same optics, a beamsplitter must be placed in the optical path
to divert part of the returned beam to the detector. A disadvantage to this configuration is that the IR energy must traverse
this beamsplitter twice. The most efficient beamsplitter transmits 50 % of the light and rejects the other 50 %. Thus, in two
passes, the transmission is only 25 % of the original beam.
7. Selection of Instrumental Parameters
7.1 Introduction and Overview—One important issue regarding the operation of OP/FT-IR systems is the appropriate
instrumental parameters, such as measurement time,
resolution, apodization, and degree of zero filling, to be used
during data acquisition and processing. The choice of some of
these parameters is governed by the trading rules in FT-IR
spectrometry and by specific data quality objectives of the
study.
7.2 Trading Rules in FT-IR Spectrometry—The quantitative
relationships between the S/N, resolution, and measurement
time in FT-IR spectrometry are called “trading rules.” The
factors that affect the S/N and dictate the trading rules are
expressed in Eq 1, which gives the S/N of a spectrum measured
with a rapid-scanning Michelson interferometer (6):
S
U v ~ T ! ·θ·∆v·t 1/2 ·ξ·D*
5
N
~ A D ! 1/2
3
(1)
E1865 − 97 (2013)
FIG. 2 Schematic Diagram of the Monostatic OP/FT-IR Configuration Showing (A) a System with a Retroreflector that Translates the
Return IR Beam to Separate Receiving Optics, and (B) a System that Uses the Same Optics to Transmit and Receive the IR Beam
addition, varying signals cannot be added linearly in the
interferogram domain. Nonlinearities and bandshape distortions will be observed if the concentrations of gases in the path
vary appreciably during the measurement time.
where:
Uv(T) = spectral energy density at wavenumber v from a
blackbody source at a temperature T,
θ
= optical throughput of the spectrometric system,
∆v
= resolution of the interferometer,
t
= measurement time in seconds,
ξ
= efficiency of the interferometer,
D*
= specific detectivity, a measure of the sensitivity of
the detector, and
= area of the detector element.
AD
7.4 Resolution—Several factors must be considered when
determining the optimum resolution for measuring the IR
spectra of gases and vapors along a long, open path. These
factors include (1) the ability to distinguish between the
spectral features of target analytes and those of ambient
interfering species in the atmosphere, such as water vapor; (2
) the tradeoffs between resolution, IR peak absorbance, and
S/N; (3) practical considerations, such as measurement time,
computational time to process the interferogram, and the size
of the interferogram file for data storage; (4) procedural
considerations, such as the choice of background spectrum and
the development of an adequate water vapor reference spectrum; and (5) logistical considerations, such as the size and the
cost of the instrument.
7.4.1 Effect of Resolution on S/N Ratio—The S/N is directly
related to the resolution, ∆v, although this relationship is not as
straightforward as implied in Eq 1. If the physical parameters
of the spectrometer, such as the measurement time, optical
throughput, and the interferometer efficiency, are assumed to
be constant for measurements made at both high and low
resolution, the S/N will be halved upon decreasing the quantity
∆ v by a factor of 2 (for example, changing the resolution from
1 to 0.5 cm−1). Because the S/N is proportional to the square
NOTE 2—This equation is correct but assumes that the system is
detector noise limited, which is not always true. For example, source
fluctuations, the analog-to-digital converter, or mechanical vibrations can
contribute to the system noise.
7.3 Measurement Time—As shown in Eq 1, the S/N is
proportional to the square root of the measurement time (t1/2).
For measurements made with a rapid scanning interferometer
operating at a constant mirror velocity and a given resolution,
the S/Nincreases with the square root of the number of
co-added scans. The choice of measurement time for signal
averaging in OP/FT-IR monitoring must take into account
several factors. First, a measurement time must be chosen to
achieve an adequate S/N for the required detection limits.
However, because monitoring for gases and vapors in the air is
a dynamic process, consideration must be given to the temporal
nature of the target gas concentration. For example, if the
concentration of the target gas decreases dramatically during
the measurement time, then there would be a dilution effect. In
4
E1865 − 97 (2013)
bands with contours of approximately 20 cm−1, the linear
relationship between absorbance and concentration is more
likely to be followed at lower resolution.
root of the measurement time, the measurement time required
to maintain the original baseline noise level must be increased
by a factor of 4 each time ∆v is decreased by a factor of 2 for
measurements made at a constant optical throughput. However,
the optical throughput does not necessarily remain constant
when the resolution is changed. In low-resolution
measurements, a large optical throughput is allowed for the
interferometer, and the throughput is limited by the area of the
detector element or the detector foreoptics. The throughput of
OP/FT-IR systems is generally limited by the size of the
telescope and the pathlength, not the FT-IR spectrometer. Most
commercial low-resolution FT-IR spectrometers operate with a
constant throughput for all resolution settings. Instruments
capable of high-resolution measurements are equipped with
adjustable or interchangeable aperture (Jacquinot) stops installed in the source optics that reduce the solid angle of the
beam passing through the interferometer. Spectra collected at
high resolutions are generally measured with a variable
throughput, which decreases as the spectral resolution improves. In high-resolution measurements made under variable
throughput conditions, the throughput is halved as ∆v is
decreased by a factor of 2. This results in an additional
decrease in the S/N by one-half, which requires increasing the
measurement time by another factor of 4 to obtain the original
S/N. Thus, for high-resolution FT-IR spectrometers operating
under variable throughput conditions, the total measurement
time is increased by a factor of 16 when ∆ v is decreased by a
factor of 2. The preceding discussions apply only to the effect
of resolution on the baseline noise level. Resolution may also
affect the peak absorbance of the bands being measured. For a
weak and narrow spectral feature whose full width at half
height (FWHH) is much less than the instrumental resolution,
the peak absorbance will approximately double on decreasing
∆v by a factor of 2. Assuming this band was measured under
constant-throughput conditions, its S/N would be the same for
measurements taken at the higher and lower resolution settings,
provided the measurement times are equal. For weak, broad
spectral features whose peak absorbance does not change as a
function of resolution, acquiring data at a higher resolution will
only increase the baseline noise.
7.4.2 Effect of Resolution on Quantitative Analyses—The
determination of target gas concentrations by OP/FT-IR spectrometry depends on the linear relationship between IR absorbance and concentration as given by Beer’s law. This linear
relationship is observed only when the spectrum is measured at
a resolution that is equal to or higher than the FWHH of the
band. The measured spectrum is the convolution of the
instrument line shape function and the true band shape. As a
result, if the FWHH of the band is narrower than the instrumental function, the measured spectrum will vary only approximately linearly with concentration. For example, Spellicy
et al (4) have shown that the absorbance for a single Lorentzian
band with a FWHH of 0.1 cm−1 is linear with concentration
only
when measured at a high resolution, for example, 0.01
−1
cm . Deviation from linearity would most likely be observed
in small molecules such as HCl, CO, CO2, and H2O, which
have sharp spectral features (FWHH ≈ 0.1 cm−1). For larger
molecules, such as heavy hydrocarbons that exhibit broader IR
NOTE 3—The effect of resolution on quantitative OP/FT-IR measurements has been addressed by several groups, although a consensus on
what resolution is generally applicable has not yet been reached. The
optimum resolution to use is influenced by the choice of quantitative
analysis method. For example, if the scaled subtraction method is used,
high-resolution spectra can be used to advantage. Bittner et al (7) used
scaled subtraction to detect 5 ppb of benzene over a 100-m path. Spectra
recorded at 0.125-cm−1 resolution allowed the narrow benzene band at
674 cm−1 to be separated from the strong CO2 absorption bands. If a
multivariate analysis method is used, the absorption bands of the target gas
and interfering species do not need to be completely resolved. However,
the degree of spectral overlap does seem to affect the accuracy of some
multivariate techniques, such as classical least squares (CLS). For
example, Strang et al (8) used a closed-path FT-IR system equipped with
a 20.25-m multipass cell to monitor organic vapors and metal hydrides in
simulated workplace environments. Because of spectral overlap with other
target analytes, CO2, and water vapor, a resolution of 0.5 cm−1 was
required to quantify arsine, diborane, and phosphine with a CLS algorithm. Also, only the 0.5-cm− 1 resolution measurements exhibited a linear
relationship for all concentrations of diborane studied. Strang and Levine
(9) also observed little difference in the detection limits estimated for these
compounds at resolutions of 0.5, 2, 4, and 8 cm−1. However, diborane and
phosphine were difficult to quantify at 8-cm−1 resolution because of an
insufficient number of data points to define the absorption band used for
quantification. In a laboratory study using a 5-cm cell, Marshall et al (10)
found that, for selected volatile organic compounds (VOCs), the specificity and the accuracy of the CLS results deteriorated as the resolution was
degraded. Childers and Thompson (11) used CLS to analyze a set of
digitally created mixtures of spectra acquired on a bench-top FT-IR
system equipped with a 0.5-cm gas cell. In this study, the CLS algorithm
accurately quantified target analytes that exhibited spectra with overlapping sharp features, even when the bands used for analysis were not fully
resolved. Because the spectral mixtures were created digitally, Beer’s law
was always upheld. However, a failure to identify all of the overlapping
components in a mixture resulted in a bias and an increase in the error in
the CLS analysis. The accuracy of the CLS analysis was also not affected
by resolution for spectra with overlapping broad features. However, the
magnitude of the errors in the CLS analysis was related to the number of
data points per wavenumber in the spectra. Therefore, the errors in the
CLS analysis increased as the resolution degraded, if the degree of zero
filling was the same at each resolution. The magnitude of the errors in the
CLS analyses also increased proportionally with baseline noise. Other
multivariate techniques, such as partial least squares (PLS), may be
superior to CLS in dealing with nonlinearity due to low resolution and
severe spectral overlap. Griffiths et al (12) have suggested that because
many VOCs of interest have band contours roughly 20 cm−1 wide, a low
spectral resolution should be adequate for OP/FT-IR measurements. The
authors found that the PLS standard error of calibration and standard error
of prediction were at a minimum for measurements of VOC mixtures
made at 16-cm−1 resolution. A low-resolution OP/FT-IR monitor based on
this premise is currently being developed and evaluated.
7.5 Zero-Filling—The fast Fourier transform of a normal
interferogram generates spectral points of regular intervals.
When the interferogram contains frequencies that do not
coincide with the frequency sample points, the spectrum
resembles a “picket fence.” Extending the interferogram synthetically with zeros added to the end will increase the density
of points in the spectrum and reduce the picket fence effect.
Zero filling improves only the digital resolution, and not the
spectral resolution. Normally, some multiple (for example, 2,
4, etc.) of the original number of data points is added to the
interferogram. One order of zero filling, which is two times the
original number of data points, is usually appropriate. The
picket fence effect is less extreme if the spectral components
5
E1865 − 97 (2013)
a dilution effect. Nonlinearities and band distortions might be
observed due to adding a changing signal in the interferogram
domain.
7.7.2 Resolution—Although there is currently no consensus
among workers in the discipline of OP/FT-IR monitoring as to
the optimum resolution to be used to collect field data, the
following steps can be taken to choose the best resolution for
a particular application.
7.7.2.1 Consider the bandwidths of the absorption features
used to analyze for specific target gases. If the absorption bands
of the target gases are broad, there may be no need to acquire
high-resolution spectra. When this is the case, no additional
information will be gained, and the measurements will have
poorer S/N and will require longer data collection, longer
computational times, and larger data storage space. The analyst
must be aware, however, that the spectral features of atmospheric constituents such as CO2, H2O, and CH4 can be
completely resolved only at a resolution of 0.125 cm−1 or
better. Because these compounds are in every long-path spectrum and often overlap with the target analyte, access to
high-resolution data may be required to visualize the spectral
features of the target gas and to identify interfering species.
This information can then be used to develop the analysis
method.
7.7.2.2 Determine if interfering species are present. If the
comparison or scaled subtraction method is used for quantitative analysis (see 12.4), the resolution should be sufficient to
separate spectral features of the target gases from those of
interfering species.
7.7.2.3 Acquire reference spectra of the target gases. If the
specific target gases are known before beginning the monitoring study, reference spectra of the compounds of interest
should be obtained at various resolutions. By comparing the
spectra recorded at different resolutions, the operator can
determine the lowest resolution measurement that still resolves
the spectral features of interest. This resolution setting should
be used as a starting point for future measurements. If it is not
possible to record the reference spectra, the operator should
consult reference libraries to determine the resolution required
to characterize the target analyte.
7.7.2.4 Develop calibration curves of the target gases. If an
inadequate resolution is used, the relationship between absorbance and concentration will not be linear. This relationship is
also affected by the apodization function. Calibration curves
covering the concentration range of the target gases expected in
the ambient measurements should be developed at different
resolutions and with the use of different apodization functions
to determine the optimum settings. If the compound of interest
does not respond linearly with respect to concentration, a
correction curve will need to be applied to the data during
quantitative analysis.
7.7.2.5 Determine the effect of resolution on the other
procedures involved with generating OP/FT-IR data, such as
creation of a synthetic background and water-vapor-reference
spectrum. These procedures rely on a series of subjective
judgements based on the visual inspection of the field spectra.
Choices made in these procedures can be facilitated by using a
higher resolution.
are broad enough to be spread over several sampling positions.
It should be noted that zero filling does increase the file size
and, therefore, the time required for data processing.
7.6 Apodization—The finite movement of the interferometer
mirror truncates, or cuts off, the true interferogram. This, in
effect, multiplies the interferogram by a boxcar truncation
function. This function may cause the appearance of side lobes
on both sides of a narrow absorption band. The corrective
procedure for eliminating these side lobes is called apodization. Apodization is done by multiplying the interferogram by
a mathematical function. Typical apodization functions include
triangular, Happ-Genzel, and Norton-Beer functions. Apodization affects the spectral resolution, the peak absorbance, and
the noise of the spectrum. The absorbance of narrow or strong
bands will be most affected by the choice of apodization
function. In general, the bands in a spectrum computed with no
apodization will be more intense than bands computed from the
same interferogram after applying an apodization function.
Apodization also degrades resolution slightly. In general, to
obtain the optimum S/N for spectra of small molecules with
resolvable fine structure, the use of no apodization is preferable
if side lobes from neighboring intense bands do not present an
interference. If side lobes are present and interfere with either
qualitative or quantitative analyses, apodization becomes necessary. For broad absorption bands, the measured absorbance is
about the same in apodized and unapodized spectra. Overall,
the greatest noise suppression will be obtained with the
strongest apodization function, but the spectral resolution and
band intensities will be greatest for weaker apodization functions (6). The choice of apodization function also may affect
the quality of fit in multivariate analysis techniques. The same
apodization function should be used for the sample spectra as
was used for the reference spectra. Also, the same apodization
function should be used for spectral data that are to be
exchanged from one instrument to another for comparative
purposes.
7.7 Guidance for Selecting Instrumental Parameters—
Although a stepwise protocol that specifies instrumental parameters is not yet available for OP/FT-IR monitoring, the
operator should have an appreciation for the effect that the
instrumental parameters have on spectral measurements. Grasselli et al (13) have published criteria for presenting spectra
from computerized IR instruments, with an emphasis on FT-IR
measurements. The authors established recommendations and
guidelines for reporting experimental conditions, instrumental
parameters, and other pertinent information describing the
acquisition of FT-IR spectra. These guidelines should be
followed when reporting OP/FT-IR data. The following guidelines should be taken into account when choosing the optimum
instrumental parameters for OP/FT-IR measurements. The
parameters may need to be optimized for the specific experiments planned, taking into consideration the goals of the
monitoring study.
7.7.1 Measurement Time—First, determine the measurement time required to achieve the desired S/N at the selected
resolution. Then determine if this is an appropriate measurement time to capture the event being studied. If the measurement time is longer than the event being studied there will be
6
E1865 − 97 (2013)
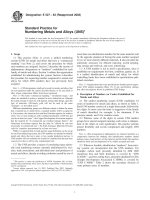
always opaque in this wavenumber region, even over short
paths. The opaque regions represent the baseline of the
single-beam spectrum and they should always be flat and
register zero. Any deviation from zero in these regions indicates that something is wrong with the instrument operation.
For example, the opaque regions are slightly elevated in Fig. 3.
This is due to internal stray light. This point is discussed in
more detail in 8.5. When the monitoring path is sufficiently
long (for example, 200-m) or the water vapor partial pressure
is high enough, for example, 1333-Pa (10-torr), an absorption
band should be noticeable at 2720 cm−1. This band is the
Q-branch of deuterated water (HDO) and it is also possible to
observe
the P (2700 to 2550 cm− 1) and the R (2750 to 2850
−1
cm ) branches. The spectral region around 3000 cm−1 is also
strongly impacted by water vapor, although it is not opaque.
The absorption features of methane are also in this region. The
atmosphere from 3500 to 3900 cm− 1 is opaque, again because
of water vapor. At sufficiently long monitoring paths (approximately 50 m) spectral features of CO (2040 to 2230 cm−1) and
N2O (2150 to 2265 cm−1) should be observed in the singlebeam spectrum. As in tests described in Practice E1421, the
intensity of the single-beam spectrum should be recorded for
different regions, for example, near 990, 2500, and 4400 cm−1,
to form a basic set of data about the instrument’s operation.
Regions that are not impacted significantly by water vapor
should be chosen. Along with this information, the operator
should record the pathlength and water-vapor concentration.
7.7.3 Zero Filling and Apodization—In general, a zero
filling factor of 2 should be used when processing the original
interferograms. Triangular and Happ-Genzel apodization functions are commonly used in OP/FT-IR monitoring, although
Griffiths et al (12) have indicated that a Norton-Beer medium
function actually gives a better representation of the true
absorbance. In all cases, however, the same parameters should
be used to collect the field spectra that were used to record the
reference spectra. The choice of apodization function may be
limited by this requirement. If spectra from a commercial or
user-generated library are to be the reference spectra for
quantitative analysis, then the parameters that were used to
generate those reference spectra should be used to collect the
field spectra. Otherwise, errors in the concentration measurement will occur.
8. Initial Instrument Operation
8.1 The assumption made for the following discussion is
that the manufacturer has set up the OP/FT-IR system and it is
performing according to specifications. The tests outlined in
this section should be performed before actual field data are
recorded. Many of the tests involving the initial instrument
setup are similar to those proposed for use in the quality
assurance/quality control (QA/QC) procedures presented in
Section 13 of this guide.
8.2 The Single-Beam Spectrum—The operator should become familiar with the features that are expected to be present
in a typical single-beam spectrum. A single-beam spectrum
acquired along a 414-m optical path at a nominal 1-cm−1
resolution is shown in Fig. 3. There are several features in the
spectrum that should be noted. First, the IR energy in the
regions from approximately 1415 to 1815 cm−1 and 3550 to
3900 cm−1 is totally absorbed by water vapor. For a given
pathlength, the width of the region for complete absorption
varies as the amount of water vapor in the atmosphere changes.
The strong absorption in the region from approximately 2235
to 2390 cm−1 is due to carbon dioxide. The atmosphere is
8.3 Distance to Detector Saturation—One of the first pieces
of information to obtain with an OP/FT-IR monitor is the
pathlength at which the detector becomes saturated. For
permanent installations in which the pathlength is fixed or
predetermined this should be a parameter specified to the
manufacturer. The distance at which the detector becomes
saturated is particularly important for mercury-cadmiumtelluride (MCT) detectors that are currently used in OP/FT-IR
systems. Detector saturation is not as severe of a problem for
thermal detectors, such as deuterated triglycine sulfate
detectors, which may be used in OP/FT-IR systems in the
future. The operator should pay particular attention to the
spectrum in the wavenumber region below the detector cutoff.
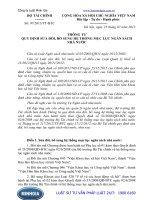
For the MCT detector used to generate Fig. 3, the detector
cutoff occurs between 600 and 700 cm−1. The spectrum below
the detector cutoff frequency should be flat and at the baseline.
If the spectrum has an elevated baseline in this wavenumber
region, the detector may be operating in a nonlinear manner. If
this is the case, nonphysical energy will appear well below the
detector cutoff as the retroreflector or IR source is brought
closer to the receiving optics. An example of this is given in
Fig. 4 for a single-beam spectrum recorded at a 20-m pathlength. The minimum of this artifact is not to be confused with
an absorption band due to CO2 near 668 cm−1 . The distance at
which the nonphysical energy appears represents the minimum
pathlength over which it is possible to operate without making
changes to the instrument. A test for determining the ratio of
the nonphysical energy to the maximum energy in the singlebeam spectrum is given in Practice E1421. If significant
nonphysical energy is observed at the desired monitoring
pathlength, it is possible to attenuate the IR beam, for example,
FIG. 3 Single-Beam OP/FT-IR Spectrum Along a 414-m Path with
Regions of Typical Atmospheric Absorption Features Annotated
7
E1865 − 97 (2013)
8.5 Determination of the Signal Due to Internal Stray Light
and Ambient Radiation—As shown in 8.2, single-beam spectra
recorded with an OP/FT-IR monitor may exhibit non-zero
signal intensities in wavenumber regions in which the atmosphere is totally opaque. This non-zero response can be
attributed to either internal stray light or ambient radiation
depending on the configuration of the OP/FT-IR monitor.
Internal stray light is most likely to be a problem in monostatic
systems that use a single telescope to transmit and receive the
IR beam (see Fig. 2(B)). As discussed in 6.1.2, this configuration requires an additional beamsplitter to direct the return IR
beam to the detector. This beamsplitter also diverts about 50 %
of the IR energy before it is transmitted along the monitoring
path. A portion of this diverted IR energy can be reflected by
surfaces within the instrument housing and sensed by the
detector without traversing the monitoring path. Ambient
radiation mostly affects bistatic systems in which the active IR
source is separated from the interferometer and detector (see
Fig. 1(B)). In principle, all radiation collected by the receiving
telescope is modulated by the interferometer and sensed by the
detector. Because the IR radiation from the active IR source is
not modulated as it propagates along the monitoring path in
this type of system, there is no way to distinguish it from other
IR sources in the field of view of the telescope. Therefore, the
detector response in this type of bistatic system represents a
composite of radiation from various IR sources. The presence
of stray light or ambient radiation causes errors in the photometric accuracy and ultimately errors in the concentration
measurements. Errors due to stray light or ambient radiation
can be larger than those caused by other instrumental sources
of error, such as source flicker. In general, if uncorrected for,
the presence of stray light or ambient radiation always causes
the concentration to be underestimated. For example, if stray
light represents 10 % of the total return signal, the resulting
calculated concentration will be approximately 10 % lower
than the actual concentration. The relative effect of stray light
or ambient radiation increases as the return signal decreases
and is amplified at low values of transmittance (high values of
absorbance). However, the effect of stray light and ambient
radiation is not uniform across the range of absorbance values
typically encountered in OP/FT-IR measurements. Therefore,
even if the field spectra are corrected for either stray light or
ambient radiation, the accuracy of the concentration measurements may still be affected. Thus, the relative contributions of
stray light or ambient radiation to the total signal should be
minimized. In bistatic systems, efforts to make the ambient
background as consistent as possible should be made. Hot
objects, objects that may undergo temperature differences
during the monitoring period, and the sky should not be in the
field of view of the instrument during data acquisition. In
monostatic systems, an excessive amount of internal stray light
indicates either a design or an alignment problem in the
transfer optics. Correction of excessive stray light problems
may require action by the manufacturer of the instrument.
8.5.1 Measurement of the Internal Stray Light—As mentioned previously, the problem of modulated, internal stray
light is most apparent in monostatic systems that use a single
telescope to transmit and receive the IR beam and require an
FIG. 4 Single-Beam OP/FT-IR Spectrum Recorded at a 20-m Total
Pathlength. The Nonphysical Energy Annotated in the Encircled
Area Indicates Detector Saturation
by using a fine wire mesh screen to cover the aperture. As a last
resort, it is possible to rotate the retroreflector or the IR source
to lower the signal strength and minimize the nonphysical
energy. Also, it is not useful to simply change the gain of the
detector preamplifier to lower the apparent beam intensity,
because the detector nonlinearity does not depend on gain.
8.4 Signal Strength as a Function of Distance—In OP/FT-IR
systems, the IR beam is collimated before it is transmitted
along the path. However, the beam will diverge as it traverses
the path. The size of the IR source determines the divergence
of the beam. Once the diameter of the beam is larger than the
retroreflector (monostatic system) or the receiving telescope
(bistatic system), the signal strength will diminish as the square
of the distance. The need to determine the relationship between
signal strength and distance is twofold. First, at some distance
the system noise will become an appreciable part of the signal.
Secondly, extraneous radiation can produce measurable signals
in OP/FT-IR systems. For example, monostatic systems with
the configuration depicted in Fig. 2(B) that use an additional
beamsplitter have some signal contribution due to internal stray
light. In bistatic systems that use an unmodulated, external IR
source (Fig. 1(B)), ambient radiation contributes to the total
signal. In both systems, the strength of the signal should be
maintained above the signal due to either stray light or ambient
radiation. To determine the signal strength as a function of
distance, start with the retroreflector or the IR source at the
minimum working distance as determined in 8.3, then move
the retroreflector or IR source back by some distance and
record the magnitude of the signal. For this test, the signal
strength can be determined by measuring either the peak-topeak voltage of the interferogram or the intensity of the
single-beam spectrum at a specific frequency. If the singlebeam intensity is monitored for this test, a wavenumber region
that does not contain water-vapor-absorption bands should be
used.
8
E1865 − 97 (2013)
additional beamsplitter in the path (see Fig. 2(B)). The stray
light in the instrument can be measured without regard to the
distance to the retroreflector. To measure the stray light in this
type of monostatic system, point the telescope away from the
retroreflector or move the retroreflector out of the field of view
of the telescope and collect a spectrum. A record of the stray
light spectrum should be made and compared to the singlebeam spectrum recorded at the selected working distance. An
example of the relative contribution of stray light to the total
signal in this type of monostatic system is given in Fig. 5. In
this case, the magnitude of the stray light is approximately 6 %
of the total return signal. Typically the stray light spectrum will
overlap with the minima of the field single-beam spectrum in
wavenumber regions in which the atmosphere is totally
opaque. The fine structure in the stray light spectrum from
4200 to 2900 cm−1 and 2200 to 1100 cm−1 is absorption due to
near-field water vapor. The percent contribution of stray light
to the total signal, while it varies with wavenumber, is typically
relatively constant over time, provided that the optical components or optical configuration of the system have not been
altered. Therefore, a stray light spectrum can be acquired at the
beginning of the monitoring period and updated as necessary.
Stray light can also be caused by strong sources of IR energy
that are in the field of view of the instrument. For example, the
sun may be in the instrument’s field of view during sunrise or
sunset, which might give rise to an unwanted signal that comes
from reflections inside the instrument.
8.5.2 Measurement of the Ambient Radiation—For bistatic
systems in which the active IR source is separated from the
spectrometer (see Fig. 1(B)), the signal due to ambient radiation will be measured along with the signal from the active IR
source. The signal due to ambient radiation can be measured by
blocking or turning off the IR source. An example of the
relative contribution of ambient radiation to the total signal in
this type of bistatic system is given in Fig. 6. The spectrum
obtained with the active IR source blocked or turned off is a
composite of several IR sources in the field of view of the
instrument, such as graybody radiators, the instrument itself,
and emission bands from molecules in the atmosphere. The
spectral distribution of a blackbody or graybody radiator
depends on the temperature and emissivity of the object as
described by Planck’s law. The wavelength at which the power
is a maximum varies inversely with temperature as described
by Wien’s displacement law. For example, the maximum
intensity of a 300 K blackbody source would be observed at
approximately 10 µm, or 1000 cm−1. Therefore, the effect of
ambient radiation is more pronounced in the fingerprint region,
but is less significant above 2000 cm−1. Because the spectrum
due to ambient radiation is temperature-dependent, its relative
contribution to the total signal will be variable. This variation
will most likely be greater than any other instrumental source
of noise. In addition, because the signal due to ambient
radiation depends on what is in the field of view of the
instrument, it will also depend on the distance between the IR
source and the receiver. The spectral characteristics of the
ambient signal can vary for different sites and can also change
with changing meteorological conditions throughout the day.
For example, if the clear sky is in the field of view of the
instrument, emission bands from stratospheric gases, such as
O3 and CO2, can be observed. These emission bands are
generally not observed on cloudy days. Because the characteristics of the ambient signal can change, this signal must be
recorded on a more frequent basis than the stray light signal.
Although a recommended schedule for recording the ambient
spectrum has not been determined for all situations, an ambient
spectrum is typically recorded once every half hour. This
FIG. 5 Single-Beam OP/FT-IR Spectra Recorded with a Monostatic
System over a 414-m Path with (A) the Telescope Slewed Away
from the Retroreflector. Spectrum A Represents the Total Return
Signal Whereas Spectrum B Represents the Signal Due to Stray
Light
FIG. 6 Single-Beam OP/FT-IR Spectra Measured with a Bistatic
System over a 207-m Path with (A) the IR Source On and (B) with
the IR Source Off. Spectrum Represents the Total IR Signal
Whereas Spectrum Represents the Signal Due to Ambient Radiation
9
E1865 − 97 (2013)
instrument’s geometry, but it should not shift over time. There
are two possible methods for determining wavenumber shifts
between two spectra. The first is to compare the peak maxima
in absorbance of the selected bands on the computer monitor.
A more sensitive method is to subtract the second absorption
spectrum from the first. For this test, the bands in the spectra
being subtracted must be of the same intensity or they must be
scaled to the same intensity prior to the subtraction operation.
After subtraction, wavenumber shifts will result in a feature
that appears to be the first derivative of the band shape. If a
change in resolution has occurred, but there is no peak shift, the
result will appear to have the shape of an “ M” or a “W,”
depending on which of the two spectra contains the broader
band. If there are no changes in the band from spectrum to
spectrum, then the result of subtraction will be random noise.
decision must be based on the site characteristics, meteorological conditions, the spectral region over which the analysis for
the target gas is performed, and the data quality objectives of
the study.
8.6 Determination of the Random Noise of the System—The
random noise of the system can be determined from an
absorption spectrum made from two single-beam spectra
recorded sequentially. These spectra are to be taken under the
same operating conditions and instrumental parameters as will
be used during acquisition of the field spectra. There should be
no time allowed to elapse between the acquisition of the two
spectra. Once the two spectra have been acquired, an absorption spectrum should be made by using one of the two spectra
as a background spectrum. Which spectrum is used for the
background is not important. Determination of the random
noise depends on the water-vapor concentration in the
atmosphere, so the water-vapor concentration should also be
monitored. The contributions of stray light and ambient radiation will be contained in these spectra. The random noise
should be measured as the root-mean-square (RMS) noise. The
actual wavenumber range over which the noise should be
calculated will vary with the number of data points per
wavenumber in the spectrum. A range of 98 data points is
optimum for the RMS noise calculation (14). For 1-cm−1
resolution with no additional zero filling, this means that the
RMS noise measurement should be made over an approximately 50-cm−1 region. The RMS noise should be determined
in wavenumber regions that are not significantly impacted by
water vapor, for example 958 to 1008 cm−1, 2480 to 2530
cm−1, and 4375 to 4425 cm−1. The magnitude of this noise
should be measured periodically (at least daily) and plotted on
a control chart to monitor the performance of the instrument.
These tests are similar to those described in Practice E1421.
9. Monitoring Site Considerations
9.1 Overview—There are two types of monitoring programs
for which field-site requirements must be discussed. One type
of program is a long-term effort with the instrument placed in
a permanent position. The second type is a short-term program
designed to take data at a site for a period from a few days to
a few weeks. The short-term program is more flexible in that
the path configuration can be based on the meteorological
conditions at the time of the monitoring program. Long-term
monitoring programs must be designed to allow for changes in
the direction of the path as dictated by changing meteorological
conditions. The United States Environmental Protection
Agency (USEPA) has prepared a set of changes to Part 58 of
Chapter 1 of Title 40 of the Code of Federal Regulations
(40CFR58)5 that define the appropriate ambient air monitoring
criteria for open-path monitors (16). These amendments specifically address the monitoring of the criteria pollutant gases
O3, CO, NO2, and SO2. The amendments are significant in that
they describe how the path is to be chosen in terms of
obstructions and height above the ground. They also describe
the appropriate positioning of the path in relation to buildings,
stacks, and roadways.
8.7 Determination of Wavenumber Shifts and Resolution
Changes—A test to determine if wavenumber shifts or changes
in resolution have occurred should be conducted whenever the
OP/FT-IR monitor has been moved to change the path, optical
components in the system have been changed or realigned, or
the instrument has been disassembled, shipped, or reassembled. Bands that are known to be singlets and that are
always present in OP/FT-IR spectra can be used for this test.
For example, water vapor has absorption bands at 1010, 1014,
and 1017 cm−1 that will be in every spectrum as long as the
product of the water vapor concentration and the pathlength is
large enough. The bands at 1010 and 1017 cm−1 are actually
doublets and cannot be resolved at 1-cm−1 resolution. The band
at 1014 cm− 1 is a singlet and can be used as a check for
wavenumber shifts and resolution. Wavenumber shifts can also
be measured by using the HDO bands in the 2720-cm−1 region,
or with other absorption bands in the higher wavenumber
region of the spectrum. Measurements at the high wavenumber
region (short wavelength) are more sensitive to changes in the
instrument, such as interferometer misalignment, than are those
made in the lower wavenumber region (long wavelengths). The
HITRAN database (15) can be used as a guide to determine the
positions of the water vapor bands, as well as bands for other
atmospheric constituents. For any particular instrument, the
band assignment may be slightly different because of the
9.2 Selecting the Pathlength—Several factors must be considered when selecting the pathlength. These factors include
(1) instrumental parameters, such as the S/N of the system, the
divergence of the IR beam, and the distance at which the
detector saturates; (2) the characteristics of the target gases,
such as anticipated concentrations and known absorptivities;
(3) the presence and concentrations of interfering species; (4)
meteorological data, such as wind direction and speed; and (5)
physical constraints, such as the area of the emission source,
the extent of the plume, and the availability of electrical power
and suitable sites to accommodate the instrument and peripherals.
9.2.1 The Longest Path—There are several factors that
influence the determination of the longest usable path. The
signal strength decreases with an increase in pathlength. The
reason for this is twofold. First, the IR energy is absorbed by
5
Available from the Office of Federal Register, National Archives and Records
Administration, Washington, DC. This document is also available in most public
libraries.
10
E1865 − 97 (2013)
9.2.3 Short Path Versus Long Path—As shown in 9.2.2, the
selection of the pathlength begins by calculating the minimum
usable pathlength from Beer’s law. If a retroreflector is used,
the physical path can be half the optical path determined
previously. This is advantageous when plumes of finite size are
being measured because the pathlength may be chosen to be
close to the physical extent of the plume. For homogeneously
distributed gases, the path can be made longer with some
advantage. But for plumes of finite extent, making the path
longer than the width of the plume is detrimental. This is
because the OP/FT-IR measurement actually determines the
path average concentration, and if a portion of the path has zero
concentration, there is a dilution effect. In practice, it is
judicious to have the pathlength nominally longer than the
width of the plume to account for slight variations in the plume
over time. Another reason for choosing a path that is as short
as possible is to minimize the effects of spectral interferences.
For long-term monitoring programs with permanent
installations, the only real option is to place retroreflectors or
IR sources (depending on the instrument configuration) at
various distances and switch from one to the other periodically
or on some predetermined schedule. Some versions of OP/
FT-IR monitors incorporate a scanning system that facilitates
this procedure. Currently, almost no research has been done to
define the optimum pathlength for various conditions. Thus,
selection of the pathlength must be repeated for each individual
monitoring program.
9.2.4 Prevailing Winds—Many applications involving OP/
FT-IR monitoring depend on the wind to transport the pollutants being emitted by a source and deliver them to the
monitoring path. Knowledge of the prevailing winds is important when setting up the path for long-term monitoring
programs, but may be much less important for short-term
programs. The short-term program usually demands that the
operator be prepared to change the path configuration when the
wind changes. For either the long-term or the short-term
program, the ideal situation is to have more than one retroreflector or IR source. This capability allows the path direction
and length to be altered in response to changes in the wind
direction without having to transport the instrument itself. As
mentioned previously, some versions of OP/FT-IR monitors
incorporate a scanning system that allows the direction of the
beam to be changed rapidly. Another way to deal with changes
in wind direction is to use a plane mirror to reflect the beam so
that the path encompasses the perimeter of the source. When
emission rates need to be calculated from data taken with an
OP/FT-IR system, the wind direction and speed must be
known. The direction of the path with respect to the wind must
also be known. A knowledge of the historical prevailing winds
is of little use for this task. When emission rates are required,
the wind speed and direction as a function of position and time
(that is, the wind field) at the path must be measured directly.
9.2.5 Slant Path Versus Horizontal Path—Path orientation
is important because the wind is the primary mode of transportation of the gases being monitored. A direct comparison
between a slant path and a horizontal path cannot be made due
to uncertainties in the wind field and the variability in the
target-gas concentrations. Wind speed and direction can
molecules in the beam. Secondly, at some point along the path,
the signal strength will decrease in proportion to the inverse
square of the pathlength. The minimum acceptable signal
should always be some factor above the signal due to noise,
stray light, or ambient radiation. The criterion for what is
considered to be the minimum acceptable signal will depend on
the data quality objectives of the monitoring study. The
maximum total pathlength may also be determined by the
presence of interfering species. Consider, for example, the
water vapor band at 1014 cm−1, which has an absorbance of
approximately 0.01 at a total pathlength of 30 m when the
water vapor pressure is 1333 Pa (10 torr). If an absorbance of
1 is considered the maximum quantifiable value allowable for
this band and it interferes in the region of analysis for the target
gas, then the maximum usable pathlength is about 3 km. For
gases that are distributed homogeneously along the path, the
atmosphere will be considered optically dense at some pathlength. Then for these gases that distance is the maximum
usable pathlength.
9.2.2 Shortest Path Requirements—The shortest path may
be dictated by the distance at which the detector becomes
saturated. Assuming that the instrument is operating linearly at
any potential distance, the shortest path for the target gas can
be calculated from the absorbance measured in a reference
spectrum of the target gas, a knowledge of the minimum
measurable absorbance, and the assumption that reciprocity
holds. First, the minimum concentration that is to be measured
must be chosen. Then, by using the minimum detectable
absorbance, the minimum path can be calculated as follows.
9.2.2.1 Measure the absorbance at the appropriate wavenumber for the target gas from a reference spectrum from
either a spectral library or data base (see 12.3). Record the
concentration-pathlength product at which this spectrum was
taken.
9.2.2.2 Calculate the absorptivity, a, for this gas by using
the following equation:
a 5 A r /b r c r
(2)
where:
Ar = absorbance of the reference spectrum at a specified
wavenumber,
br = pathlength at which the reference spectrum was
measured, and
cr = concentration of the reference standard.
9.2.2.3 Assume a minimum concentration that will be measured.
9.2.2.4 Set the minimum detectable absorbance at 3 times
the RMS baseline noise as measured under normal operating
conditions.
9.2.2.5 Calculate the minimum usable path (bm) from the
following:
b m 5 A m /acm
(3)
where:
Am = the minimum detectable absorbance determined in
9.2.2.4,
cm = the minimum concentration assumed in 9.2.2.3, and
a
= the absorptivity calculated in 9.2.2.2.
11
E1865 − 97 (2013)
change dramatically over small regions when measured close
to the ground. This is true not only because of the changing
terrain but also because the motion of the air (a wind) must at
least approach zero at the surface. There is some indication that
the concentration contours of gases become very complex with
altitude, at least in part because of turbulence. There are no
data in the OP/FT-IR literature that describe the variation of
concentration with altitude.
9.3 Changing the Path—If the plume from a source is being
monitored and the wind changes direction, the path should be
changed so that it encompasses the plume. Changing the path,
however, should be done in accordance with some predetermined criteria that consider the ramifications of the change. For
example, if the concentrations of fugitive emissions crossing a
fence line are being monitored, there is little point in changing
the direction of the path. Other than to account for changes in
the wind direction, a change in the pathlength should be
considered only for purposes of taking a background spectrum
or when spectral interferences from compounds, such as water
vapor, become so strong that the absorption due to the target
gases is completely masked.
9.4 Logistical Concerns—Many logistical concerns will be
site specific and will vary for each monitoring program. These
concerns may also be different for permanent installations or
short-term monitoring programs. Consideration must be given
to power requirements, mounting requirements, shelter, and
climate control. Some provision must be made to supply the
required electrical power to the spectrometer. In bistatic
systems with a remote IR source, an additional source of power
must be provided. Some systems can operate off of a portable
12-V power supply, such as a car or marine battery. For
quantitative work the output of the battery must be stabilized.
For short-term field studies, the spectrometer, the retroreflector,
or the remote IR source are typically mounted on transportable
tripods. For permanent installations, a more rigid mounting
system can be used. In either case, care should be taken to
isolate the OP/FT-IR monitor from vibrations. The OP/FT-IR
system should be protected from the elements. Exposure of the
retroreflector, remote IR source, telescopes, and other optical
components to corrosive gases should be limited. If exposure
of the optical components to a corrosive environment cannot be
avoided, some type of system to purge the surface of the optical
components should be devised to minimize this exposure.
Spectrometers with hygroscopic internal optics, such as a KBr
beamsplitter, must be purged with a dry, inert gas or hermetically sealed to prevent moisture from damaging the optics. An
alternative is to use ZnSe optical components. The spectral
response of many spectrometers is sensitive to changes in
ambient temperature. For example, the shape of the singlebeam spectrum can change dramatically with changes in
temperature. Also, in some instruments, the interferometer will
not scan at ambient temperatures below 5°C. Therefore, in
permanent installations, the temperature inside the shelter for
the spectrometer should be controlled. For short-term field
studies, the spectrometer can be covered in some type of
heated, insulating material.
9.5 Ancillary Measurements—There are several reasons
why some ancillary measurements must be made when taking
data with an OP/FT-IR monitor. One reason is the requirement
to take data that can be used for QA/QC purposes. Another
reason is that many programs will require a record of ancillary
data, such as wind speed and direction. Also, the amount of
water vapor in the atmosphere should be monitored because
there are currently too many unanswered questions about the
effect of water vapor on quantitative analysis methods. By far,
water vapor represents the strongest spectral interference, and
unless it is measured separately, questions may arise when the
target gas concentration data are interpreted. The ambient
pressure should also be recorded. At any one monitoring
location a small change in ambient atmospheric pressure may
be observed. In some cases, the data may have to be corrected
for these changes, for example, when acquiring data at a high
altitude, where the atmospheric pressure can be significantly
different from that at sea level. Guidance for selecting and
setting up the instruments for making meteorological measurements can be found in a USEPA handbook (17). Although this
handbook does not directly address open-path measurements, it
does provide useful information about meteorological instrumentation and measurements.
NOTE 4—A measurement of relative humidity is not satisfactory for use
in OP/FT-IR monitoring. The actual partial pressure of water vapor must
be found. If relative humidity is measured, then the temperature must also
be measured so that the partial pressure of water can be calculated by
consulting the Smithsonian psychrometric tables. These tables can be
found in the CRC Handbook of Chemistry and Physics (18).
10. Background Spectra
10.1 Need for a Background Spectrum—The physical law
that governs the determination of the target gas concentration is
Beer’s law. This law is defined in terms of absorption spectra,
which in OP/FT-IR monitoring are calculated from a singlebeam field spectrum and a single-beam background spectrum.
In conventional FT-IR systems there is no background spectrum taken simultaneously with the sample spectrum to null the
spectral features due to the IR source, beamsplitter, detector,
and interfering species in the path. To remove these background spectral features, the single-beam sample spectrum is
divided by a single-beam background spectrum, or I0 spectrum.
This operation generates a transmittance spectrum. The absorption spectrum is then calculated by taking the negative logarithm of the transmittance spectrum. Ideally, the background
spectrum is collected under the same experimental conditions
as those for the sample spectrum, but without the target gases
present. However, in OP/FT-IR monitoring it is not possible to
obtain the I0 spectrum directly because the target gas cannot be
removed from the atmosphere. There are currently five methods for obtaining I0. These methods are based on obtaining
synthetic, upwind, short-path, averaged, and iterative background spectra.
10.2 Synthetic Background Spectra—Synthetic background
spectra can be generated by selecting data points along the
envelope of a single-beam field spectrum and then fitting a
series of short, straight lines to the selected points. The data
points selected should not be on an absorption band or on the
continuum produced by unresolved absorption bands. Synthetic I0 spectra can be made that cover only selected wavenumber regions, or they can be made to cover the entire
12
E1865 − 97 (2013)
system has to be moved from one side of the source area to
another. Generally, an upwind background spectrum is taken
once at the beginning of the daily monitoring period and once
at the end. If the configuration can be set up so that the path is
on the side of the source area, a second retroreflector or IR
source can be used, and the I0 spectrum can be taken frequently
without having to transport the entire system from one place to
another.
wavenumber range of the FT-IR system. An example of a
synthetic spectrum is shown in Fig. 7. Some care must be used
when synthetic I0 spectra are generated so that distortions are
not introduced into the intensity function. The final spectrum
that is produced must follow the curvature of the single-beam
spectrum from which it is made and cannot have artificial dips
or peaks. Creation of a synthetic background spectrum over
wavenumber regions that contain broad spectral features can be
difficult. This method seems to work best when analyzing for
compounds with narrow spectral features. A less subjective
method for generating a synthetic background spectrum fits a
series of segmented polynomial curves to a field single-beam
spectrum (19).
10.4 Short-Path Background Spectra—Another possible
technique for obtaining the I0 spectrum is to bring the retroreflector or IR source close to the receiving telescope. This
effectively eliminates the absorption caused by the target gases
and minimizes the absorption caused by interfering species,
such as water vapor. One problem with this method is that the
detector can be saturated at short paths because too much IR
radiation is incident on the detector element (see 8.3). Necessary checks for a short-path background spectrum include
inspection of the spectral region below the detector cutoff
frequency for nonphysical energy, comparison of the curvature
in the short-path spectrum with the curvature of the field
spectra, and determination of wavenumber shifts or resolution
changes. One difficulty with obtaining a short-path background
is deciding on an appropriate distance for placing the retroreflector or IR source. In addition to the potential for detector
saturation, there is a second difficulty with monostatic systems.
In monostatic systems the retroreflector will subtend different
angles when it is positioned at different distances from the
receiving telescope. If the interferometer does not have a
Jacquinot stop, the retroreflector may be the actual optical field
stop of the instrument. Changing the pathlength can cause
distortions in the spectrum. When the pathlength is increased,
the retroreflector subtends smaller angles, and the instrument
uses different cones of light. This problem can be overcome by
placing a field stop in the instrument so that it uses a smaller
field of view than the smallest anticipated from the retroreflector. However, placement of field stops in the optical train of the
instrument is a job for the manufacturer, and can’t be done
without potentially causing other problems. If two retroreflectors or IR sources are available, measurement of a short-path
background is fairly easy to perform, provided that the concerns mentioned previously are addressed. The OP/FT-IR
monitor can be pointed first to one retroreflector and then the
other quite easily with some regularity.
10.3 Upwind Background Spectra—For short-term monitoring efforts, the path is generally chosen to be perpendicular to
the wind field. If the area of the source is relatively small and
its upwind side is accessible, an upwind I0 spectrum can be
acquired. A usable background spectrum can also be acquired
by taking data along the side of the source as long as the wind
is not blowing across the source area and transporting the
emissions across the path used for the I0 spectrum. Another
technique for acquiring an upwind background spectrum is to
wait until the wind shifts so that the monitoring path is along
an upwind side of the pollutant source. This works well for
isolated sources, but if there are other local sources emitting
pollutants, this method can lead to errors in identifying and
quantifying what is being emitted from the source under study.
There are some advantages, however, to taking upwind background spectra this way. First, it is likely that sources are not
isolated and the chemical species of interest are emanating
from several locations. The compounds entering the area being
investigated are thus included in the upwind background
spectrum. Therefore, the measured concentrations of the target
gases can be attributed to the local source. There are also some
disadvantages to using upwind background spectra. It is
difficult to take upwind and downwind spectra frequently if the
10.5 Averaged Background Spectra—When the experimental conditions are fairly constant over a measurement period, it
is possible to average several single-beam field spectra that
have been taken over this time to create an I0 spectrum. These
spectra must have been analyzed and found to not contain any
measurable concentration of the target gas. This average I0 can
then be used for the entire data set for that period. However, the
experimental conditions often do not remain constant enough
to allow averaging to be performed. The water-vapor concentration is changing most of the time, and so is the concentration
of carbon dioxide. If other sources are in the area, the
concentrations of the gases emanating from them are not likely
to be constant. If any of these gases are also being monitored,
the use of an average I0 will not give a true background
spectrum that is representative of the entire monitoring period.
FIG. 7 Example of a Synthetic Background Spectrum (A) That
was Created from the Single-Beam Spectrum (B). The peak at
1111 cm−1 was Intentionally Left in as a Point of Reference
13
E1865 − 97 (2013)
spectra are available commercially. However, these spectra are
not generally suitable for use in the field for two reasons. First,
the concentration-pathlength product at which the commercial
reference spectra were recorded is too small. Secondly, the
band shapes of these spectra typically do not match those of the
field spectra because of slight differences in the instrument line
shape functions of the laboratory FT-IR system used to record
the reference spectra and the OP/FT-IR monitor used to record
the field spectra.
10.6 Iterative Background Spectra—Another method for
generating an I0 spectrum from previously collected field data
uses an iterative approach (20). In this method, an initial I0
spectrum is generated from one of the methods described
previously or is selected from archived data. This I0 spectrum
is used to generate an absorption spectrum from a single-beam
field spectrum. This absorption spectrum is then analyzed for
the target gases. If any target gases are detected, they are
subtracted in proportion to their concentration from this
absorption spectrum. A single-beam spectrum is then recreated
from the subtracted absorption spectrum by using the initial I0
spectrum. The recreated single-beam spectrum, without the
absorption features of the target gases, now becomes the I0 for
use with the next single-beam field spectrum collected. This
process can be automated and repeated for each sequential field
spectrum collected.
11.2 Water Vapor Spectra Considerations—Any singlebeam spectrum that exhibits a sufficient amount of water-vapor
absorption in the wavenumber region of interest can be used
for the production of a water vapor reference spectrum. Spectra
taken at short pathlengths or during very dry periods may not
be satisfactory. At some locations the water vapor partial
pressure has been observed to change from a low of less than
133 Pa (1 torr) in the winter to a high of approximately 4400
Pa (33 torr) during the summer. Changes in the water vapor
concentration of this magnitude, along with any instrument
changes, may require that a new water-vapor spectrum be
produced. Also, large changes in the water-vapor concentration
across the beam can occur over short time frames in refineries
and chemical manufacturing facilities where steam vents are
present. To account for these potentially large changes in
water-vapor concentrations along the path, a library of watervapor spectra can be created from field data acquired under
varying atmospheric conditions. It is the responsibility of the
operator to determine when the water-vapor spectrum has to be
remade, and no hard and fast rules on the frequency for
creating a new spectrum are presently available. If the estimated detection limits or confidence levels of the analysis
increase from one data set to another, a first step in determining
the cause is to compare the water-vapor reference spectrum
with the water vapor absorption features in the field spectra and
to compare trends in the measured target gas concentrations
with changes in water vapor concentration along the path. The
primary concern for the production of a water vapor spectrum
is that the final result must not contain any of the target gas. If
the water vapor spectrum contains even a small amount of a
target gas, the analysis will be in error by that amount. The ease
with which the absorption features of the target gas can be
removed from the water vapor reference spectrum depends on
many instrumental factors, such as resolution, and the process
can be quite time-consuming. The removal of the target gas
absorption is done by spectral subtraction and requires great
attention to detail. A suitable water-vapor spectrum can also be
generated from spectral databases, such as HITRAN. The
high-resolution bands calculated from HITRAN can be convolved with an appropriate instrument function to match the
spectral bands in the field spectra. Care must be taken to
maintain the proper band shapes and relative band intensities
when manipulating the high-resolution data.
10.7 General Advice About Background Spectra—
Acquisition of the I0 spectrum represents one of the more
difficult tasks associated with using an OP/FT-IR monitor.
Little information has been published on the frequency at
which a new background spectrum should be acquired. There
is some evidence from experiments conducted with bench-top
laboratory FT-IR systems that indicates that a new I0 should be
taken for each sample spectrum. There is also some evidence
from long-term OP/FT-IR monitoring programs that indicates
that a single I0 can be used over an extended period of time
with no detrimental effects. Neither of these observations has
been corroborated by any in-depth study of the background
spectra in OP/FT-IR monitoring. The decision to acquire a new
background should be based on the data quality objectives of
the study. In any case, whenever any optical component (IR
source, mirrors, windows, etc.) is changed in the instrument, a
new background must be acquired. All of the currently used
methods for generating a background spectrum are fraught
with difficulties. No one method is generally accepted as the
best method for acquiring a suitable I0 spectrum. There are few
guidelines as to what represents a valid background spectrum
for the production of accurate data. Perhaps the most important
point is that the curvature of the background spectrum must be
very similar to the curvature of the single-beam field spectra.
Otherwise, abnormalities in the baseline of the generated
absorption spectra can cause errors in the concentration analysis.
11. Water Vapor Reference Spectra
11.1 Need for a Water Vapor Reference Spectrum—Water
vapor absorption bands are present in all regions of the mid-IR
spectral region, and these bands interfere with the spectrum of
almost every potential analyte. Because of this, the absorption
features of water vapor must be accounted for during the
analysis of field spectra. Some amount of the water-vapor
absorption is accounted for if there is water vapor absorption in
the background spectrum. However, when a synthetic background is used, all of the features due to water vapor will
appear in the absorption spectrum. It is possible to account for
the water vapor by considering it as an interfering species in
the analysis method. To do this, however, a water vapor
reference spectrum must be available. Water vapor reference
NOTE 5—In some applications, such as extractive or stack monitoring,
which involve elevated temperatures, the water vapor reference spectrum
must be acquired at the same temperature at which the field spectra are
collected. The relatively small temperature differences experienced in
ambient, open-path measurements do not significantly affect the relative
intensities of the water vapor bands.
14
E1865 − 97 (2013)
target gas remain in the water vapor reference spectrum. If the
analysis yields a positive value for the target gas, features from
the target gas were oversubtracted from the water vapor
reference spectrum. In either case, the target gas reference
spectrum must be scaled to the absorbance corresponding to
the concentration value calculated by the analysis, and this
amount of the target gas must be either added in or subtracted
out of the water vapor reference spectrum. At this point the
absorption spectra should be reanalyzed. These steps are to be
repeated until the concentration values calculated by the
analysis are near zero. Several back-to-back spectra should be
analyzed in this way to determine if the concentration values
are systematically or randomly distributed around zero.
11.3 General Process for the Production of a Water Vapor
Spectrum—The production of a water-vapor spectrum is a
multi-step process. A general procedure that can be followed to
produce a water vapor reference spectrum from field spectra is
given as follows.
11.3.1 Select two single-beam spectra that will be combined
into a water vapor absorption spectrum. The spectra selected in
this step should be at the same resolution as the field spectra.
The water-vapor spectrum should have the same or better S/N
as the field spectra. The water-vapor concentration for these
two spectra should be representative of the water-vapor concentration contained in the field spectra to be analyzed.
Curvatures and any other special features of the baselines of
these spectra should be the same as those of the field spectra
baselines over the wavenumber regions of interest.
11.3.2 Use one of the spectra to create a synthetic background spectrum. Either of the two spectra selected in 11.3.1
can be used to create a synthetic background that is then used
to create an absorption spectrum. The synthetic background
must be created over the same wavenumber region as will be
used for the final analysis. The wavenumber region can be
larger than that used for analysis, but it cannot be smaller. If the
analysis is to be done for more than one gas, the synthetic
background should be created in the spectral regions of all the
gases of interest at the same time. Otherwise, when the
absorption spectrum is created, some or all of the water-vapor
absorption will be ratioed out and the process will have to be
started over. If an upwind I0 is used here instead of a synthetic
background, the apparent water-vapor absorption will be a
result of the ratio of the two spectra. If the water vapor
concentrations along the monitoring path and the upwind path
are nearly the same, then the S/N of the water-vapor spectrum
created in this way will be poor. Therefore, use of a synthetic
background spectrum is recommended for this process.
11.3.3 Use the remaining spectrum (after 11.3.2) as the
sample spectrum and the newly created synthetic background
to create an absorption spectrum that is to be used as the water
vapor reference spectrum.
11.3.4 Subtract a reference spectrum of the target gas from
the absorption spectrum created in 11.3.3 to remove any
absorption features due to the target gas.
11.3.5 Record two single-beam spectra back to back as was
done in 8.6 in determination of the random noise. Create an
absorption spectrum from these two spectra by using one of the
spectra as the background. This spectrum should exhibit a flat,
featureless baseline. Determine visually that no target gas is
present in the absorption spectrum.
11.3.6 Analyze the spectra recorded in 11.3.5 for the target
gas or gases by using one of the methods described in Section
12. If a multivariate analysis method is used, designate the
newly created water vapor reference spectrum as an interfering
species.
11.3.7 Steps 11.3.4 – 11.3.6 are an iterative process. The
newly created water-vapor spectrum must be used in the
analysis of other spectra. The results of these analyses must be
examined to determine whether any of the target gas remains in
the water vapor reference spectrum. If the analysis yields a
negative value for the target gas, some features due to that
12. Data Analysis
12.1 The analysis of OP/FT-IR data includes generating an
absorption spectrum from the interferogram, developing or
obtaining the appropriate reference spectra, and then applying
the chosen analytical method to determine the concentration of
the target gases.
12.2 Generation of the Absorption Spectrum—A singlebeam field spectrum is generated and recorded for each
sampling period. A background spectrum is generated by one
of the methods described in Section 10. A transmittance
spectrum is then obtained by dividing the field spectrum by the
background spectrum. The absorption spectrum is obtained by
taking the negative logarithm of the transmittance spectrum.
The absorption spectrum is used for all further data analysis.
12.3 Generation of the Reference Spectrum—A reference
spectrum is usually generated by using a known concentration
of gas in a closed cell. The cell is usually at least 1-m long,
although it is preferable to use multipass cells with longer
pathlengths. A pure sample of gas mixed with an inert gas such
as nitrogen is used. The concentration of gas used to generate
the reference spectrum should yield a range of absorbance
values that match as closely as possible those expected to be
found in the field measurements. The system can use a flowing
stream of gas, but a total pressure of 1 atm should be
maintained in the cell. The production of reference spectra is an
exacting undertaking and requires great attention to the experimental details. It is unlikely that most users of the OP/FT-IR
technique will prepare their own reference spectra because
spectral libraries are available commercially. There is,
however, no independent organization responsible for validating the accuracy of these spectral libraries. Synthetic spectra of
the atmospheric gases can also be generated from the HITRAN
data base or from high-resolution laboratory data. Reference
spectra produced either in the laboratory or from spectral
databases must be generated at the temperature and pressure at
which the field measurements will take place.
12.4 Analytical Methods—After the reference spectra of the
target gases are obtained, the appropriate wavenumber region
for analysis must be selected. The selection should be based on
an examination of the reference spectra and the type of
analytical method chosen. Two issues must be addressed to
make this selection. Ideally, the gas should have a high
absorptivity in the selected region, and the region should be
15
E1865 − 97 (2013)
variate analysis methods the reader is referred to Practices
E1655 and a review by Haaland (21).
12.4.3.1 Classical Least Squares (CLS)—CLS is the most
widely used multivariate method for analyzing OP/FT-IR data.
The calibration model in CLS is Beer’s law, in which absorbance is represented as a linear function of concentration. The
CLS analysis finds the linear combination of reference spectra
that minimizes the sum of squared differences between the field
spectra and the linear combination of reference spectra. Because CLS uses the additive linear relationship between
absorbance and concentration, the spectral features of the
target gases and interfering species do not need to be resolved.
Also, CLS is a full spectrum method that, in principle, can be
used to analyze over the entire wavenumber range of the field
spectrum. In practice, the CLS analysis is typically performed
over smaller spectral regions, for example 100 cm−1 . A
spectral region that contains minimal spectral overlap, absorption bands that adhere to Beer’s law, and no baseline irregularities is generally chosen for the analysis. Several factors
must be taken into account when developing a CLS method.
First, all species that have absorption features in the analysis
region must be included in the calibration set of reference
spectra. Secondly, the CLS analysis assumes a linear relationship between absorbance and concentration. In practice, detector nonlinearities, inadequate spectral resolution, optically
dense absorption bands, and poor baseline modeling can lead
to deviations from Beer’s law. Some of these effects may be
accounted for in the calibration set of reference spectra and by
assuming the appropriate baseline model. However, the CLS
analysis should be performed in spectral regions where these
nonlinearities are not severe.
12.4.3.2 Partial Least Squares (PLS)—PLS is a factor
analysis method that, like CLS, is a full spectrum method. In
PLS, the calibration spectra are decomposed into the product of
two matrices. One matrix is the basis set of full-spectrum
loading vectors and the other is a matrix of scores of the
loading vectors for the field spectra. The loading vectors are
analogous to the pure component reference spectra in CLS,
whereas the scores can be modeled to be linear with concentration. The PLS method can be broken down into steps that
separately involve CLS calibration and prediction followed by
inverse least squares calibration. In the PLS prediction phase,
a least-squares procedure is used to find the best fit of the
loading vectors to the field spectrum. The scores of each
loading vector yielding the linear least-squares fit to the field
spectrum are then related to concentration with a separate
inverse least-squares analysis. The PLS method is not restricted to a direct physical model, such as Beer’s law. Thus, in
PLS, the spectral data are modeled empirically, which often
provides a better fit to the field data. Unlike CLS, the number
of factors used in PLS is not restricted to the number of known
species in the field spectra. Factors that correlate with the
concentrations of the species in the field spectra and also
account for the variance in the spectra are extracted by the PLS
method. Therefore, PLS is often better suited for handling
nonlinearities or other sources of variation in the field spectra
due to baseline deviations, inadequate resolution, and severe
spectral overlap. However, this greater flexibility is often
free of absorption bands from interfering species. If interfering
species are present they must be identified and accounted for in
the analysis method. Once an appropriate wavenumber region
is selected, data analysis can proceed. The concentration of the
unknown gas can be determined in three general ways, as
described below: the comparison, scaled subtraction, and
multivariate analysis methods. Each method uses a reference
spectrum of the gas being investigated. General methods of
infrared quantitative analysis are given in Practice E168.
12.4.1 Comparison Method—One method of determining
the concentration is to measure the absorbance at a particular
wavenumber and compare it with the absorbance of the
reference (ref) spectrum at the same wavenumber. Then, if
reciprocity holds (as implied by Beer’s law), the unknown (unk
) concentration of the target gas is obtained as follows.
A ref/A unk 5 b refc ref/b unkc unk
(4)
Solving for the unknown concentration gives the following:
c unk 5 c refb refA unk/b unkA ref
(5)
This concentration has the same units as that of the reference
spectrum.
12.4.2 Scaled Subtraction Method—The scaled subtraction
method is similar in principle to the comparison method. This
method is particularly useful if there are spectral features due
to interfering species that overlap with those of the target gas.
However, for scaled subtraction to be successful, either the
target gas or the interfering species should have at least one
unique absorption band. High-resolution data can be used to an
advantage with this method. Scaled subtraction can be done as
follows. Most software packages allow two spectra to be
subtracted interactively. In this case the reference spectrum
should be subtracted from the field spectrum until the absorption maximum of the band of interest is zero. Once the
subtraction is completed the software reports a scaling factor.
This factor can be multiplied by the concentration used to
generate the reference spectrum to obtain the concentration of
the target gas in the field spectrum. There is some operator skill
involved in subtracting spectra interactively; therefore, some
practice in using this method is recommended before the actual
field spectra are analyzed. Also, if there is an uncorrected
frequency shift between the OP/FT-IR system and the spectrometer on which the reference spectra were measured, the
scaled subtraction can give first derivative shaped residuals
(see 8.7).
12.4.3 Multivariate Analysis Methods—Multivariate analysis methods can be used to advantage when the concentrations
of several target gases are to be determined and several
interfering species are present. This is the case most often
encountered in OP/FT-IR monitoring, so some type of multivariate analysis method is generally preferred. There are
several methods that are used to perform multivariate analyses
of IR spectra, including Classical Least Squares (CLS), inverse
least squares, Partial Least Squares (PLS), and principal
components regression. The most common multivariate analysis methods used in OP/FT-IR monitoring are CLS and PLS.
Brief discussions of these two methods are given in the
following sections. For a more complete discussion of multi16
E1865 − 97 (2013)
Spectra taken at longer time intervals during the study can be
ratioed in this manner to determine baseline stability or
systematic noise.
gained at the expense of useful qualitative information. Also, in
comparison to CLS, the PLS method requires more extensive
calibration. To date, PLS has been applied to OP/FT-IR data on
a limited basis. However, Griffiths et al (12) have shown that
PLS can be used to advantage when analyzing low-resolution
spectra.
13.3 Stability of Instrument—Several aspects related to the
stability of the instruments can be measured. All of the
measurements in the following discussion should be recorded
on at least a daily basis and compared to existing data to
establish that the instrument is performing properly.
13.3.1 Noise Measurements—The noise measurements described in 13.2 should be taken daily and recorded on a control
chart to alert the operator of any changes or trends in the noise.
13.3.2 Signal Strength—The signal strength should be measured daily, or several times during the day. This can be
measured either as the single-beam intensity in a selected
wavenumber region or as the magnitude of the interferogram
centerburst. At this time, the position of the zero peak
difference of the interferogram should also be recorded, and the
single-beam spectrum should be examined for evidence of
system nonlinearity. The single-beam intensity should be
measured in different wavenumber regions to determine if the
characteristics of the IR source have changed or the interferometer alignment has changed. The high wavenumber portion
of the spectrum will be most sensitive to interferometer
misalignment and will show a decrease in intensity relative to
the other wavenumber regions if changes have occurred. The
signal strength also depends on atmospheric conditions. For
example, fog attenuates the beam intensity. Thus, the atmospheric conditions must be noted when this measurement is
taken. As with the noise measurements, the signal strength
should also be plotted daily on a control chart. A decrease in
signal could be related to a drop in the source intensity,
misalignment of the external optics, misalignment of the
interferometer optics, deterioration of the system optics, or a
loss in the detector Dewar hold time.
13.3.3 Wavenumber Shifts and Changes in Resolution—The
positions and FWHHs of selected absorption bands should be
recorded and monitored as discussed in 8.7 to detect wavenumber shifts or changes in instrumental resolution.
13. Quality Assurance and Quality Control
13.1 Recommendations for Tests to be Included in a QA/QC
Program for OP/FT-IR Monitors—Development of a QA/QC
program for OP/FT-IR monitoring should include, but not
necessarily be limited to, the tests discussed as follows. These
tests are designed to determine that the instrument is operating
properly and producing good data. Some of these issues were
discussed previously for the initial verification of instrument
performance in Section 8, but can be used for routine QA/QC
procedures as well. Other criteria for developing a QA/QC
plan, such as siting criteria or chain of custody for data, should
be addressed as warranted, but are not discussed here. General
guidance for developing a QA/QC program is given in a
USEPA document (22). Two separate issues must be addressed
in a QA/QC program. One issue is whether or not the
instrument is working properly. The other issue is if the
quantitative analysis method is producing the correct results. In
addition to the tests described here, level zero and level one
tests for measuring the performance of FT-IR spectrometers are
given in Practice E1421.
13.2 Noise Measurements—Measurements of two types of
noise, instrumental electronic noise and random baseline noise,
should be routinely taken.
13.2.1 Electronic Noise—The electronic noise should be
recorded periodically by placing opaque material in front of the
detector element while the detector is cooled. This signal is
indicative of the noise, for example 60-Hz electrical noise, of
the system with no detector signal. The magnitude of this
signal should remain relatively constant and typically contributes less than 0.25 % of the total signal. If some electrical
component of the system is producing spurious noise, it will
become apparent from this measurement.
13.2.2 Random Baseline Noise—Random baseline noise is
measured by recording back-to-back spectra after the detector
has been filled with liquid nitrogen and allowed to equilibrate.
One spectrum is then divided by the other, and the absorption
spectrum is calculated. The result is a spectrum of the random
system noise. The RMS noise in absorbance units can then be
calculated from these spectra. These spectra should be acquired
by using the same instrumental parameters to be used during
collection of field data. The RMS noise should be calculated in
a spectral region that is devoid of absorption due to water vapor
or other atmospheric gases. If not, changes in the concentrations of these ambient gases over the measurement time will
influence the magnitude of the noise calculations. Noise
measurements can also be taken over the spectral region
chosen for analysis of a target gas to give an estimate of
detection limits. For the baseline noise measurement, it is best
to record these two spectra back to back, as passage of time
between the two spectra might also include changes in atmospheric conditions or concentrations of species in the path.
13.4 Accuracy and Precision—The accuracy and precision
of OP/FT-IR measurements are difficult to determine. Accuracy
and precision can be estimated by using either ambient gas
concentrations or a short cell containing a known amount of the
target gas.
13.4.1 Ambient Gas Concentrations—The concentrations of
atmospheric gases, such as CH4 or N2O, can be used to a
certain extent for accuracy and precision measurements. These
gases have an average global concentration of approximately
1.7 ppm and 310 ppb, respectively. They are always present in
OP/FT-IR spectra, and no changes have to be made to the
instrument to measure these gases. If the ambient concentrations of these gases are assumed to be constant, precision
measurements can be made. For example, in one study, the
concentration of N2O measured continuously over a five-day
period was found to vary by only 6 3.5 % of the mean value
(23). On the other hand, CH4 concentrations have been
observed to change by a factor of 2.5 during a 5-h period.
Therefore, care must be taken to account for possible local
emission sources if ambient gases are used for QA/QC
17
E1865 − 97 (2013)
spectrum should then be compared to the reference spectrum
for proper features and intensities. Also, any time that the
concentrations of the target gases seem to correlate with
changes in water-vapor concentration, the spectra of the target
gases should be examined to verify that the changes in
concentration are real. If the concentrations of the target gases
exhibit either positive or negative inflections with respect to
changes in water-vapor concentration, the analysis method
should be altered to alleviate the problem.
13.4.5 Accuracy of Reference Spectra—If the instrument is
operating properly and a suitable analysis method is developed,
the accuracy of the OP/FT-IR technique will ultimately be
determined by the accuracy of the reference spectra. To date,
no way of validating or certifying these reference spectra
exists. The National Institute of Standards and Technology
(NIST) is currently addressing this issue. The analyst can
currently compare existing libraries to identify both qualitative
and quantitative errors, although some proprietary libraries
might not be accessible to all users.
purposes. Although ambient gases such as N2O can be used to
estimate the precision of OP/FT-IR measurements and to
indicate that the instrument is working properly, accuracy is
more difficult to determine. The accuracy of the concentration
measurement depends on several factors, including the choice
of analysis method, the type of background spectrum used, the
presence of interfering species and how they are accounted for
in the analysis method, and the accuracy of the reference
spectra, including the water vapor reference spectrum.
Therefore, for example, if the concentrations of N2O are used
for QA/QC purposes, the estimates of precision and accuracy
are valid only for N2O and will not necessarily be representative of the precision and accuracy for other target gases.
13.4.2 Short Gas Cell—An alternative approach to using
ambient gases for QA/QC data is to insert a short gas cell that
contains a known concentration of the target gas or gases into
the IR beam. This method has the disadvantage of attenuating
the IR beam due to the transmitting and reflecting properties of
the windows used in the cell. The performance of the instrument is somewhat degraded and the intensity profile of the
single-beam spectrum will be affected by the spectral characteristics of the cell. These factors might require that new
background and water vapor reference spectra be created for
use when the cell is positioned in the optical path. The
advantage of the short gas cell approach is that a known
quantity of target gas is in the path. If this quantity is accurately
known and is constant, accuracy and precision measurements
can be made. Standard QA/QC techniques using a short cell are
currently under development.
13.4.3 Effect of Stray Light and Ambient Radiation—Stray
light and ambient radiation can affect the quantitative results
and must be accounted for as described in 8.5.
13.4.4 Validity of Analysis Method—In addition to determining the accuracy and precision of the instrumental
measurements, the accuracy and precision of the method used
for quantitative analysis must also be determined. In most
cases, an automated software package is used to determine the
concentrations of the target gases. These procedures can be
checked manually by comparing the sample spectra to spectra
of reference gases with a known concentration. Interactive
subtraction procedures that yield a scaling factor for the
reference spectrum can be used to verify the concentration
measured by the software. In addition, the reference spectra
can be scaled to the desired concentration and then added to the
field spectrum. When the composite spectrum is then analyzed,
the measured concentration should reflect the amount of
reference gas added. Care must be taken in choosing the
spectral regions used to analyze for each target gas. For
example, the optimum region for analysis does not always
encompass the entire absorption envelope. Possible interfering
species must also be accounted for in the analysis method. The
operator should also be aware that any time a concentration
spike appears that cannot be immediately attributed to a known
source, the actual spectral data should be examined to verify
the presence of the compound in question and its concentration. This can be done by first subtracting the appropriate
absorption spectra of any interfering species from the field
spectrum. The signature and absorbance values of the resultant
13.5 Completeness, Representativeness, and Comparability
of the Data—These requirements will vary with specific
monitoring applications. Care must be taken to ensure that
spectra are acquired frequently enough to account for the
variability of the target gas concentration. Failure to do this
will make it difficult to discern between real changes in the
target gas concentration and possible variability in the OP/
FT-IR measurements. If possible, the OP/FT-IR data should be
initially compared to an established method. This can be
difficult because the OP/FT-IR produces a path-averaged
concentration, whereas most established methods use some
type of point monitor. Some OP/FT-IR data have been compared to the canister method or other point monitors with
success, however (24). Although not exact, these comparisons
can give the operator an idea if the OP/FT-IR measurements
are within generally accepted values. If not, corrective action
should be taken.
13.6 Ancillary Measurements—The type of ancillary measurements required will vary, depending on the type of study
being conducted. For any OP/FT-IR measurements, the ambient temperature, water vapor concentration, ambient pressure,
and wind velocity should be recorded. The operator should also
be aware of the effect of changes in altitude on ambient
pressure. If the instrument is housed in an enclosed
environment, the temperature of that environment should also
be recorded. It is also useful to record the temperature inside
the spectrometer itself, especially in cold weather situations.
13.7 Documentation—As with any analytical methodology,
a log of instrument use, downtime, and repairs, as well as notes
regarding unusual observations, should be maintained. These
notes can prove invaluable for analyzing data that appear to be
abnormal. Records should be kept that are appropriate for the
type of study being conducted. For example, the requirements
for a research and development project may be different from
the requirements for legally defensible data.
14. Keywords
14.1 air analysis; Fourier transform infrared; FT-IR; openpath monitoring; spectrometers
18
E1865 − 97 (2013)
REFERENCES
Press, New York, 1991, p. 53.
(15) University of South Florida, USF HITRAN-PC , University of South
Florida, Tampa, FL, 1993.
(16) Federal Register 59, 42541, 1994.
(17) U.S. Environmental Protection Agency, Quality Assurance Handbook for Air Pollution Measurement Systems, Vol IV—
Meteorological Measurements, U.S. Environmental Protection
Agency, Research Triangle Park, NC, 1989.
(18) RC Handbook of Chemistry and Physics, 76th ed., D. R. Lide, Ed.,
CRC Press, Boca Raton, FL, 1993.
(19) Phillips, B., Moyers, R., and Lay, L. T., “Improved FTIR Open Path
Remote Sensing Data Reduction Technique,” in Proceedings of
Optical Sensing for Environmental and Process Monitoring, VIP-37,
Air & Waste Management Association, Pittsburgh, PA, 1995, pp.
374–388.
(20) Kricks, R. J., Pescatore, D. E., Kagann, R. H., and McCauley, C. L.,
“A Technique to Derive Background Spectra (I0) from Sample
Spectra (I) for Open-Path FTIR Spectroscopy Applications,” in
Proceedings of the 1992 U.S. EPA/A&WMA International Symposium on Measurement of Toxic and Related Air Pollutants, VIP-25,
Air & Waste Management Association, Pittsburgh, PA, 1992, pp.
582–594.
(21) Haaland, D. M., “Multivariate Calibration Methods Applied to
Quantitative FT-IR Analyses,” in Practical Fourier Transform Infrared Spectroscopy—Industrial and Laboratory Chemical Analysis,
Ferraro, J. R., and Krishnan, K., eds., Academic Press, San Diego,
CA, 1990, pp. 396–468.
(22) U.S. Environmental Protection Agency, EPA Requirements for Quality Assurance Project Plans for Environmental Data Operations,
Doc. No. EPA/QA/R-5, U.S. Environmental Protection Agency,
Research Triangle Park, NC, 1994.
(23) Russwurm, G. M., Childers, J. W., and Thompson, E. L., Jr., “
Diurnal Variations of Some Atmospheric Gases as Measured by
Fourier Transform Spectroscopy,” in Proceedings of Optical Sensing
for Environmental and Process Monitoring , Simpson, O. A., ed.,
VIP-37, Air & Waste Management Association, Pittsburgh, PA,
1995, pp. 47–57.
(24) Russwurm, G. M., and McClenny, W. A., “A Comparison of FTIR
Open Path Ambient Data with Method TO-14 Canister Data,” in
Proceedings of the 1990 U.S. EPA/A&WMA International Symposium on the Measurement of Toxic and Related Air Pollutants, Air &
Waste Management Association, Pittsburgh, PA, 1990, pp. 248–253.
(1) Russwurm, G. M., and Childers, J. W., FT-IR Open-Path Monitoring
Guidance Document, 2nd Edition, SP-4420-95-04, ManTech Environmental Technology, Inc., Research Triangle Park, NC, 1995.
(2) Hanst, P. L., “Pollution: Trace Gas Analysis,” in Fourier Transform
Infrared Spectroscopy, Applications to Chemical Systems, Vol 2,
Ferraro, J. R. and Basile, L. J., eds., Academic Press, New York, 1979,
pp. 79–111.
(3) Herget, W. F., “Air Pollution: Ground-Based Sensing of Source
Emissions,” in Fourier Transform Infrared Spectroscopy. Applications to Chemical Systems , Vol 2, Ferraro, J. R. and Basile, L. J., eds.,
Academic Press, New York, 1979, pp. 111–127.
(4) Spellicy, R. L., Crow, W. L., Draves, J. A., Buchholtz, W. F., and
Herget, W. F., Spectroscopy, Vol 6, No. 24, 1991.
(5) Xiao, H. K., Levine, S. P., Herget, W. F., D’Arcy, J. B., Spear, R., and
Pritchett, T., American Industrial Hygiene Association Journal, Vol
52, No. 449, 1991.
(6) Griffiths, P. R., and de Haseth, J. A., Fourier Transform Infrared
Spectrometry, John Wiley and Sons, New York, 1986, pp. 254–259.
(7) Bittner, H., Eisenmann, T., Mosebach, H., Erhard, M., and Resch, M.,
“Measurements of Diffuse Emissions of Volatile Organic Compounds
by High Resolution FTIR Remote Sensing,” in SP-89 Optical Sensing
for Environmental Monitoring, Air & Waste Management
Association, Pittsburgh, PA, 1994, pp. 443–454.
(8) Strang, C. R., Levine, S. P., and Herget, W. F., American Industrial
Hygiene Association Journal, Vol 50, No. 70, 1989.
(9) Strang, C. R., and Levine, S. P., American Industrial Hygiene
Association Journal, Vol 50, No. 78, 1989.
(10) Marshall, T. L., Chaffin, C. T., Makepeace, V. D., Hoffman, R. M.,
Hammaker, R. M., Fateley, W. G., Saarinen, P., and Kauppinen, J.,
Journal of Molecular Structure , Vol 19, No. 324, 1994.
(11) Childers, J. W., and Thompson, E. L., Jr., “Resolution Requirements
in Long-Path FT-IR Spectrometry,” in SP-89 Optical Sensing for
Environmental Monitoring, Air & Waste Management Association,
Pittsburgh, PA, 1994, pp. 38–46.
(12) Griffiths, P. R., Richardson, R. L., Qin, D., and Zhu, C., “ Open-path
Atmospheric Monitoring with a Low-resolution FT-IR
Spectrometer,” in Proceedings of Optical Sensing for Environmental
and Process Monitoring, Simpson, O. A., ed., VIP-37, Air & Waste
Management Association, Pittsburgh, PA, 1995, pp. 274–284.
(13) Grasselli, J. G., Griffiths, P. R., and Hannah, R. W., Applied
Spectroscopy, Vol 36, No. 87, 1982.
(14) Mark, H., and Workman, J., Statistics in Spectroscopy, Academic
ASTM International takes no position respecting the validity of any patent rights asserted in connection with any item mentioned
in this standard. Users of this standard are expressly advised that determination of the validity of any such patent rights, and the risk
of infringement of such rights, are entirely their own responsibility.
This standard is subject to revision at any time by the responsible technical committee and must be reviewed every five years and
if not revised, either reapproved or withdrawn. Your comments are invited either for revision of this standard or for additional standards
and should be addressed to ASTM International Headquarters. Your comments will receive careful consideration at a meeting of the
responsible technical committee, which you may attend. If you feel that your comments have not received a fair hearing you should
make your views known to the ASTM Committee on Standards, at the address shown below.
This standard is copyrighted by ASTM International, 100 Barr Harbor Drive, PO Box C700, West Conshohocken, PA 19428-2959,
United States. Individual reprints (single or multiple copies) of this standard may be obtained by contacting ASTM at the above
address or at 610-832-9585 (phone), 610-832-9555 (fax), or (e-mail); or through the ASTM website
(www.astm.org). Permission rights to photocopy the standard may also be secured from the Copyright Clearance Center, 222
Rosewood Drive, Danvers, MA 01923, Tel: (978) 646-2600; />
19