Astm f 76 08 (2016)e1
Bạn đang xem bản rút gọn của tài liệu. Xem và tải ngay bản đầy đủ của tài liệu tại đây (433.59 KB, 14 trang )
This international standard was developed in accordance with internationally recognized principles on standardization established in the Decision on Principles for the
Development of International Standards, Guides and Recommendations issued by the World Trade Organization Technical Barriers to Trade (TBT) Committee.
Designation: F76 − 08 (Reapproved 2016)´1
Standard Test Methods for
Measuring Resistivity and Hall Coefficient and Determining
Hall Mobility in Single-Crystal Semiconductors1
This standard is issued under the fixed designation F76; the number immediately following the designation indicates the year of original
adoption or, in the case of revision, the year of last revision. A number in parentheses indicates the year of last reapproval. A superscript
epsilon (´) indicates an editorial change since the last revision or reapproval.
ε1 NOTE—In 10.5.1, second sentence, (0.5 T) was corrected editorially to (0.5 mT) in May 2017.
1.4 Interlaboratory tests of these test methods (Section 19)
have been conducted only over a limited range of resistivities
and for the semiconductors, germanium, silicon, and gallium
arsenide. However, the method is applicable to other semiconductors provided suitable specimen preparation and contacting
procedures are known. The resistivity range over which the
method is applicable is limited by the test specimen geometry
and instrumentation sensitivity.
1. Scope
1.1 These test methods cover two procedures for measuring
the resistivity and Hall coefficient of single-crystal semiconductor specimens. These test methods differ most substantially
in their test specimen requirements.
1.1.1 Test Method A, van der Pauw (1) 2—This test method
requires a singly connected test specimen (without any isolated
holes), homogeneous in thickness, but of arbitrary shape. The
contacts must be sufficiently small and located at the periphery
of the specimen. The measurement is most easily interpreted
for an isotropic semiconductor whose conduction is dominated
by a single type of carrier.
1.1.2 Test Method B, Parallelepiped or Bridge-Type—This
test method requires a specimen homogeneous in thickness and
of specified shape. Contact requirements are specified for both
the parallelepiped and bridge geometries. These test specimen
geometries are desirable for anisotropic semiconductors for
which the measured parameters depend on the direction of
current flow. The test method is also most easily interpreted
when conduction is dominated by a single type of carrier.
1.5 The values stated in acceptable metric units are to be
regarded as the standard. The values given in parentheses are
for information only. (See also 3.1.4.)
1.6 This standard does not purport to address all of the
safety concerns, if any, associated with its use. It is the
responsibility of the user of this standard to establish appropriate safety and health practices and determine the applicability of regulatory limitations prior to use.
1.7 This international standard was developed in accordance with internationally recognized principles on standardization established in the Decision on Principles for the
Development of International Standards, Guides and Recommendations issued by the World Trade Organization Technical
Barriers to Trade (TBT) Committee.
1.2 These test methods do not provide procedures for
shaping, cleaning, or contacting specimens; however, a procedure for verifying contact quality is given.
2. Referenced Documents
NOTE 1—Practice F418 covers the preparation of gallium arsenide
phosphide specimens.
2.1 ASTM Standards:3
D1125 Test Methods for Electrical Conductivity and Resistivity of Water
E2554 Practice for Estimating and Monitoring the Uncertainty of Test Results of a Test Method Using Control
Chart Techniques
F26 Test Methods for Determining the Orientation of a
Semiconductive Single Crystal (Withdrawn 2003)4
F43 Test Methods for Resistivity of Semiconductor Materials (Withdrawn 2003)4
1.3 The method in Practice F418 does not provide an
interpretation of the results in terms of basic semiconductor
properties (for example, majority and minority carrier mobilities and densities). Some general guidance, applicable to
certain semiconductors and temperature ranges, is provided in
the Appendix. For the most part, however, the interpretation is
left to the user.
1
These test methods are under the jurisdiction of ASTM Committee F01 on
Electronics and are the direct responsibility of Subcommittee F01.15 on Compound
Semiconductors.
Current edition approved May 1, 2016. Published May 2016. Originally
approved in 1967. Last previous edition approved in 2008 as F76 – 08. DOI:
10.1520/F0076-08R16E01.
2
The boldface numbers in parentheses refer to the list of references at the end of
these test methods.
3
For referenced ASTM standards, visit the ASTM website, www.astm.org, or
contact ASTM Customer Service at For Annual Book of ASTM
Standards volume information, refer to the standard’s Document Summary page on
the ASTM website.
4
The last approved version of this historical standard is referenced on
www.astm.org.
Copyright © ASTM International, 100 Barr Harbor Drive, PO Box C700, West Conshohocken, PA 19428-2959. United States
1
F76 − 08 (2016)´1
useful quantities for materials specification, including the
charge carrier density and the drift mobility, can be inferred.
F47 Test Method for Crystallographic Perfection of Silicon
by Preferential Etch Techniques4
F418 Practice for Preparation of Samples of the Constant
Composition Region of Epitaxial Gallium Arsenide Phosphide for Hall Effect Measurements (Withdrawn 2008)4
2.2 SEMI Standard:
C1 Specifications for Reagents5
5. Interferences
5.1 In making resistivity and Hall-effect measurements,
spurious results can arise from a number of sources.
5.1.1 Photoconductive and photovoltaic effects can seriously influence the observed resistivity, particularly with highresistivity material. Therefore, all determinations should be
made in a dark chamber unless experience shows that the
results are insensitive to ambient illumination.
5.1.2 Minority-carrier injection during the measurement can
also seriously influence the observed resistivity. This interference is indicated if the contacts to the test specimen do not
have linear current-versus-voltage characteristics in the range
used in the measurement procedure. These effects can also be
detected by repeating the measurements over several decades
of current. In the absence of injection, no change in resistivity
should be observed. It is recommended that the current used in
the measurements be as low as possible for the required
precision.
5.1.3 Semiconductors have a significant temperature coefficient of resistivity. Consequently, the temperature of the
specimen should be known at the time of measurement and the
current used should be small to avoid resistive heating.
Resistive heating can be detected by a change in readings as a
function of time starting immediately after the current is
applied and any circuit time constants have settled.
5.1.4 Spurious currents can be introduced in the testing
circuit when the equipment is located near high-frequency
generators. If equipment is located near such sources, adequate
shielding must be provided.
5.1.5 Surface leakage can be a serious problem when
measurements are made on high-resistivity specimens. Surface
effects can often be observed as a difference in measured value
of resistivity or Hall coefficient when the surface condition of
the specimen is changed (2, 3).
5.1.6 In measuring high-resistivity samples, particular attention should be paid to possible leakage paths in other parts of
the circuit such as switches, connectors, wires, cables, and the
3. Terminology
3.1 Definitions:
3.1.1 Hall coeffıcient—the ratio of the Hall electric field
(due to the Hall voltage) to the product of the current density
and the magnetic flux density (see X1.4).
3.1.2 Hall mobility—the ratio of the magnitude of the Hall
coefficient to the resistivity; it is readily interpreted only in a
system with carriers of one charge type. (See X1.5)
3.1.3 resistivity—of a material, is the ratio of the potential
gradient parallel to the current in the material to the current
density. For the purposes of this method, the resistivity shall
always be determined for the case of zero magnetic flux. (See
X1.2.)
3.1.4 units—in these test methods SI units are not always
used. For these test methods, it is convenient to measure length
in centimetres and to measure magnetic flux density in gauss.
This choice of units requires that magnetic flux density be
expressed in V·s·cm−2 where:
1 V·s·cm22 5 108 gauss
The units employed and the factors relating them are summarized in Table 1.
4. Significance and Use
4.1 In order to choose the proper material for producing
semiconductor devices, knowledge of material properties such
as resistivity, Hall coefficient, and Hall mobility is useful.
Under certain conditions, as outlined in the Appendix, other
5
Available from Semiconductor Equipment and Materials Institute, 625 Ellis St.,
Suite 212, Mountain View, CA 94043.
TABLE 1 Units of Measurement
Quantity
Resistivity
Charge carrier concentration
Charge
Drift mobility, Hall mobility
Hall coefficient
Electric field
Magnetic flux density
Current density
Length
Potential difference
Factor A
Units of
Measurement B
Ω·m
m−3
C
m2·V−1·s−1
m3·C−1
V·m−1
T
A·m−2
m
10 2
10 − 6
1
10 4
10 6
10 − 2
10 4
10 − 4
10 2
Ω · cm
cm − 3
C
cm 2 · V − 1 ·s − 1
cm 3 · C − 1
V · cm − 1
gauss
A · cm − 2
cm
V
1
V
Symbol
ρ
n, p
e, q
µ,µH
RH
E
B
J
L, t, w, d
a, b, c
V
SI Unit
A
The factors relate SI units to the units of measurement as in the following example:
1 Ω · m = 10 2 Ω · cm
B
This system is not a consistent set of units. In order to obtain a consistent set, the magnetic flux density must be expressed in V · s · cm − 2. The proper conversion factor
is:
1 · V · s · cm − 2 = 10 8 gauss
2
F76 − 08 (2016)´1
procedure is described for determining resistivity and Hall
coefficient using direct current techniques. The Hall mobility is
calculated from the measured values.
like which may shunt some of the current around the sample.
Since high values of lead capacitance may lengthen the time
required for making measurements on high-resistivity samples,
connecting cable should be as short as practicable.
5.1.7 Inhomogeneities of the carrier density, mobility, or of
the magnetic flux will cause the measurements to be inaccurate. At best, the method will enable determination only of an
undefined average resistivity or Hall coefficient. At worst, the
measurements may be completely erroneous (2, 3, 4).
5.1.8 Thermomagnetic effects with the exception of the
Ettingshausen effect can be eliminated by averaging of the
measured transverse voltages as is specified in the measurement procedure (Sections 11 and 17). In general, the error due
to the Ettingshausen effect is small and can be neglected,
particularly if the sample is in good thermal contact with its
surroundings (2, 3, 4).
5.1.9 For materials which are anisotropic, especially semiconductors with noncubic crystal structures, Hall measurements are affected by the orientation of the current and
magnetic field with respect to the crystal axes (Appendix, Note
X1.1). Errors can result if the magnetic field is not within the
low-field limit (Appendix, Note X1.1).
5.1.10 Spurious voltages, which may occur in the measuring
circuit, for example, thermal voltages, can be detected by
measuring the voltage across the specimen with no current
flowing or with the voltage leads shorted at the sample
position. If there is a measurable voltage, the measuring circuit
should be checked carefully and modified so that these effects
are eliminated.
5.1.11 An erroneous Hall coefficient will be measured if the
current and transverse electric field axes are not precisely
perpendicular to the magnetic flux. The Hall coefficient will be
at an extremum with respect to rotation if the specimen is
properly positioned (see 7.4.4 or 13.4.4).
7. Apparatus
7.1 For Measurement of Specimen Thickness—Micrometer,
dial gage, microscope (with small depth of field and calibrated
vertical-axis adjustment), or calibrated electronic thickness
gage capable of measuring the specimen thickness to 61 %.
7.2 Magnet—A calibrated magnet capable of providing a
magnetic flux density uniform to 61.0 % over the area in
which the test specimen is to be located. It must be possible to
reverse the direction of the magnetic flux (either electrically or
by rotation of the magnet) or to rotate the test specimen 180°
about its axis parallel to the current flow. Apparatus, such as an
auxiliary Hall probe or nuclear magnetic resonance system,
should be available for measuring the flux density to an
accuracy of 61.0 % at the specimen position. If an electromagnet is used, provision must be made for monitoring the flux
density during the measurements. Flux densities between 1000
and 10 000 gauss are frequently used; conditions governing the
choice of flux density are discussed more fully elsewhere (2, 3,
4).
7.3 Instrumentation:
7.3.1 Current Source, capable of maintaining current
through the specimen constant to 60.5 % during the measurement. This may consist either of a power supply or a battery, in
series with a resistance greater than 200 × the total specimen
resistance (including contact resistance). The current source is
accurate to 60.5 % on all ranges used in the measurement. The
magnitude of current required is less than that associated with
an electric field of 1 V·cm−1 in the specimen.
7.3.2 Electrometer or Voltmeter, with which voltage measurements can be made to an accuracy of 60.5 %. The current
drawn by the measuring instrument during the resistivity and
Hall voltage measurements shall be less than 0.1 % of the
specimen current, that is, the input resistance of the electrometer (or voltmeter) must be 1000 × greater than the resistance
of the specimen.
7.3.3 Switching Facilities, used for reversal of current flow
and for connecting in turn the required pairs of potential leads
to the voltage-measuring device.
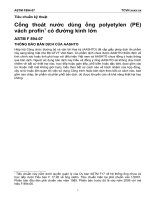
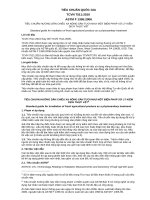
7.3.3.1 Representative Circuit, used for accomplishing the
required switching is shown in Fig. 1.
7.3.3.2 Unity-Gain Amplifiers, used for high-resistivity
semiconductors, with input impedance greater than 1000 × the
specimen resistance are located as close to the specimen as
possible to minimize current leakage and circuit time-constants
(8, 9). Triaxial cable is used between the specimen and the
amplifiers with the guard shield driven by the respective
amplifier output. This minimizes current leakage in the cabling.
The current leakage through the insulation must be less than
0.1 % of the specimen current. Current leakage in the specimen
holder must be prevented by utilizing a suitable high-resistivity
insulator such as boron nitride or beryllium oxide.
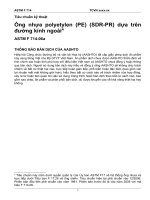
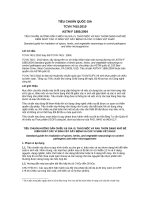
7.3.3.3 Representative Circuit, used for measuring highresistance specimens is shown in Fig. 2. Sixteen single-pole,
single-throw, normally open, guarded reed relays are used to
5.2 In addition to these interferences the following must be
noted for van der Pauw specimens.
5.2.1 Errors may result in voltage measurements due to
contacts of finite size. Some of these errors are discussed in
references (1, 5, 6).
5.2.2 Errors may be introduced if the contacts are not placed
on the specimen periphery (7).
5.3 In addition to the interferences described in 5.1, the
following must be noted for parallelepiped and bridge-type
specimens.
5.3.1 It is essential that in the case of parallelepiped or
bridge-type specimens the Hall-coefficient measurements be
made on side contacts far enough removed from the end
contacts that shorting effects can be neglected (2, 3). The
specimen geometries described in 15.3.1 and 15.3.2 are designed so that the reduction in Hall voltage due to this shorting
effect is less than 1 %.
TEST METHOD A—FOR VAN DER PAUW
SPECIMENS
6. Summary of Test Method
6.1 In this test method, specifications for a van der Pauw (1)
test specimen and procedures for testing it are covered. A
3
F76 − 08 (2016)´1
FIG. 1 Representative Manual Test Circuit for Measuring van der Pauw Specimens
NOTE 1—A—Unity gain amplifier
NOTE 2—R1–R16—Reed relays
Position
Switches
Closed
Current
Voltage
1
2, 3
14, 15
1, 2
3, 4
2
1, 4
14, 15
2, 1
3, 4
1, 8
12, 13
2, 3
4, 1
3
2, 7
12, 13
3, 2
4, 1
6, 7
10, 11
3, 4
1, 2
4
5, 8
10, 11
4, 3
1, 2
4, 5
9, 16
4, 1
2, 3
5
3, 6
9, 16
1, 4
2, 3
3, 8
10, 13
1, 3
4, 2
6
4, 7
10, 13
3, 1
4, 2
1, 6
11, 16
2, 4
1, 3
2, 5
11, 16
4, 2
1, 3
FIG. 2 Representative Test Circuit for Measuring High-Resistivity van der Pauw Specimens
connect the current source and differential voltmeter to the
appropriate specimen points. The relay closures necessary to
accomplish the same switching achieved in the circuit of Fig.
1 are listed in the table of Fig. 2.
4
F76 − 08 (2016)´1
preferred. This is most conveniently performed by rotating the
specimen with respect to the magnetic flux and measuring the
transverse voltage as a function of angle between the magnetic
flux and a reference mark on the specimen holder over a range
a few degrees on each side of the nominal perpendicular
position. The correct position is that where the average Hall
voltage is a maximum or, in some cases where orientation
dependent effects are encountered, a minimum.
7.4.5.3 A more accurate method of electrical positioning
involves rotation of the specimen with respect to the magnetic
flux as in 7.4.5.2, but a few degrees around both positions
approximately 90° away from the nominal perpendicular
position. The correct angular position for the specimen during
Hall-effect measurements is midway between the two points
(about 180° apart) where the average transverse voltage is zero.
7.3.4 Transistor Curve Tracer, can be used for checking the
linearity of contacts to low-resistivity material.
7.3.5 All instruments must be maintained within their specifications through periodic calibrations.
7.4 Specimen Holder:
7.4.1 Container, if low-temperature measurements are
required, of such dimensions that it will enclose the specimen
holder (7.4.3) and fit between the magnetic pole pieces. A glass
or metal dewar or a foamed polystyrene boat is suitable.
7.4.2 Temperature Detector, located in close proximity to
the test specimen and associated instruments for monitoring
temperature to an accuracy of 61°C during the measurement.
This may include, for example, a thermocouple, a platinum
resistance thermometer, or a suitable thermistor.
7.4.3 Opaque Container, used to hold the specimen in
position, to maintain an isothermal region around the
specimen, and to shield the specimen from light and, in the
case of low-temperature measurements, from roomtemperature radiation. The mounting must be arranged so that
mechanical stress on the specimen does not result from
differential expansion when measurements are made at temperatures different from room temperature. If liquids, such as
boiling nitrogen, are used to establish low temperatures, the
liquid may be allowed to enter the specimen container directly
through ports that are suitably shielded against the entry of
light.
7.4.4 If a metal dewar or specimen holder is used, it must be
constructed of nonmagnetic materials such that the value of
magnetic flux density at the specimen position will not be
altered more than 61 % by its presence.
7.4.5 To orient the specimen perpendicular to the magnetic
field it is desirable to employ both geometrical and electrical
tests. Sign conventions are defined in Fig. 3.
7.4.5.1 The specimen holder can usually be visually aligned
parallel with the flat faces of the magnet along the long axis
(usually the vertical axis) of the specimen holder in a satisfactory manner. Care should be taken that the specimen is
mounted within the container so that the flat faces are parallel
with an external portion of the specimen holder.
7.4.5.2 Because the dimensions are much shorter in the
direction perpendicular to the long axis, electrical orientation is
8. Reagents and Materials (See Section 9)
8.1 Purity of Reagents—All chemicals for which such
specifications exist shall conform to SEMI Specifications C1.
Reagents for which SEMI specifications have not been developed shall conform to the specifications of the Committee on
Analytical Reagents of the American Chemical Society.6 Other
grades may be used provided it is first ascertained that the
reagent is sufficiently pure to permit its use without lessening
the accuracy of the determination.
8.2 Purity of Water—When water is used it is either distilled
water or deionized water having a resistivity greater than 2
MΩ·cm at 25°C as determined by the Non-Referee Tests of
Test Methods D1125.
9. Test Specimen Requirements
9.1 Regardless of the specimen preparation process used,
high-purity reagents and water are required.
9.2 Crystal Perfection—The test specimen is a single crystal.
NOTE 2—The procedure for revealing polycrystalline regions in silicon
is given in Test Method F47.
NOTE 3—The crystallographic orientation of the slice may be determined if desired, using either the X-ray or optical techniques of Test
Method F26.
9.3 Specimen Shape—The thickness shall be uniform to
61 %. The minimum thickness is governed by the availability
of apparatus which is capable of measuring the thickness to a
precision of 61 %. The test specimen shape can be formed by
cleaving, machining, or photolithography. Machining techniques such as ultrasonic cutting, abrasive cutting, or sawing
may be employed as required. Representative photolithographically defined test patterns are described in (10, 11, 12).
9.3.1 Although the specimen may be of arbitrary shape, one
of the symmetrical configurations of Fig. 4 is recommended.
The specimen must be completely free of (geometrical) holes.
6
“Reagent Chemicals, American Chemical Society Specifications,” Am. Chemical Soc., Washington, DC. For suggestions on the testing of reagents not listed by
the American Chemical Society, see “Reagent Chemicals and Standards,” by Joseph
Rosin, D. Van Nostrand Co., Inc., New York, NY, and the “United States
Pharmacopeia.”
NOTE 1—The carrier velocity, V, for electrons and holes is in opposite
directions as indicated.
FIG. 3 Hall-Effect Sign Conventions
5
F76 − 08 (2016)´1
(a) Circle
(b) Clover-leaf
(c) Square
(d) Rectangle
NOTE 1—Contact positions are indicated schematically by the small dots.
FIG. 4 Typical Symmetrical van der Pauw Specimens
The recommended ratio of peripheral length of the specimen,
Lp, to thickness of the specimen, t, is as follows:
NOTE 4—The notation to be used, V AB,CD, refers to the potential
difference VC − VD measured between Contacts C and D when current
enters Contact A and exits Contact B. Both the sign and magnitude of all
voltages must be determined and recorded. For van der Pauw specimens,
the contacts are labeled consecutively in counter-clockwise order around
the specimen periphery. Similarly the resistance RAB,CD is defined as the
ratio of the voltage V C − VD divided by the current directed into Contact
A and out of Contact B.
Lp $ 15t
Recommended thickness is less than or equal to 0.1 cm. This
specimen shape can produce erroneous results when used on
anisotropic materials (see 5.1.9 and Note X1.1).
9.4 Maintain the contact dimensions as small as possible
relative to the peripheral length of the specimen. If possible,
place the contacts on the specimen edge. Use line or dot
contacts with a maximum dimension along the peripheral
length, L p, no greater than 0.05 Lp. If the contacts must be
placed on one of the two flat faces of the specimen that are
separated by the dimension, t, make them as small as possible
and locate them as close as possible to the edge (see 5.2.1 and
5.2.2).
10.5 Hall-Coeffıcient Measurement—Position the specimen
between the magnet-pole pieces so that the magnetic flux is
perpendicular to the two flat faces of the specimen which are
separated by the dimension, t, (7.4.5). If an electromagnet is
used to provide the flux, follow the appropriate procedure in
10.5.1. If a permanent magnet of known flux density is used,
omit the adjustment and measurement of flux density.
10.5.1 In high-mobility materials such as lightly doped
n-type gallium arsenide, the proportionality factor, r, (see
Appendix X1) varies with the applied magnetic field. For the
purposes of interlaboratory comparison, users should therefore
use a field of 5 gauss (0.5 mT) in the absence of other
information. This effect is not expected to be significant for
dopant density above 1017 cm−3 in n-type gallium arsenide.
10.5.2 Measure the temperature of the specimen. Turn on
the magnetic flux and adjust it to the desired positive value of
magnetic flux density. Measure the magnetic flux density.
Measure the voltages V31,42 ( + B), V13,42( + B), V42,13( + B),
and V24,13( + B) (Note 4 and Note 5). Remeasure the value of
the magnetic flux density in order to check the stability of the
magnet. If the second value of magnetic flux density differs
from the first by more than 1 %, make the necessary changes,
and repeat the procedure until the specified stability is
achieved. Rotate the specimen 180° or reverse the magnetic
flux, and adjust it to the same magnitude (61 %) of magnetic
flux density. Measure the voltages V24,13(−B), V42,13(−B),
V13,42(−B), and V31,42(−B) (Note 4 and Note 5). Measure the
temperature and magnetic flux density and check the stability
as before.
10. Measurement Procedure
10.1 Thickness Measurement—Measure the specimen thickness (9.3) with a precision of 61 %.
10.2 Contact Evaluation—Verify that all combinations of
contact pairs in both polarities have linear current-voltage
characteristics, without noticeable curvature, at the measurement temperature about the actual value of current to be used.
10.3 Specimen Placement—Place the clean and contacted
specimen in its container (7.4.3). If a permanent magnet is used
to provide the flux, keep the magnet and the specimen separate
during the measurement of resistivity. If possible, move the
magnet without disturbing the specimen and its holder, so as to
minimize the possibility of a change of temperature which
must remain within the 61°C tolerance between the resistivity
and Hall-effect measurements. If an electromagnet is used, be
certain that the residual flux density is small enough not to
affect the resistivity measurement.
10.4 Resistivity Measurement—Measure the temperature of
the specimen. Set the current magnitude, I, to the desired value
(see 5.1.2). Measure the voltages V21,34, V12,34, V32,41, V23,41,
V43,12, V34,12, V14,23, and V41,23 (Note 4). Remeasure the
specimen temperature to check the temperature stability. If the
second measurement of the temperature differs from the first by
more than 1°C, allow the temperature to stabilize further, and
then repeat the procedure of 10.4.
NOTE 5—The parenthetical symbols ( + B) and (−B) refer to oppositely
applied magnetic fields where positive field is defined in Fig. 3.
10.6 Cautions—See Section 5 for discussion of spurious
results.
6
F76 − 08 (2016)´1
11. Calculations
R HC 5
11.1 Resistivity—Calculate the sample resistivity from the
data of 10.4. Two values of resistivity, ρA and ρ B, are obtained
as follows (Note 4):
ρA 5
1.1331f A t
@ V 21,34 2 V 12,341V 32,41 2 V 23,41#
I
1 V
B
1.1331f B t
@ V 43,12 2 V
I
R HD 5
# Ω·cm
41,23
(2)
24,13
R Hav 5
µ H[
R 43,12 2 R 34,12
V 43;12 2 V 34,12
5
R 14,23 2 R 41,23
V 14,23 2 V 41,23
~ 1B !
(7)
~ 2B ! 2 V 42,13 ~ 2B ! #cm 3 ·C 23
R HC1R
2
HD
cm3 ·C 21
(8)
? R ? cm·V
Hav
ρav
21
·s 21
(9)
11.4 If this procedure is to be used to obtain carrier density,
users should use a value of proportionality factor, r, of 1.0 in
the absence of other information (see Appendix 1.3.2).
(4)
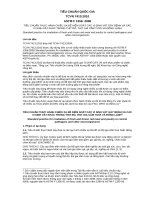
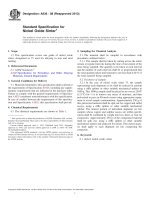
The relationship between the factor f and Q is written
explicitly and graphed in Fig. 5. If Q is less than one, take its
reciprocal, and find the value of f for this number. If ρA is not
equal to ρB within 610 %, the specimen is inhomogeneous and
a more uniform specimen is required. Calculate the average
resistivity ρav as follows,
ρ A 1ρ B
ρ av 5
Ω·cm
2
24,13
11.3 Hall Mobility—Calculate the Hall mobility,
(3)
and
QA 5
(6)
If RHC is not within 610 % of R HD, the specimen is
undesirably inhomogeneous and a more uniform specimen is
required. Calculate the average Hall-coefficient RHav as follows:
where the constant 1.1331 ; π/4 ln (2), the units of the
voltages are in volts, the specimen thickness, t, is in
centimetres, the current magnitude, I, is in amperes, and the
geometrical factor fA or f B is a function of the resistance ratio,
QA or QB, respectively:
R 21,34 2 R 12,34 V 21,34 2 V 12,34
QA 5
5
R 32,41 2 R 23,41
V 32,41 2 V 23,41
~ 1B !
~ 2B ! 2 V 31,42 ~ 2B ! #
2.50 3 10 7 t
@ V 42,13 ~ 1B ! 2 V
BI
1 V
1V 14,23 2 V
34,12
13,42
13,42
and
(1)
and
ρ
2.50 3 10 7 t
@ V 31,42 ~ 1B ! 2 V
BI
TEST METHOD B—FOR PARALLELEPIPED OR
BRIDGE-TYPE SPECIMENS
12. Summary of Test Method
12.1 In this test method, specifications for rectangular
parallelepiped and bridge-type specimens and procedures for
testing these structures are covered. Procedures are described
for determining resistivity and Hall coefficient using direct
current techniques. The Hall mobility is calculated from the
measured values.
(5)
11.2 Hall Coeffıcient—Calculate the Hall coefficient from
the data of 10.5. Two values of Hall coefficient, RHC and RHD,
are obtained as follows (Note 4 and Note 5):
FIG. 5 The Factor f Plotted as a Function of Q
7
F76 − 08 (2016)´1
13.3.2 An electrometer or voltmeter with which voltage
measurements can be made to an accuracy of 60.5 %. The
current drawn by the measuring instrument during the resistivity and Hall voltage measurements shall be less than 0.1 %
of the specimen current, that is, the input resistance of the
electrometer (or voltmeter) must be 1000 × greater than the
resistance of the specimen.
13.3.3 Switching facilities for reversal of current flow and
for connecting in turn the required pairs of potential leads to
the voltage-measuring device.
13.3.3.1 A representative circuit for accomplishing the required switching is shown in Fig. 6.
13.3.3.2 Unity-Gain Amplifiers, for high-resistivity
semiconductors, with input impedance greater than 1000 × the
specimen resistance are located as close to the specimen as
possible to minimize current leakage and circuit time-constants
(8, 9). Triaxial Cable, used between the specimen and the
amplifiers with the guard shield driven by the respective
amplifier output. This minimizes current leakage in the cabling.
The current leakage through the insulation must be less than
0.1 % of the specimen current. Current leakage in the specimen
holder must be prevented by utilizing a suitable high-resistivity
insulator such as boron nitride or beryllium oxide.
13.3.4 Transistor Curve Tracer, can be used for checking
the linearity of contacts to low-resistivity material.
13.3.5 All instruments must be maintained within their
specifications through periodic calibrations.
NOTE 6—This test method for measuring resistivity is essentially
equivalent to the two-probe measurement of Test Methods F43, with the
exception that in the present method the potential probes may be soldered,
alloyed, or otherwise attached to the semiconductor specimen.
13. Apparatus
13.1 For Measurement of Specimen Geometry:
13.1.1 Micrometer, Dial Gage, Microscope (with small
depth of field and calibrated vertical-axis adjustment), or
Calibrated Electronic Thickness gage, capable of measuring
the specimen thickness to 61 %.
13.1.2 Microscope, with crosshair and calibrated mechanical stage, capable of measuring the specimen length and width
to 61 %.
13.2 Magnet—A calibrated magnet capable of providing a
magnetic flux density uniform to 61.0 % over the area in
which the test specimen is to be located. It must be possible to
reverse the direction of the magnetic flux (either electrically or
by rotation of the magnet) or to rotate the test specimen 180°
about its axis parallel to the current flow. Apparatus, such as an
auxiliary Hall probe or nuclear magnetic resonance system,
should be available for measuring the flux density to an
accuracy of 61.0 % at the specimen position. If an electromagnet is used, provision must be made for monitoring the flux
density during the measurements. Flux densities between 1000
and 10 000 gauss are frequently used; conditions governing the
choice of flux density are discussed more fully in Refs (2, 3, 4).
13.3 Instrumentation:
13.3.1 Current Source, capable of maintaining current
through the specimen constant to 60.5 % during the measurement. This may consist either of a power supply or a battery, in
series with a resistance greater than 200 × the total specimen
resistance (including contact resistance). The current source is
accurate to 60.5 % on all ranges used in the measurement. The
magnitude of current required is less than that associated with
an electric field of 1 V·cm−1 in the specimen.
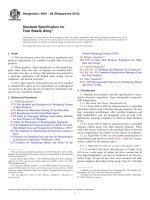
NOTE 1—(a) Eight-contact specimen
13.4 Specimen Holder:
13.4.1 A container of such dimensions that it will enclose
the specimen holder (13.4.3) and fit between the magnetic pole
pieces. A glass or metal dewar or a foamed polystyrene boat is
suitable.
13.4.2 A temperature detector located in close proximity to
the test specimen and associated instruments for monitoring
temperature to an accuracy of 61°C during the measurement.
(b) Six-contact specimen
FIG. 6 Representative Test Circuits for Measuring Bridge-Type and Parallelepiped Specimens
8
F76 − 08 (2016)´1
15. Test Specimen Requirements
This may include, for example, a thermocouple, a platinum
resistance thermometer, or a suitable thermistor.
13.4.3 An opaque container to hold the specimen in
position, to maintain an isothermal region around the
specimen, and to shield the specimen from light and, in the
case of low-temperature measurements, from roomtemperature radiation. The mounting must be arranged so that
mechanical stress on the specimen does not result from
differential expansion when measurements are made at temperatures different from room temperature. If liquids, such as
boiling nitrogen, are used to establish low temperatures, the
liquid may be allowed to enter the specimen container directly
through ports that are suitably shielded against the entry of
light.
13.4.4 If a metal dewar or specimen holder is used, it must
be constructed of nonmagnetic materials such that the value of
magnetic flux density at the specimen position will not be
altered more than 61 % by its presence.
13.4.5 To orient the specimen perpendicular to the magnetic
field it is desirable to employ both geometrical and electrical
tests. Sign conventions are defined in Fig. 3.
13.4.5.1 The specimen holder can usually be visually
aligned parallel with the flat faces of the magnet along the long
axis (usually the vertical axis) of the specimen holder in a
satisfactory manner. Care should be taken that the specimen is
mounted within the container so that the flat faces are parallel
with an external portion of the specimen holder.
13.4.5.2 Because the dimensions are much shorter in the
direction perpendicular to the long axis, electrical orientation is
preferred. This is most conveniently performed by rotating the
specimen with respect to the magnetic flux and measuring the
transverse voltage as a function of angle between the magnetic
flux and a reference mark on the specimen holder over a range
a few degrees on each side of the nominal perpendicular
position. The correct position is that where the average Hall
voltage is a maximum or, in some cases where orientation
dependent effects are encountered, a minimum.
13.4.5.3 A more accurate method of electrical positioning
involves rotation of the specimen with respect to the magnetic
flux as in 13.4.5.2, but a few degrees around both positions
approximately 90° away from the nominal perpendicular
position. The correct angular position for the specimen during
Hall-effect measurements is midway between the two points
(about 180° apart) where the average transverse voltage is zero.
15.1 Regardless of the specimen preparation process used,
high-purity reagents and water are required.
15.2 Crystal Perfection—The test specimen is a single
crystal.
NOTE 7—The procedure for revealing polycrystalline regions in silicon
is given in Test Method F47.
NOTE 8—The crystallographic orientation of the slice may be determined if desired, using either the X-ray or optical techniques of Test
Method F26.
15.3 Specimen Shape—The thickness shall be uniform to6
1 % and shall not exceed 0.10 cm. The minimum thickness is
governed by the availability of apparatus which is capable of
measuring the thickness to a precision of 61 %. Machine or
cleave the test specimen into one of the forms shown in Fig. 7
and Fig. 8, respectively. Machining techniques such as ultrasonic cutting, abrasive cutting, or sawing are employed as
required.
15.3.1 Parallelepiped Specimen—The total length of the
specimen shall be between 1.0 and 1.5 cm. The sides must be
perpendicular to the specimen surface to within 60.5°. If
possible, the length to width ratio should be greater than 5, but
in no case shall it be less than 4. The sample configuration is
shown in Fig. 7(a).
15.3.2 Bridge-Type Specimen—Contact positions on this
type of specimen are determined by the configuration of the die
used in cutting it. The dies must enable sample dimensions to
be held to a tolerance of 1 %. Any of the contact configurations
shown in Fig. 8 are recommended. In some configurations the
protruding side arms of the specimen are enlarged in cross
section to facilitate the application of contacts. The ends of the
specimen may also be enlarged in order to allow the use of
contacts applied to the top surface, as in the case of evaporated
contacts. See Fig. 8(c) and Fig. 8(d). The enlarged portions of
the ends shall not be included in the total specimen length
specified above.
14. Reagents and Materials (See Section 15)
14.1 Purity of Reagents—All chemicals for which such
specifications exist shall conform to SEMI Specifications C1.
Reagents for which SEMI specifications have not been developed shall conform to the specifications of the Committee on
Analytical Reagents of the American Chemical Society.6 Other
grades may be used provided it is first ascertained that the
reagent is sufficiently pure to permit its use without lessening
the accuracy of the determination.
14.1.1 Purity of Water—When water is used it is either
distilled water or deionized water having a resistivity greater
than 2 MΩ·cm at 25°C as determined by the Non-Referee Tests
of Test Method D1125.
NOTE 1—Current contacts cover the entire end of the specimen.
Potential contacts may be either lines as in (b) or dots as in (c).
FIG. 7 Typical Parallelepiped Specimens
9
F76 − 08 (2016)´1
FIG. 8 Typical Bridge-Type Specimens
of the two flat faces of the specimen which are separated by the
dimension, t (see the shaded areas in Fig. 8(c) and (d)).
15.3.3 Eight-Contact Specimen—The geometry of the
specimen is defined below, see Fig. 8(a) and 8(c):
L ≥ 4w
w ≥ 3a
b1, b2 ≥ w
t ≤ 0.1 cm
c ≥ 0.1 cm
1.0 cm ≤ L ≤ 1.5 cm
b1 = b1'6 0.005 cm
b2 = b2' 6 0.005 cm
d1 = d1' 6 0.005 cm
d2 = d2' 6 0.005 cm
b1 + d1 = (1 ⁄2)L + 0.005 cm
b1' = d1' = (1 ⁄2)L6 0.005 cm
b1 ≈ b2,
d1 ≈ d2
15.3.4 Six-Contact Specimen—The geometry of the specimen is defined as follows, see Fig. 8(b) and 8(d):
L ≥ 5w
w ≥ 3a
b1, b2 ≥ 2w
t ≤ 0.1 cm
c ≥ 0.1 cm
1.0 cm ≤ L ≤ 1.5 cm
b1 = b1' 6 0.005 cm
b2 = b2' 6 0.005 cm
d2 = d1' 6 0.005 cm
b 1 ≈ b2
16. Measurement Procedure
16.1 Dimension Measurement—The specimen length,
width, and thickness must be measured with a precision of
61 % (13.1).
16.2 Contact Evaluation—Verify that all combinations of
contact pairs in both polarities have linear current-voltage
characteristics, without noticeable curvature, at the measurement temperature about the actual value of current to be used.
16.3 Specimen Placement—Place the clean and contacted
specimen in its container (13.4.3). If a permanent magnet is
used to provide the flux, keep the magnet and the specimen
separate during the measurement of resistivity. If possible,
move the magnet without disturbing the specimen and its
holder, so as to minimize the possibility of a change of
temperature which must remain within the 61°C tolerance
between the resistivity and Hall-effect measurements. If an
electromagnet is used, be certain that the residual flux density
is small enough not to affect the resistivity measurement.
16.4 Resistivity Measurement:
16.4.1 Eight-Contact Specimen—Measure the specimen
temperature. With no magnetic flux, measure the voltages
V12,46 and V12,57 (Note 9). Reverse the current and measure
V21,46 and V21,57. Remeasure the specimen temperature to
check the temperature stability. If the second temperature
measurement differs from the first by more than 1°C, allow the
temperature to stabilize further, and then repeat the procedure
of 16.4.1.
15.4 Contact Requirements:
15.4.1 Parallelepiped Specimens—The two ends of the
specimen must be completely covered with current contacts.
Make the contact interface with the specimen for the other
(voltage measurement) contacts less than 0.02 cm in width. If
six potential contacts are employed, position them as shown in
Fig. 7(b). If four voltage contacts are employed, position them
as shown in Fig. 7(c).
15.4.2 Bridge-Type Specimens Without Expanded End
Contacts—Completely cover the ends of the specimen with
current contacts.
15.4.3 Bridge-Type Specimens with Expanded Side and End
Contacts—Place the contacts on appropriate locations on one
NOTE 9—The notation to be used, VAB,CD, refers to the potential
difference VC − VD measured between Contact C and D when current
enters Contact A and exits Contact B. Both the sign and magnitude of all
voltages must be determined and recorded. For parallelepiped and
bridge-type specimens the contacts are labeled in Fig. 6. Similarly the
resistance R AB,CD is defined as the ratio of the voltage VC − VD divided by
the current directed into Contact A and out of Contact B.
16.4.2 Six-Contact Specimen—Measure the specimen temperature. With no magnetic flux, measure the voltages V12,46
10
F76 − 08 (2016)´1
17.1.2 Six-Contact Specimens—Computed from the data of
16.4.2 with ρA given by the equation of 17.1.1 and ρ B given by
(Note 9),
and V12,35 (Note 9). Reverse the current and measure V21,46 and
V21,35. Remeasure the specimen temperature to check the
temperature stability. If the second temperature measurement
differs from the first by more than 1°C, allow the temperature
to stabilize further, and then repeat the procedure of 16.4.2.
ρB 5
16.5 Hall-Coeffıcient Measurement:
16.5.1 Eight-Contact Specimen—Measure the specimen
temperature. Turn on the magnetic flux, and adjust it to the
desired positive value of magnetic flux density. Measure the
magnetic flux density. Measure the voltage V12,65( + B). Reverse the current and measure V21,65( + B) (Note 5 and Note 9).
Remeasure the magnetic flux density to check the stability of
the magnet. If the second value of magnetic flux density differs
from the first by more than 1 %, make the necessary changes
and repeat the procedure until the specified stability is
achieved. Rotate the specimen 180° or reverse the magnetic
flux and adjust it to the same magnitude (61 %) of magnetic
flux density. Measure the magnetic flux density. Repeat the
voltage measurements to obtain V21,65(−B). Reverse the current
and repeat the measurements to obtain V12,65(−B). Verify the
stability of the magnetic flux density and temperature as
before.
ρ av 5
wt
Ω·cm
d2
(12)
ρ A 1ρ B
Ω·cm
2
(13)
17.2 Hall Coeffıcient:
17.2.1 Eight-Contact Specimen—Calculate the Hall coefficient from the data of 16.5.1 (Note 5 and Note 9),
R HA 5 2.50 3 10
·
V 12,65~ 1B ! 2 V
7
t
B
~ 1B ! 1V 21,65~ 2B ! 2 V 21,65~ 2B !
21,65
I
(14)
cm3 ·C 21
where the units of the voltage are in volts, current is in
amperes, t is in centimetres, and B is in gauss. RHA will be
negative for n-type material and positive for p-type material.
17.2.2 Six-Contact Specimen—Using the data of 16.5.2
calculate RHA as in 17.2.1 and a second Hall coefficient RHB as
follows (Note 5 and Note 9),
16.5.2 Six-Contact Specimen—Measure the specimen temperature. Turn on the magnetic flux, and adjust it to the desired
positive value of magnetic flux density. Measure the magnetic
flux density. Measure the voltages V12,65( + B) and V12,
43( + B) (Note 5 and Note 9). Reverse the current and measure
V21,65( + B) and V21,43( + B). Remeasure the magnetic flux
density to check the stability of the magnetic field. If the
second value of magnetic flux density differs from the first by
more than 1 %, make the necessary changes and repeat the
procedure until the specified stability is achieved. Rotate the
specimen 180° or reverse the magnetic field and adjust it to the
same magnitude (61 %) of magnetic flux density. Measure the
magnetic flux density. Repeat the voltage measurements to
obtain V21,65(−B) and V21,43(−B). Reverse the current and
repeat the measurements to obtain V12,65(− B) and V12,43(− B).
Verify the stability of the magnetic field and temperature as
before.
R HB 5 2.50 3 10
·
V 12,43~ 1B ! 2 V
7
t
B
~ 1B ! 1V 21,43~ 2B ! 2 V 12,43~ 2B !
21,43
I
(15)
cm3 ·C 21
If RHA and RHB are not equal within 610 %, the specimen is
undesirably inhomogeneous and a more uniform specimen is
required. When two values of Hall coefficient are available
calculate the average Hall coefficient RHav as follows,
R Hav 5
R HA1R HB
cm 3 ·C 21
2
(16)
17.3 Hall Mobility—Calculate the Hall mobility with RHav
given by RHA for the case of an eight-contact specimen.
µ H[
? R ? cm
Hav
ρ av
2
·v 21 ·s 21
(17)
18. Report
18.1 For referee tests report the following information:
18.1.1 Identification of test specimen,
18.1.2 Test temperature,
18.1.3 Specimen shape used, orientation, and corresponding
dimensions,
18.1.4 Magnitude and polarity of all voltages and magneticflux density, and
18.1.5 Calculated average resistivity, average Hallcoefficient (including sign), and Hall mobility.
16.6 Cautions—See Section 5 for a discussion of spurious
results.
17. Calculations
17.1 Resistivity:
17.1.1 Eight-Contact Specimens—Calculate the sample resistivity at the two positions on the specimens from the data of
16.4.1. The resistivity at one position (ρA) is given by (Note 9):
V 12,46 2 V 21,46 Wt
Ω·cm
2I
d 1'
21,35
17.1.3 If ρ A and ρB are not equal within 610 %, the
specimen is undesirably inhomogeneous and a more uniform
specimen is required. Calculate the average resistivity ρav,
NOTE 10—The parenthetical symbols (+B) and (−B) refer to oppositely
applied magnetic fields where positive field is defined in Fig. 2.
ρA 5
V 12,35 2 V
2I
(10)
(11)
19. Precision and Bias7
19.1 An interlaboratory test program was conducted in 2004
to obtain between-laboratory variability for sheet resistance
where the units of the voltages are in volts, current is in
amperes and w, t, d1', and d2 are in centimetres.
7
A research report containing detailed information is on file at ASTM International Headquarters. Request RR:F01-1018.
and the resistivity at the other position (ρB) is given by:
ρB 5
V 12,57 2 V 21,57 wt
Ω·cm
2I
d2
11
F76 − 08 (2016)´1
TABLE 3 Mobility
and mobility. Four wafers, two thin and two thick, were
cleaved into a set of sites. Four sites from each wafer were sent
to 11 laboratories and each site was tested by 10 or 11
laboratories. Only one measurement was conducted on each
wafer so repeatability cannot be determined.
Wafer
Avg of 4 Sites
S2-Thick
P2-Thick
S1-Thin
P1-Thin
2767.2
3070.2
4057.8
4570.7
SRA
RB
78.4
85.2
105.9
115.6
219.5
238.6
296.4
323.6
19.2 Tables 2-4 are summaries of the typical average and
reproducibility standard deviation found for sheet resistance,
mobility and density for each wafer. The sites did vary in
average level and reproducibilty standard deviation, but were
within expected variation to permit pooling of the results.
SR is a pooled estimate of reproducibility standard based on 4 sites.
R is the largest difference one might expect for single readings taken at two
laboratories (95 % of the time).
19.3 Laboratories had statistically significant systematic
differences for mobility and density which is reflected in the
reproducibility standard deviation. These differences, however,
may not be of practical significance.
Wafer
Avg of 4 Sites
S2-Thick
P2-Thick
S1-Thin
P1-Thin
9.950
12.405
2.501
1.368
A
B
TABLE 4 Density (x 1.0E+12)
19.4 Within Laboratory Intermediate Precision or
Uncertainty—A single laboratory provided readings on each
position on 6 to 8 time periods over a 10-month period. This
can be evaluated as measure of within laboratory intermediate
precision or uncertainty. In accordance with Practice E2554 an
estimate of standard deviation has been computed. In all cases
these results were much smaller than reproducibilty standard
deviation. These are probably larger than would be expected
for repeatability (very short time between readings) but are
illustrative of what long-term variation within a given laboratory might experience.
SRA
RB
0.178
0.239
0.104
0.062
0.499
0.669
0.292
0.173
A
SR is a pooled estimate of reproducibility standard based on 4 sites.
R is the largest difference one might expect for single readings taken at two
laboratories (95 % of the time).
B
TABLE 5 Sheet Resistance (single laboratory uncertainty sd)
Wafer
Avg of 4 Sites
S2-Thick
P2-Thick
P1-Thin
S1-Thin
226.88
164.33
556.57
1126.41
Wafer
Avg of 4 Sites
S2-Thick
P2-Thick
P1-Thin
S1-Thin
2774.3
3088.4
4644.9
4146.2
sd Uncertainty
1.38
1.06
7.25
51.63
TABLE 6 Mobility
20. Keywords
20.1 gallium arsenide; Hall coefficient; Hall data; Hall
mobility; Hall resistivity; semiconductor; silicon; single crystal; van der Pauw
TABLE 2 Sheet Resistance
Wafer
Avg of 4 Sites
P2-Thick
S2-Thick
P1-Thin
S1-Thin
226.12
163.98
557.60
1138.42
SRA
RB
2.24
1.13
17.89
56.59
6.28
3.16
50.09
158.44
A
SR is a pooled estimate of reproducibility standard based on 4 sites.
R is the largest difference one might expect for single readings taken at two
laboratories (95 % of the time).
B
12
sd Uncertainty
27.4
32.1
58.0
92.2
F76 − 08 (2016)´1
TABLE 7 Density (x 1.0E+12)
Wafer
Avg of 4 Sites
S2-Thick
P2-Thick
P1-Thin
S1-Thin
9.951
12.383
2.475
1.358
sd Uncertainty
0.093
0.090
0.024
0.040
APPENDIX
(Nonmandatory Information)
X1. INTERPRETATION
X1.4 The Hall coeffıcient is the ratio of the Hall electric
field (due to the Hall voltage) to the product of the current
density and the magnetic flux density (see Fig. 3) as follows:
X1.1 The interpretation of the results of these measurements
in terms of semiconductor material parameters is often not
straightforward. When more information is needed than is
provided here, the reader is referred to the literature (2, 3, 4).
RH 5
X1.2 The resistivity of a material is the ratio of the potential
gradient parallel to the current in the material to the current
density. For the purposes of this method, the resistivity shall
always be determined for the case of zero magnetic flux.
where:
RH =
EH =
J
=
B
=
X1.2.1 In extrinsic semiconductors with a single type of
charge carrier the resistivity is related to the fundamental
material properties as follows:
ρ5
1
eµn
(X1.1)
Hall coefficient,
Hall electric field,
current density, and
magnetic flux density.
~ µB ! 2 «1
where the mobility, µ, is given in m 2/V·s and the magnetic flux
density, B, is given in tesla. As an example, high-mobility n -type gallium arsenic with a mobility of 4000 cm 2/V·s measured in a field of
0.5 T (5 kgauss) gives a value (µ B) 2 = 0.04 which should be low
enough so as not to introduce significant field-dependent anisotropies
into RH.
When both electrons and holes are present, the following
equation applies:
1
e ~ µ n n1µ p p !
(X1.3)
NOTE X1.1—The Hall coefficient is independent of crystal orientation
provided the crystal structure is cubic and the measurements are performed at low-magnetic fields. For noncubic crystals, the orientation of
the current and magnetic field directions must be chosen appropriately.
The low-magnetic-field condition is given as follows:
where:
ρ = resistivity,
e = magnitude of the electronic charge,
µ = magnitude of the mobility of the charge carrier (X1.5),
and
n = charge carrier density.
ρ5
EH
JB
X1.4.1 For n-type extrinsic semiconductors, in which the
conduction is primarily by electrons, the Hall coefficient is
negative; for p-type extrinsic semiconductors, in which the
conduction is primarily by holes, it is positive. Conventions
relating the signs of the various quantities are shown in Fig. 3.
(X1.2)
where n and p represent the electron and hole densities,
respectively, and µn and µp represent the corresponding average
electron and hole mobilities. Eq 2 is appropriate for intrinsic
semiconductors (where the electron and hole concentrations
are approximately equal).
X1.4.2 For extrinsic semiconductors at temperatures below
the intrinsic region with conduction dominated by a single
charge-carrier type, the Hall coefficient is related to the
material properties as follows:
X1.3 When mutually perpendicular electric and magnetic
fields are impressed on an isotropic solid, the charge carriers
are deflected in the third mutually perpendicular direction. If
the current in this direction is constrained by the boundary of
the solid (to be zero), a transverse voltage is developed to
oppose the deflection of the charge carriers. The magnetic-field
dependence of the transverse voltage has both an odd and an
even component. The even component of transverse voltage is
attributed to magnetoresistance and contact misalignment voltages. The odd component is by definition the Hall voltage, that
is, the component of the transverse voltage which reverses sign
with reversal of magnetic-field direction.
RH 5
r
nq
(X1.4)
where:
r = proportionality factor and
q = charge of the carrier (−e for electrons and + e for holes).
The proportionality factor, which is of the order of unity,
depends on the details of the band structure, scattering mechanism or mechanisms, specimen temperature, magnetic-flux
density, and (in some cases) specimen orientation (13). Detailed knowledge of r is required in order to determine
accurately the charge-carrier density from the Hall coefficient
13
F76 − 08 (2016)´1
X1.5 The average Hall mobility is the ratio of the magnitude
of the Hall coefficient to the resistivity; it is readily interpreted
only in a system with carriers of one charge type.
measured in a specific instance. In many cases, such information is not known and r must be estimated. A summary of the
available information is given separately (2, 3, 4, 14) . When
both electrons and holes are present in comparable quantities,
the density of each type cannot be found from a single,
low-field Hall-coefficient measurement, because the Hallcoefficient depends on the density and mobility of each carrier
(2, 3, 4).
X1.6 The drift mobility of a charge carrier is the ratio of the
mean velocity of the carriers to the applied electric field. In a
single carrier system, either n- or p-type, the drift mobility, µ is
related to the average Hall mobility, µH by the proportionality
factor r,
X1.4.3 In principle, the proportionality factor r can experimentally be made equal to unity by performing measurements
in the “high-field region” where the product of the magnetic
field and the mobility is much greater than one:
µB » 1
Unfortunately, this condition is only practical in special
cases (15) due to the high-magnetic field required for most
semiconductors at room temperature.
µ H 5 rµ
(X1.5)
If r is known for the material being studied and the
conditions of the measurement (2, 3, 4), it is possible to obtain
an accurate value of drift mobility from measurements of the
Hall coefficient and resistivity.
REFERENCES
Effect and Photoelectronic Apparatus,” Journal Physics E: Science
Instruments, Vol 14, 1981, pp. 472–477.
(10) Johansson, N. G. E., Mayer, J. W., and Marsh, O. J.,“ Technique
Used in Hall Effect Analysis of Ion Implanted Si and Ge,” SolidState Electronics, Vol 13, 1970, pp. 317–335.
(11) Crossley, P. A., and Ham, W. E., “Use of Test Structures and Results
of Electrical Tests for Silicon-on-Sapphire Integrated Circuit
Processes,” Journal of Electronic Materials, Vol 2, 1973, pp.
465–483.
(12) Buehler, M. G.,“Semiconductor Measurement Technology: Microelectronic Test Pattertn NBS-3 for Evaluating the Resistivity-Dopant
Density Relationship of Silicon,” NBS Special Publication400-22,
May 1976.
(13) Allgaier, R. S.,“Some General Input-Output Rules Governing Hall
Coefficient Behavior,” The Hall Effect and Its Applications, ed. by C.
L. Chien and C. R. Westgate, Plenum Press, New York, NY, 1980.
(14) Szmulowicz, F.,“Calculation of Optical- and Acoustic-PhononLimited Conductivity and Hall Mobilities for p-Type Silicon and
Germanium,” Physical Review B, Vol 28, 1983, pp. 5943–5963.
(15) Mitchel, W. C., and Hemenger, P. M., “Temperature Dependence of
the Hall Factor and the Conductivity Mobility in p-Type Silicon,”
Journal of Applied Physics, Vol 53, 1982, pp. 6880–6884.
(1) van der Pauw, L. J.,“A Method of Measuring Specific Resistivity and
Hall Effect of Discs of Arbitrary Shape,” Philips Research Reports,
Vol 13, 1958, pp. 1–9.
(2) Putley, E. H.,Hall Effect and Related Phenomena, Butterworth & Co.,
Ltd., London, 1960.
(3) Beer, A. C., Galvanomagnetic Effects in Semiconductors, Academic
Press, Inc., New York, NY, 1963.
(4) Stillman, G. E., Wolfe, C. M., and Dimmock, J. O.,“Hall Coefficient
Factor for Polar Mode Scattering in n-type GaAs,” Journal of Physics
and Chemistry of Solids, Vol 31, 1970, pp. 1119–1204.
(5) Chwang, R., Smith, B. J., and Crowell, C. R.,“Contact Size Effects on
the van der Pauw Method for Resistivity and Hall Coefficient
Measurement,” Solid-State Electronics, Vol 17, 1974, pp. 1217–1227.
(6) Versnel, W., “Analysis of the Greek Cross, a van der Pauw Structure
with Finite Contacts,” Solid-State Electronics, Vol 22, 1979, pp.
911–914.
(7) Buehler, M. G., and Thurber, W. R., “Measurements of the Resistivity
of a Thin Sample with a Square Four-Probe Array,” Solid-State
Electronics, Vol 20, 1977, pp. 403–406.
(8) Hemenger, P. M.,“Measurements of High Resistivity Semiconductors
Using the van der Pauw Method,” Review Science Instruments, Vol
44, 1973, pp. 698–700.
(9) Look, D. C., and Farmer, J. W., “Automated, High Resistivity Hall
ASTM International takes no position respecting the validity of any patent rights asserted in connection with any item mentioned
in this standard. Users of this standard are expressly advised that determination of the validity of any such patent rights, and the risk
of infringement of such rights, are entirely their own responsibility.
This standard is subject to revision at any time by the responsible technical committee and must be reviewed every five years and
if not revised, either reapproved or withdrawn. Your comments are invited either for revision of this standard or for additional standards
and should be addressed to ASTM International Headquarters. Your comments will receive careful consideration at a meeting of the
responsible technical committee, which you may attend. If you feel that your comments have not received a fair hearing you should
make your views known to the ASTM Committee on Standards, at the address shown below.
This standard is copyrighted by ASTM International, 100 Barr Harbor Drive, PO Box C700, West Conshohocken, PA 19428-2959,
United States. Individual reprints (single or multiple copies) of this standard may be obtained by contacting ASTM at the above
address or at 610-832-9585 (phone), 610-832-9555 (fax), or (e-mail); or through the ASTM website
(www.astm.org). Permission rights to photocopy the standard may also be secured from the Copyright Clearance Center, 222
Rosewood Drive, Danvers, MA 01923, Tel: (978) 646-2600; />
14