Astm f 78 97 (2002)
Bạn đang xem bản rút gọn của tài liệu. Xem và tải ngay bản đầy đủ của tài liệu tại đây (74.45 KB, 7 trang )
Designation: F 78 – 97 (Reapproved 2002)
Standard Test Method for
Calibration of Helium Leak Detectors by Use of Secondary
Standards1
This standard is issued under the fixed designation F 78; the number immediately following the designation indicates the year of original
adoption or, in the case of revision, the year of last revision. A number in parentheses indicates the year of last reapproval. A superscript
epsilon (e) indicates an editorial change since the last revision or reapproval.
1. Scope
1.1 This test method covers a procedure for calibrating a
mass spectrometer-type helium leak detector with a series of
commercially available calibrated leaks without need for
recourse to a primary standard.
1.2 Leak detector parameters determined by this test method
include:
1.2.1 Minimum detectable signal, drift noise (8.5, with
recorder; 8.6, without recorder),
1.2.2 Response time,
1.2.3 Minimum detectable leak rate, and
1.2.4 Sensitivity.
1.3 This standard does not purport to address the safety
concerns, if any, associated with its use. It is the responsibility
of the user of this standard to establish appropriate safety and
health practices and determine the applicability of regulatory
limitations prior to use.
3.1.3 standard leak rate—in leak detection, the rate of flow
of atmospheric air of dewpoint less than − 25°C through a leak
under standard conditions specified as follows: (1) the inlet
pressure shall be 1 standard atmosphere 65 % (1016 5 kPa),
(2) the outlet pressure shall be less than 1 kPa (0.01 atm), and
(3) the temperature shall be 23 6 3°C.
3.2 Definitions of Terms Specific to This Standard:
3.2.1 response time—of a leak detector, for the purposes of
this test method, a measure of the speed of response of the
detector to an incoming helium sample.
3.2.1.1 Discussion—In this test method the cleanup time
and response time are assumed to be equal.
3.2.2 sensitivity—of a leak detector, for the purposes of this
test method, the ratio of the change in the output signal to the
applied helium leak rate.
3.3 Other terms used in this test method are defined in
Definitions E 425.
2. Referenced Documents
2.1 ASTM Standards:
E 1 Specification for ASTM Thermometers 2
E 425 Definitions of Terms Relating to Leak Testing 3
4. Summary of Test Method
4.1 At least three calibrated leaks are tested on a helium leak
detector, and a correlation is obtained between the output
indication of the leak detector and the leak rate of the calibrated
leaks. These readings are used to plot a calibration line from
which intermediate values, within specified limits, may be
read.
3. Terminology
3.1 Definitions:
3.1.1 calibrated leak—in leak detection, a device that permits leakage through it at a specified rate, of a specific gas,
under specific conditions, with the downstream side of the
device exposed to a pressure sufficiently low to have negligible
effect on the leak rate.
3.1.2 minimum detectable signal—in leak detection, the
smallest unambiguous output signal that can be derived from a
given particular leak detector. Units are detector scale divisions.
3.1.2.1 Discussion—The minimum detectable signal is determined by the noise present in, and drift of, the output signal.
5. Interferences
5.1 Certain materials, particularly organic compounds, will
entrap or hold helium tracer gas. Use of such materials in
connections between the calibrated leak and the leak should be
minimized to avoid erroneous results. (If the net output
readings from any calibrated leak consistently lie outside the
established limits, the leak should be returned to the supplier
for a recalibration check.)
5.2 The background reading, B, should be at most one
quarter of the output reading, A. If the value of B approaches
that of A, the accuracy of the determination of N will suffer (see
9.3.1).
1
This test method is under the jurisdiction of ASTM Committee F01 on
Electronics and is the direct responsibility of Subcommittee F01.03 on Metallic
Materials.
Current edition approved Dec. 10, 2002. Published May 2003. Originally
approved in 1967. Last previous edition approved in 1997 as F 78 – 97.
2
Annual Book of ASTM Standards, Vol 14.03.
3
Discontinued. See 1991 Annual Book of ASTM Standards, Vol 03.03.
6. Apparatus
6.1 Calibrated Leaks—At least three commercial devices
incorporating leaks, one having a leak rate of approximately
10−9 atm·cm3·s−1(10−10 Pa·m3·s−1), a second having a leak
Copyright © ASTM International, 100 Barr Harbor Drive, PO Box C700, West Conshohocken, PA 19428-2959, United States.
1
F 78 – 97 (2002)
value in the nominal range from 10−8 to 10−7atm·cm3·s−1(10−9
to 10−8 Pa·m3·s−1), and the third having a leak rate of
approximately 10−6 atm·cm3·s−1(10−7 Pa·m3·s−1).
6.1.1 The calibrated leaks shall be obtained from at least
two independent suppliers.
6.1.2 The calibrated leaks shall have been calibrated with
helium gas at a pressure of approximately 1 standard atmosphere 65 % (101 6 5 kPa).
6.1.3 The following information shall be provided with each
calibrated leak:
6.1.3.1 Calibrated leak rate, atm·cm3·s−1(or Pa·m3·s−1),
6.1.3.2 Date of calibration,
6.1.3.3 Temperature of calibration, °C,
6.1.3.4 Temperature coefficient, atm·cm 3 ·s −1 ·°C −1 (or
Pa·m3·s−1·°C−1), and
6.1.3.5 If a reservoir is an integral part of the calibrated leak,
the internal pressure in the reservoir, atm (or Pa) and an aging
correction.
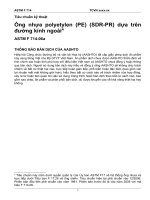
FIG. 1 Schematic Diagram of Apparatus for the Calibration of the
Helium Mass Spectrometer Leak Detector
7. Material
7.1 Helium Gas— for use with calibrated leaks not having
an integral reservoir. The helium gas shall have a purity of at
least 99.9 % and a supply pressure of nominally 1 atm (101
kPa). 4
NOTE 1—It is preferable that five, rather than three, calibrated leaks be
used for initial calibrations of helium leak detectors by this method. At
least two leaks shall be obtained from each of two independent suppliers
when more than three leaks are used.
NOTE 2—Although the data on which this specification has been based
were obtained largely from permeation-type leaks, the calibrated leaks
may be of various types such as capillary, pinched tubing, tapered plug,
etc. However, it is recommended that, with all types of leaks, the
manufacturer’s recommendations be followed to avoid erroneous test
results.
8. Procedure
8.1 Connect the helium leak detector to be tested to a source
of electric power conforming in voltage, frequency, and degree
of regulation to the manufacturer’s specifications.
8.2 Turn on the detector for the warm-up period specified by
the manufacturer.
8.3 Adjust the detector in accordance with the manufacturer’s instructions for maximum sensitivity and for maximum
output for a given helium input.
8.4 Close the inlet valve of the detector.
8.5 If the electron-producing filament is not on, turn it on
and adjust the detector zero position control to obtain an output
signal of at least 10 % of the most sensitive scale.
8.6 If the detector has no recorder output or if a suitable
chart recorder is not available, continue with 8.8; otherwise,
continue with 8.7.
8.7 Minimum Detectable Signal, Test Method A, with Recorder:
8.7.1 Connect the detector output to the recorder.
8.7.2 Record the detector output for 60 min or until the
output indication has reached full scale. Do not readjust any
controls during the recording period.
8.8 Minimum Detectable Signal, Test Method B, without
Recorder:
8.8.1 Observe the detector meter and record its indications
as follows. Do not readjust the controls for the 60-min period
of this test.
8.8.1.1 Record the pointer deflection, in scale divisions, at
time T = 0 min.
8.8.1.2 Record the minimum and maximum pointer deflections occurring in the interval from time T = 0 to T = 1 min.
8.8.1.3 Record the minimum and maximum pointer deflections occurring in the interval from time T = 9 to T = 10 min;
record the deflection occurring at T = 10 min.
6.2 Thermometer, accurate to 61°C or better in the range
from 18 to 28°C inclusive. A thermometer conforming to
Thermometer 63C as prescribed in Specification E 1 is suitable.
6.3 Chart Recorder, for determining Minimum Detectable
Leak, Method A; an instrument suitable for recording the
output of the leak detector under test as a function of time.
6.3.1 The chart recorder shall incorporate a gain control to
permit the deflection of the recorder stylus to be adjusted to full
scale when the leak detector meter is reading full scale with the
leak detector at its most sensitive detection setting.
6.3.2 The time constant of the chart recorder shall not be
greater than that of the leak-detector output meter.
6.3.3 The chart recorder shall be capable of continuous
recording for at least 1 h.
6.4 Stopwatch, calibrated to read in tenths of a second to 60
min over an interval of at least 1 h.
6.5 Leak Auxiliary Manifold—If not incorporated in the
leak detector, evacuable means for connecting the calibrated
leak to the leak detector, incorporating a roughing pump, leak
valve, and pump valve (see Fig. 1).
6.5.1 The roughing pump shall have sufficient pumping
capacity to evacuate the leak auxiliary manifold to an absolute
pressure of less than 50 millitorr (or 7 Pa).
6.5.2 The leak valve shall not act as a source of helium.
6.5.3 Valves and connections shall contain a minimum of
rubber or other polymeric surfaces that can serve as virtual
leaks.
4
Commercially available compressed helium of the specified minimum purity,
supplied in suitable cylinders with appropriate regulators, has been found suitable
for this test method.
NOTE 3—It is preferable that the only exposed polymeric surfaces be
those of O-rings.
2
F 78 – 97 (2002)
9.1.1 If spikes appear in the chart recorder trace, construct a
smooth curve that represents the average values of the detector
output.
9.1.2 From the smoothed curve, determine the detector
output at the beginning and at the end of each minute, in chart
scale divisions. Record these values.
9.1.3 Calculate and record the change in output for each
1-min period. Compare each of these values to a reference
value of 1⁄2 % of the full-scale chart reading.
9.1.3.1 If the change in output per minute is always greater
than or equal to this reference value, identify by inspection the
largest of these changes and record this value, in chart scale
divisions per minute, as the drift.
9.1.3.2 If the change in output per minute is always less than
this reference value, calculate the total change in the 60-min
observation period and divide this value by 60. Record the
quotient in chart scale divisions per minute as the drift.
9.1.4 Examine the recorded output curve and determine if
spikes appear on both sides of the smoothed curve.
9.1.4.1 If they do, identify the two spikes, one on each side
of the smoothed curve, that extend furthest from the curve.
Measure the departures, in chart scale divisions, and add the
two figures. Record this sum as the noise.
9.1.4.2 If spikes appear on only one side of the smoothed
curve, record twice the largest departure from the curve, in
chart scale divisions, as the noise.
9.1.5 Calculate and record the sum of the drift and noise.
Compare this value to a reference value of 2 % of the full-scale
chart reading.
9.1.5.1 If the sum of the drift and noise is greater than or
equal to this reference value, record it, in chart scale divisions,
as the minimum detectable signal.
9.1.5.2 If the sum is less than this reference value, record the
reference value as the minimum detectable signal.
9.1.6 Convert the values for drift, noise, and minimum
detectable signal, recorded in chart scale divisions, into equivalent meter scale divisions as follows:
9.1.6.1 Determine and record the ratio of full-scale meter
divisions to the number of full-scale chart divisions.
9.1.6.2 Multiply by this ratio the values recorded in 9.1.3
(drift), 9.1.4 (noise), and 9.1.5 (minimum detectable signal).
Record these values as the drift, noise, and minimum detectable signal, respectively, expressed in meter scale divisions.
8.8.1.4 In like manner, record the minimum, maximum, and
terminal deflections occurring during every tenth minute for
the 60-min period, that is, from T = 19 to T = 20 min, T = 29
to T = 30 min, etc.
8.9 Minimum Detectable Leak Rate and Sensitivity:
8.9.1 Connect the apparatus as shown in Fig. 1, including
one of the calibrated leaks.
8.9.2 With the filament on, zero the deflector meter reading.
8.9.3 Open the leak valve and then the pump valve.
8.9.4 If the calibrated leak has an integral reservoir, continue with 8.9.6; otherwise continue with 8.9.5.
8.9.5 Connect a source of helium at a pressure of 1 atm (101
kPa) to the calibrated leak.
8.9.6 Evacuate the atmospheric air present in the connections between the leak and the leak detector (to protect the leak
detector).
NOTE 4—It may be desirable to turn off the filament of the mass
spectrometer tube before continuing with 8.9.7.
8.9.7 Open the inlet valve slowly and maintain the leak
detector pressure within the operational pressure range specified by the manufacturer.
8.9.8 Close the pump valve.
8.9.9 With the inlet valve fully open, observe the pressure
indicator of the leak detector. Do not continue until this reading
shows no observable change over 1 min.
8.9.10 Turn on the filament of the mass-spectrometer tube if
it is not on.
8.9.11 Adjust the range multiplier to bring the detector
meter reading on scale. When the meter pointer shows a steady
deflection, with no observable change over 1 min, record the
reading, A, in scale divisions. If required, adjust the gain
control, but do not readjust any controls thereafter for the
duration of this test.
8.9.12 Calculate and record a value equal to 37 % of A.
8.9.13 Using the thermometer, measure the ambient temperature near the leak to the nearest 1°C. Record this value.
8.9.14 Start the stopwatch and simultaneously close the leak
valve as rapidly as possible.
8.9.15 Observe the detector meter continuously. Stop the
stopwatch when the reading has decreased to 37 % of A (this
value was recorded in 8.9.12). Record the reading of the
stopwatch to the nearest 1 s as T, the response time.
NOTE 6—For the purposes of this test method, it is acceptable to sum
drift and noise and to express the result in scale divisions, even though
drift has units of scale divisions per unit time.
NOTE 5—The actual value recorded is the cleanup time, which for the
purposes of this method is taken as the reponse time.
8.9.16 Continue to observe the detector meter. When the
pointer shows a steady deflection, with no observable change
over 1 min, record the reading in scale divisions as the
background reading, B.
8.9.17 Close the inlet valve, vent the sample inlet line to
atmosphere, and replace the calibrated leak with another.
8.9.18 Repeat steps 8.9.1 through 8.9.11, 8.9.13, and 8.9.14
through 8.9.17 until each of the remaining calibrated leaks has
been run.
9.2 Minimum Detectable Signal, Test Method B:
9.2.1 Calculate and record the change in output between the
initial and final meter readings for each of the 10-min intervals,
that is, between T = 0 and T = 10 min, T = 10 and T = 20
min, T = 20 and T = 30 min, etc.
9.2.2 Divide each of these changes in output signal by 10.
Record these values and compare them to a reference value of
1⁄2 % of the full-scale meter reading.
9.2.2.1 If the change in meter readings per 10 min is always
greater than or equal to this reference value, identify by
inspection the largest of these changes and record this value, in
meter scale divisions per minute, as the drift.
9. Calculations
9.1 Minimum Detectable Signal, Test Method A:
3
F 78 – 97 (2002)
9.2.2.2 If the change in meter readings per 10 min is always
less than this reference value, calculate the total change in the
60-min period. Divide the total change value by 60 and record
the result as the drift.
9.2.3 Calculate and record the differences in meter readings
between the maximum and minimum signals for each of the
10th minute intervals including the first minute. By inspection,
identify the largest of these differences and record this value in
meter scale divisions as the noise.
9.2.4 Carry out 9.1.5-9.1.5.2 (Note Section 9).
9.3 Minimum Detectable Leak Rate:
9.3.1 For each calibrated leak, calculate and record the net
output reading, N = A − B, in meter scale divisions.
9.3.1.1 If the leak detector has been set at reduced sensitivity (higher range), correct N accordingly and record the result
in equivalent meter scale divisions at full sensitivity setting.
9.3.2 If the temperature recorded in 8.9.13 differs from that
at which the calibrated leak was calibrated, calculate and
record an adjusted leak rate using the temperature coefficient
supplied by the manufacturer.
9.3.3 Calculate and record the minimum detectable leak rate
(always express the minimum detectable leak rate for a
response time T) in accordance with the relation:
NOTE 7—In some applications it may be desirable to perform a test at
a given leak value. In such cases, at least two calibrated leaks of
approximately the desired value should be used for calibration. A
calibration based on a single leak value is not recommended.
10. Report
10.1 Report the following information:
10.1.1 Date of tests;
10.1.2 Identification of operator;
10.1.3 For each calibration leak used,
10.1.3.1 Serial number of leak;
10.1.3.2 Manufacturer;
10.1.3.3 Type of leak (diffusion or capillary, with or without
integral reservoir);
10.1.3.4 Supplier’s labeled leak rate, atm·cm 3·s−1(or
Pa·m3·s−1); and
10.1.3.5 Temperature coefficient;
10.1.4 Test temperature, °C;
10.1.5 Identification of leak detector;
10.1.6 Drift, meter scale divisions per minute;
10.1.7 Noise, meter scale divisions;
10.1.8 Minimum detectable signal, meter scale divisions;
10.1.9 Response time, T, s;
10.1.10 Background reading, B, meter scale divisions;
10.1.11 Net output reading, N, meter scale divisions;
10.1.12 Minimum detectable leak for response time T; and
10.1.13 Sensitivity.
minimum detectable leak, for response time T
5
~calibrated leak rating! ~minimum detectable signal!
N
where calibrated leak rating = value recorded in 9.3.2, unless
the calibration and test temperatures are the same, and N
= signal due to the calibrated leak as recorded in 9.3.1.
9.4 Sensitivity:
9.4.1 Plot net meter readings against corrected leak rate in
atm·cm3/s (or in Pa·m3/s) on log-log paper for all leaks.
9.4.2 Calculate the coordinates of two convenient points on
the line of best fit to the plotted points by the least squares
method in accordance with Annex A1 and draw the best-fit line
on the plot as a solid line. Record the slope of the best-fit line
as the sensitivity.
9.4.3 On either side of the solid line, construct dashed lines
to represent a 3-sigma limit of 60.33 in accordance with
Annex A2.
9.4.4 Examine the plot. Reject all detector calibration data
from leaks for which the plotted points lie outside the dashed
lines.
11. Precision
11.1 A round-robin evaluation of the precision of this test
method indicates that a 3-sigma limit of 60.33 is typical of the
results that can be expected when commercially available
calibrated leaks are used to calibrate a helium leak detector (see
Annex A2).
11.2 The upper and lower 3-sigma limits are separated by a
factor of 4.5.
NOTE 8—If more precise calibration of a leak detector is desired, the
parties to the test should agree to select leaks for which the data points
when plotted in a manner similar to that of Annex A2 fall within either
2-sigma or 1-sigma limits.
12. Keywords
12.1 leak detection; minimu leak rate; vacuum devices
4
F 78 – 97 (2002)
ANNEXES
(Mandatory Information)
A1. CONSTRUCTION OF LINE OF BEST FIT
log 2.3 3 1027 5 3.36173 2 10 5 26.63827
y(net output)
A1.1 The equation for the line of best fit can be determined
by the least squares method. The equation may be expressed as:
log 12 5 1.07918
y 5 a 1 bx
log 170 5 2.23045
where:
y = net output in divisions,
a = intercept,
b = slope, and
x = leak rate of standard, atmos cm3/sec.
log 1000 5 3
( log x 5 222.62755
( log y 5 6.30963
2
( ~log x! 5 172.63308, ( ~ log x 3 log y! 5 245.67481
A1.2 Since the data are expressed in logarithms, the line
equation 5 will be:
A1.4 Since the number of standard leaks tested in our
example is 3, (n = 3), then
log y 5 a 1 b log x
b 5
then
b5
n( ~log x 3 log y! 2 ( log x 3 ( log y
n( ~log x!2 2 ~ ( log x!2
3~245.67481! 2 ~222.62755!~6.30963!
3~172.63308! 2 ~222.62755! 2
b = 0.97519
a = 1⁄3[6.30963 − 0.97519 (−22.62755)]
a = 9.45859
Hence, in our example the line of best fit will be
and
a 5 1/n ~( log y 2 b( log x!
where n = number of standard leaks being tested.
log y 5 9.45859 1 0.97519 log x
A1.3 The summation of x and y is mathematically expressed as:
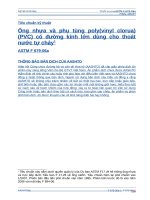
A1.5 To construct this line select two points such as 10−9
and 10−6 atm·cm3/s.
( log x 5 (i 5 1n log xi
Substituting these values into the equation we have
( log y 5 (i 5 1n log yi
log 1029 5 1.00000 2 10 5 29
For example, assume three leaks, 2.5 3 10−9, 4.1 3 10 −8,
and 2.3 3 10−7 atm·cm3/s, have been tested and net output
readings of 12, 170, and 1000 divisions have been obtained
from the respective leaks (see Fig. A1.1). Expressed as
logarithms 6 we have:
x (leak rate)
and
log 1026 5 4.00000 2 10 5 26
−9
Case I (10
atm·cm3/s):
log y 5 9.45859 1 0.97519 ~29!
log y 5 0.68188
log 2.5 3 1029 5 1.39794 2 10 5 28.60206
y 5 4.8
log 4.1 3 1028 5 2.61278 2 10 5 27.38722
−6
Case II (10
3
atm·cm /s):
log y 5 9.45859 1 0.97519 ~26!
log y 5 3.60745
5
Crow, Davis, and Maxfield, Statistics Manual, Dover Publications, Inc., New
York, N. Y.
6
For ease of computation the logarithmic values have been expressed as negative
numbers.
y 5 4.1 3 10 3
This line is shown in Fig. A1.1.
5
F 78 – 97 (2002)
FIG. A1.1 Net Output Reading versus Corrected Leak Rate for Calibration of Helium Leak Detectors
A2. CONSTRUCTION OF SIGMA LIMITS
A2.1 A round-robin test has determined that a 3-sigma limit
of6 0.33 is the best that could be expected from the usual run
of purchased leaks. The sigma value has been determined from
the equation:
In our example the 3-sigma limits would be log y 6 0.33 in
Case I and Case II.
Case I:
s 5 =(i ~ni 2 2!si2 / (i ~ni 2 2!
log y 5 0.68188 6 0.33
log y 5 1.01188 or 0.35188
where:
ni = number of tests by each participant, and
si = standard deviation from each participant’s test data.
In general, si can be obtained from:
y 5 1.0 3 101 or 2.3
Case II:
log y 5 3.607456 0.33
si 5 =(~y 2 y1!2 / ~n 2 2!
log y 5 3.93745 or 3.27745
where:
y = output reading of the leak detector, and
y1 = calculated value by least squares method.
y 5 8.7 3 103 or 1.9 3 103
These values are shown in Fig. A1.1 as the 3-sigma limits.
6
F 78 – 97 (2002)
ASTM International takes no position respecting the validity of any patent rights asserted in connection with any item mentioned
in this standard. Users of this standard are expressly advised that determination of the validity of any such patent rights, and the risk
of infringement of such rights, are entirely their own responsibility.
This standard is subject to revision at any time by the responsible technical committee and must be reviewed every five years and
if not revised, either reapproved or withdrawn. Your comments are invited either for revision of this standard or for additional standards
and should be addressed to ASTM International Headquarters. Your comments will receive careful consideration at a meeting of the
responsible technical committee, which you may attend. If you feel that your comments have not received a fair hearing you should
make your views known to the ASTM Committee on Standards, at the address shown below.
This standard is copyrighted by ASTM International, 100 Barr Harbor Drive, PO Box C700, West Conshohocken, PA 19428-2959,
United States. Individual reprints (single or multiple copies) of this standard may be obtained by contacting ASTM at the above
address or at 610-832-9585 (phone), 610-832-9555 (fax), or (e-mail); or through the ASTM website
(www.astm.org).
7