Api publ 1628e 1996 scan (american petroleum institute)
Bạn đang xem bản rút gọn của tài liệu. Xem và tải ngay bản đầy đủ của tài liệu tại đây (999.34 KB, 23 trang )
A P I P U B L * l b 2 8 E 96
0732290 O559203 T 8 8
Operation and Maintenance
Considerations for Hydrocarbon
Remediation Systems
API PUBLICATION 1628E
FIRST EDITION, JULY 1996
--`,,-`-`,,`,,`,`,,`---
L
s16;,
American
Petroleum
Institute
Strategies for Tot
àayi
Environmental Partnership
Copyright American Petroleum Institute
Provided by IHS under license with API
No reproduction or networking permitted without license from IHS
Not for Resale
~
0 7 3 2 2 9 0 0559202 ỵ L 4
A P I PUBL*Lb28E ỵ b
-~
Environmental Partnership
One of the most significant long-term trends affecting the future vitality of the petroleum industry is the public’s concerns about the environment. Recognizing this trend, API
member companies have developed a positive, forward looking strategy called STEP
Strategies for Today’s Environmental Partnership. This program aims to address public
concerns by improving industry’s environmental, health and safety Performance; documenting performance improvements; and communicating them to the public. The foundation of STEP is the API Environmental Mission and Guiding Environmental Principles.
API standards, by promoting the use of sound engineering and operational practices, are
an important means of implementing API’s STEP program.
API ENVIRONMENTAL MISSION AND GUIDING
ENVIRONMENTAL PRINCIPLES
--`,,-`-`,,`,,`,`,,`---
The members of the American Petroleum Institute are dedicated to continuous efforts to
improve the compatibility of our operations with the environment while economically
developing energy resources and supplying high quality products and services to consumers. The members recognize the importance of efficiently meeting society’s needs and our
responsibility to work with the public, the government, and others to develop and to use
natural resources in an environmentally sound manner while protecting the health and
safety of our employees and the public. To meet these responsibilities, API members
pledge to manage our businesses according to these principles:
To recognize and to respond to community concerns about our raw materials, products and operations.
To operate our plants and facilities, and to handle our raw materials and products in a
manner that protects the environment, and the safety and health of our employees
and the public.
To make safety, health and environmental considerations a priority in our planning,
and our development of new products and processes.
To advise promptly appropriate officials, employees, customers and the public of
information on significant industry-related safety, health and environmental hazards,
and to recommend protective measures.
To counsel customers, transporters and others in the safe use, transportation and disposal of our raw materials, products and waste materials.
To economically develop and produce natural resources and to conserve those
resources by using energy efficiently.
To extend knowledge by conducting or supporting research on the safety, health and
environmental effects of our raw materials, products, processes and waste materials.
To commit to reduce overall emissions and waste generation.
To work with others to resolve problems created by handling and disposal of hazardous substances from our operations.
To participate with government and others in creating responsible laws, regulations
and standards to safeguard the community, workplace and environment.
To promote these principles and practices by sharing experiences and offering assistance to others who produce, handle, use, transport or dispose of similar raw materials, petroleum products and wastes.
Copyright American Petroleum Institute
Provided by IHS under license with API
No reproduction or networking permitted without license from IHS
Not for Resale
~
A P I PUBL*Lb28E
ỵb
0732290 0559203 ơ 5 0
m
Operation and Maintenance
Considerations for Hydrocarbon
Remediation Systems
Manufacturing, Distribution and Marketing Department
American
Petroleum
Institute
Copyright American Petroleum Institute
Provided by IHS under license with API
No reproduction or networking permitted without license from IHS
Not for Resale
--`,,-`-`,,`,,`,`,,`---
API PUBLICATION 1628E
FIRST EDITION, JULY 1996
A P I PUBLxLb2BE ỵ b
O732290 05592OLl 7 9 7
=
SPECIAL NOTES
API publications necessarily address problems of a general nature. With respect to particular circumstances, local, state, and federal laws and regulations should be reviewed.
API is not undertaking to meet the duties of employers, manufacturers, or suppliers to
warn and properly train and equip their employees, and others exposed, concerning health
and safety risks and precautions, nor undertaking their obligations under local, state, or
federal laws.
Information concerning safety and health risks and proper precautions with respect to
particular materials and conditions should be obtained from the employer, the manufacturer or supplier of that material, or the material safety data sheet.
Nothing contained in any API publication is to be construed as granting any right, by
implication or otherwise, for the manufacture, sale, or use of any method, apparatus, or
product covered by letters patent. Neither should anything contained in the publication be
construed as insuring anyone against liability for infringement of letters patent.
Generally, API standards are reviewed and revised, reaffirmed, or withdrawn at least
every five years. Sometimes a one-time extension of up to two years will be added to this
review cycle. This publication will no longer be in effect five years after its publication
date as an operativeAPI standard or, where an extension has been granted, upon republication. Status of the publication can be ascertained from the API Authoring Department
[telephone (202) 682-8000]. A catalog of API publications and materials is published
annually and updated quarterly by API, 1220 L Street, N.W., Washington, D.C. 20005.
This document was produced under API standardization procedures that ensure appropriate notification and participation in the developmental process and is designated as an
API standard. Questions concerning the interpretation of the content of this standard or
comments and questions Concerning the procedures under which this standard was developed should be directed in writing to the director of the Authoring Department (shown on
the title page of this document), American Petroleum Institute, 1220 L Street, N.W.. Washington, D.C. 20005. Requests for permission to reproduce or translate all or any part of the
material published herein should also be addressed to the director.
API publications may be used by anyone desiring to do so. Every effort has been made
by the institute to assure the accuracy and reliability of the data contained in them; however, the Institute makes no representation, warranty, or guarantee in connection with this
publication and hereby expressly disclaims any liability or responsibility for loss or damage resulting from its use or for the violation of any federal, state, or municipal regulation
with which this publication may conflict.
API standards are published to facilitate the broad availability of proven, sound engineering and operating practices. These standards are not intended to obviate the need for
applying sound engineering judgment regarding when and where these standards should
be utilized. The formulation and publication of API standards is not intended in any way to
inhibit anyone from using any other practices.
Any manufacturer marking equipment or materials in conformance with the marking
requirements of an API standard is solely responsible for complying with all the applicable requirements of that standard. API does not represent, warrant, or guarantee that such
products do in fact conform to the applicableAPI standard.
All rights reserved No part of this work may be reproduced stored in a retrieval system,
or transmitted by any means, electronic, mechanical,photocopying, recording, or otherwise, without prior written permission from the publisher: Contact the Publisher;
API Publishing Services, 1220 L Street, N. W ,Washington,D.C. 20005.
Copyright Q 1996American Petroleum institute
--`,,-`-`,,`,,`,`,,`---
Copyright American Petroleum Institute
Provided by IHS under license with API
No reproduction or networking permitted without license from IHS
Not for Resale
~
A P I P U B L * L b 2 8 E 96 W 0732290 0557205 623
m
FOREWORD
--`,,-`-`,,`,,`,`,,`---
API publications may be used by anyone desiring to do so. Every effort has been made
by the Institute to assure the accuracy and reliability of the data contained in them; however, the Institute makes no representation, warranty, or guarantee in connection with this
publication and hereby expressly disclaims any liability or responsibility for loss or damage resulting from its use or for the violation of any federal, state, or municipal regulation
with which this publication may conflict.
Suggested revisions are invited and should be submitted to the director of the Manufacturing, Distribution and Marketing Department, American Petroleum Institute, 1220 L
Street, N.W.. Washington, D.C. 20005.
iii
Copyright American Petroleum Institute
Provided by IHS under license with API
No reproduction or networking permitted without license from IHS
Not for Resale
~
~~
~
A P I PUBL*lb28E
0732290 05592Ob 5 b T
96
CONTENTS
Page
SECTION 1-INTRODUCTION ......................................................................................
1.1 Common O&M Problems ........................................................................................
1.2 O&M Planning .........................................................................................................
1
1
1
SECTION 2-ROUTINE O&M REQUIREMENTS........................................................
2
2
2.1 An O&M Plan ...........................................................................................................
LNAPL
Recovery
Systems
.......................................................................................
2
2.2
2.2.1 Data Collection and Evaluation of LNAPL Recovery Systems
2
Overview.......................................................................................................
2.2.2 Data Collection and Evaluation of LNAPL Recovery Systems................... 2
2.3 Groundwater Recovery Systems ............................................................................... 3
2.3.1 General .........................................................................................................
3
2.3.2 Data Collection and Evaluation of Groundwater Recovery Systems........... 5
2.4 Soil Remediation Systems......................................................................................... 6
2.4.1 Overview .......................................................................................................
6
2.4.2 Data Collection/Evaluation of Soil Remediation Systems...........................
6
2.5 Groundwater and Air Treatment Systems .................................................................7
2.5.1 Overview ........................................................................................................ 7
2.5.2 Data CollectiodEvaluation of Groundwater and Air Treatment Systems .....8
SECTION 3-REHABILITATIONPROBLEM TROUBLESHOOTING......................
3.1 General ...................................................................................................................
3.2 Poor Design ............................................................................................................
3.3 Inorganic Scaling.....................................................................................................
3.4 Iron Bacteria/Biofouling ........................................................................................
3.5 Cold Weather ..........................................................................................................
SECTION 4-SY
STEM O&M COMPARISONS..........................................................
Figures
I-Cumulative Recovery vs . Time for Different Water Pumping Rates .......................
2-Hydrocarbon Mass Removal Rate vs . Time .............................................................
3-Groundwater Influenfiffluent Concentration Graphs...........................................
Tables
1-Well Efficiency Test Procedures .............................................................................
2-Pump Efficiency Test Procedures ...........................................................................
3-Process Monitoring Options and Data Interpretation .............................................
4-Operational Consideration for Inorganic Scaling .................................................
5-Free Product Recovery and Control Systems and Equipment ..............................
Wornparison of Treatment Alternatives for Removal of Dissolved
Petroleum Hydrocarbons in Groundwater............................................................
--`,,-`-`,,`,,`,`,,`---
V
Copyright American Petroleum Institute
Provided by IHS under license with API
No reproduction or networking permitted without license from IHS
Not for Resale
10
10
10
12
12
12
13
4
9
11
5
5
8
12
14
15
-
A P I PUBL*Lb28E 9b
a
0732290 0559203 4Tb
--`,,-`-`,,`,,`,`,,`---
Operation and Maintenance Considerations for
Hydrocarbon Remediation Systems
SECTION 1-INTRODUCTION
a.
b.
c.
d.
Limited guidance is currently available regarding operation and maintenance (O&M) procedures necessary to
achieve and maintain optimal performance of petroleum
hydrocarbon remediation systems. O&M is extremely critical in optimizing effective system performance. Costs for
O&M can vary significantly depending on the type of system and the operating environment. Since long-term O&M
costs can be the most expensive item associated with a corrective action project, it is important to consider O&M
requirements when selecting remediation technologies and to
plan and execute routine 0&M procedures. API Publication
1628E addresses routine O&M procedures, rehabilitation,
troubleshooting, and comparisons that are useful as guidance
in selecting appropriate remediation and treatment systems
for removal of Light Non-aqueous Phase Liquids
(LNAPL) and for remediation of groundwater and soil
containing concentrations of chemical(s) of concern above
site target levels.
Temperaturelweather extremes.
Inorganic scaling.
Iron bacteria and other biofouling.
Security problems.
O&M considerations should be incorporated during system design in order to select the most appropriate system for
meeting the specific conditions of a particular site. Examples of design issues that can affect O&M include the following:
a.
b.
c.
d.
Withdrawal and/or treatment approach not suited to site;
Incorrect pump sizing.
Equipment not compatible.
Poor well design.
1.2 O&M Planning
Considering the preceding discussion, proper planning of
O&M considerations during conceptual and detailed 4stem
design is critical for optimizing system performance and
cost-effectiveness. The key to successful planning for system O&M lies with developing basic guidelines and consistency. During design, the following basic guidelines
should be considered and incorporated into an organized
O&M plan:
1.1 Common O&M Problems
Typically, O&M problems can be linked to one of three
major categories; (a) inadequate routine monitoringladjustment, (b) the physical environment within which the system
is exposed, and (c) poor system design. Any of these factors
can result in a significant increase in costs associated with
O&M, which can often be prevented.
Routine O&M monitoring and system adjustment can
provide for optimal operation of hydrocarbon remediation
systems. Common problems associated with inadequate
routine evaluations include the following:
a.
b.
c.
d.
Identify O&M requirements and potential problems.
Develop an O&M data collection checklist.
Establish O&M frequency.
Develop a plan for routine data evaluation.
e. Compare O&M data evaluation with design criteria.
f. Modify system operation based on the preceding comparison.
a. Loss of plume containment.
b. Inefficient recovery of LNAPL.
c. Water discharge violations.
d. Other permit violations.
e. Excessive power usage and utility costs.
f. Extended remediation time.
g. Changing regulatory requirements.
The following sections of this publication provide general
guidance that will be useful for preparing O&M plans and
implementing O&M programs. Guidance is provided concerning routine O&M data collectiodevaluation criteria for
LNAPL recovery systems, groundwater recovery systems,
soil remediation systems, and groundwater and air treatment
systems. Correction of maintenance problems, including
rehabilitation and troubleshooting guidelines for recovery
and treatment systems is addressed. Finally, a comparison
of O&M requirements and the level of effort for different
remedial approaches is presented. This information will be
particularly helpful in designing systems to reduce longterm O&M costs.
In many cases, the physical environment in which the
remediation equipment and systems are exposed can cause
major O&M problems. When these conditions are persistent, O&M requirements become more difficult and complex, and associated costs escalate accordingly. Examples
of the more common problems associated with the physical
environment include the following:
1
Copyright American Petroleum Institute
Provided by IHS under license with API
No reproduction or networking permitted without license from IHS
Not for Resale
2
API PUBLICATION
1628E
2.1
An O&M Plan
Prior to implementing a remediation system, an O&M
plan should be prepared. An O&M plan should be sufficiently detailed to be used as a guide in the operation and
routine maintenance of the system by personnel who have
little prior knowledge of the system or its operation.
At a minimum, O&M plans should include (a) a general
process description, where the separate subsystems of the
remedial system are described; (b) an operations section,
which includes safety issues, system start-up procedures,
system optimization procedures, system operational indicators, and an O&M checklist for data collection; (c) a maintenance section which outlines routine and scheduled
maintenance procedures and sampling requirements and
includes tables to aid in troubleshooting system malfunctions; and (d) an updated procedures section, in which
changes in O&M procedures will be documented. Equipment manufacturers’ manuals and bulletins, system sampling procedures. operator logs, and pertinent engineering
drawings should also be included in the plan.
The following sections provide guidance on routine
O&M data collection and evaluation criteria for different
aspects of hydrocarbon recovery systems.
2.2
LNAPL Recovery Systems
The first goal for hydrocarbon release remediation is to
prevent further LNAPL migration and to recover as much of
the mobile LNAPL as possible while minimizing residual
losses. This procedure generally involves source removal or
mitigation and the installation of a system of trenches,
sumps, or withdrawal wells from which LNAPL is skimmed
andlor pumped with groundwater to maintain hydraulic control of the plume of dissolved chemical(s) of concern in the
groundwater.
The operation of withdrawal systems to recover LNAPL
will vary depending on site-specific conditions and the
objectives of the remediation program. Sometimes skimming or pumping LNAPL from trenches, sumps, and wells
without pumping groundwater can be an effective technique
for layers of LNAPL that are relatively static and remain in
the vicinity of the release. In most cases, however, concurrent groundwater withdrawal will be required to maintain
containment of the plume and to increase the hydraulic gradient to enhance the recovery of LNAPL.
Concurrent pumping of groundwater from trenches,
sumps, or wells must be carefully controlled by monitoring
plume conditions and adjusting withdrawal rates to limit
plume migration and excessive drawdown. If groundwater
pumping rates are too low, there is a risk of losing plume
containment. On the other hand, if groundwater pumping
Copyright American Petroleum Institute
Provided by IHS under license with API
No reproduction or networking permitted without license from IHS
O&M REQUIREMENTS
rates are too high, LNAPL recovery will generally diminish
due to an increasing volume of LNAPL that wili be lost to
residual saturation throughout the cone of depression; this is
often referred to as the smear zone. Thus, for a given well
or trench configuration, groundwater pumping rates should
be established to meet the criteria of plume containment and
LNAPL recovery maximization.
Since many different pumping configurations may satisfy
the requirements of plume control, some additional criteria
must be used to optimize system operation while keeping
maintenance costs to a minimum. Depending on unit treatment costs and remediation objectives, minimizing groundwater withdrawal for the duration of the remediation period,
maximizing total LNAPL recovery, or maximizing the
LNAPL recovered per volume of groundwater pumped may
be rational criteria.
During recovery system design, consideration must be
given to total groundwater withdrawal rates and total
LNAPL recovery. For a given recovery system, pumping
rates will be designed to control LNAPL migration, and
recoverable LNAPL volume will be estimated to determine
the design that will yield the maximum recovery. Maximum LNAPL recovery will be obtained by minimizing the
total drawdown over the zone of the LNAPL plume, while
maintaining plume control around the plume perimeter. For
the same total pumping rate, LNAPL recovery will generally increase with the number of wells. The economically
optimum number of wells will depend on the tradeoff
between costs of well installation and operation versus the
benefit gained by reducing the amount of LNAPL lost to
residual saturation.
2.2.1 DATA COLLECTION AND EVALUATION OF
LNAPL RECOVERY SYSTEMS OVERVIEW
Routine 0 & M data collection and evaluation of LNAPL
recovery systems are essential for ensuring that remediation
design criteria are satisfied in a cost-effective manner. Data
collection criteria are outlined in the following section.
2.2.2 DATA COLLECTION AND EVALUATION OF
LNAPL RECOVERY SYSTEMS
After design and installation of a recovery system, the
operating system must be monitored to enable adjustments
to be made to maintain system effectiveness. Periodic measurements should be made of the following parameters:
a. Cumulative LNAPL recovered.
b. LNAPL and groundwater recovery rates.
c. LNAPL thickness at individual observation wells.
d. Corrected groundwater table elevations for each observation well.
Not for Resale
--`,,-`-`,,`,,`,`,,`---
SECTION 2-ROUTINE
~~
P U B L a L b 2 8 E 96 D 0732290 0559209 279 D
OPERATION AND
e.
f.
g.
h.
MAINTENANCE
CONSIDERATIONSFOR HYDROCAR6ON
2.2.2.3
2.2.2.4 WelVPump Efficiency
System Downtime Summary
All downtimes, along with corrective measures taken to
bring the system back on-line, should be reviewed. Examples include high tank shutoff; compressor or pump failures; plugging of discharge lines, wells, infiltration
galleries, filters, or flow meters: or other system problems.
Any system problems that are occurring repeatedly or that
have historically caused other shutdowns of the system
should also be reviewed. This information will allow for
evaluation of the overall system operation record to ensure
maximum operating efficiency.
LNAPL Information
LNAPL thickness, the method of recovery, and the volume of LNAPL recovered should be evaluated for a particular time period. The total volume of LNAPL recovered
since system start-up should also be evaluated to determine
any single significant recovery event that may have
occurred. The data should be tabulated and graphed for
each LNAPL recovery location and should include volume
recovered, LNAPL thickness, and groundwater flow rates
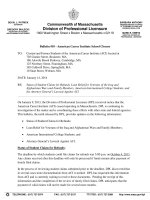
and elevations. Additionally, a plot of total LNAPL recovered versus time should be evaluated. Review of these data
plots will allow evaluation of the effectiveness of, and the
necessity for, continued LNAPL recovery. An example plot
Copyright American Petroleum Institute
Provided by IHS under license with API
No reproduction or networking permitted without license from IHS
Plume Containment
To ensure that the plume is being effectively contained,
groundwater elevations, LNAPL thickness, and LNAPL distribution data should be evaluated; this is an important
aspect of evaluating system performance. An analysis of
system capture (capture zone analysis)should then be performed. This evaluation can be accomplished by flow net
analysis, analytical approaches, or models.
The frequency of routine O&M data collection and monitoring will vary depending on several factors, including size
and complexity of the recovery system, operating conditions, equipment reliability, remote monitoring capability,
and regulatory requirements. Most of the major aspects of
LNAPL recovery systems should be monitored and evaluated at
least monthly; however, some large systems may require
weekly or even more frequent attention. Testing other elements,
such as specific capacity and pump efficiency, might be performed on a semi-annual basis. Again, the frequency of monitoring and data collection will be very site- and goal specific.
A consistent procedure for data evaluation is just as critical as collecting the data. Monitoring data should be evaluated to determine whether the LNAPL plume is being
contained and whether LNAPL recovery is being maximized as efficiently as possible. Evaluation of system performance should include noting any trends, patterns, or
anomalies, such as unusual groundwater fluctuations, major
changes in LNAPL thickness or distribution, and the relationship of such patterns to hydrologic impacts, subsurface preferential pathways, or other site features.
Examples of data evaluation procedures are outlined in the
following.
2.2.2.2
3
of cumulative recovery versus time for different water
pumping rates is shown on Figure 1.
Pump settings relative to LNAPL elevation.
General equipment condition and power usage.
Pump/well efficiency data.
Line pressures.
2.2.2.1
REMEDIATION SYSTEMS
Routine monitoring of pumping rates and water levels can
provide indications of well and pump efficiency problems.
However, in some cases well and pump efficiency or capacity tests should be conducted and evaluated at least semiannually. The results of each test should be compared to the
original performance tests conducted after system installation. Each well/pump should be redevelopedheconditioned
if the production rate decreases below 75 percent of the
original test rate. Procedures for conducting well and pump
performance tests are provided in Tables 1 and 2, respectively.
Well and pump efficiency testing provides a method to
determine decreased pump performance. There are several
causes for a decreased performance, including biofouling,
scaling, silting, and deterioration of equipment due to exposure to hydrocarbons. Rehabilitation alternatives for dealing with these problems are presented in the following
sections. Other data collectiodevaluation checks that should
be performed to ensure proper O&M include the following:
a. Gauge the well depth to check for accumulations of sand
or silt.
b. Check water/LNAPL level versus pumping rate to evaluate potential screen plugging problems.
c. Conduct motor resistance and amperage tests on all
pump motors.
d. Check switchgear, motor starters, and electrical circuits;
e. Remove, inspect, clean, and replace interface detection
probes.
f. Repair, as necessary, pump hoses, safety cables, and
electrical power cables.
2.3 Groundwater Recovery Systems
2.3.1 GENERAL
Most hydrocarbon recovery sites require concurrent withdrawal of groundwater. The objectives of pumping groundwater may be (a) to contain LNAPL, (b) to enhance LNAPL
recovery, (c) to contain hydrocarbons dissolved in groundwater, (d) to recover/treat groundwater with concentrations of
the chemical(s) of concern above site target levels, and (e) to
dewater zones for application of soil vapor extraction. A spe-
Not for Resale
--`,,-`-`,,`,,`,`,,`---
API
____
~
A P I PUBL*KLbZBE 96
0732290 0559230 T90
API PUBLICATION
1628E
4
30
25
20
s
o
p!
.-9
15
-ma
f
o
c)
10
5
O
O
50
150
1O0
200
250
Time
--`,,-`-`,,`,,`,`,,`---
EXPLANATION
+ 50 fP I day pumping
-C- 75 fỵ3 I day pumping
1O0 ft3 I day pumping
Figure l-Cumulative Recovety vs. Time for Different Water Pumping Rates
cific site may incorporate any or all of these goals for groundwater withdrawal. Regardless of the goals, when groundwater withdrawal is required, withdrawal rates should be
minimized to the extent possible while still meeting the
hydraulic control goals.
Based on the hydrogeologic properties of the site and the
hydrocarbon properties, calculations should be made to
determine the following:
a. The capture zone of the recovery system.
b. The configuration of the system required to contain and
remove the dissolved and LNAPL.
The capture zone is the zone of hydraulic influence within
which LNAPL and groundwater will flow to the recovery
Copyright American Petroleum Institute
Provided by IHS under license with API
No reproduction or networking permitted without license from IHS
point. The groundwater pumping rate and system location
should create a capture zone that will encompass the
LNAPL and dissolved plumes, based on site target levels.
Groundwater discharge from a recovery system should be
carefully controlled so that water Withdrawal is minimized
and LNAPL withdrawal is maximized. Lower pumping
rates cause reduced drawdown and limit the vertical section
of the aquifer exposed to contact with LNAPL, which will
reduce the vertical extent of the LNAPL. In many instances,
multiple wells pumping at lower individual rates will be
more effective than fewer wells pumping at higher rates.
Considering the preceding discussion, routine O&M data
collection and evaluation of groundwater recovery systems
are essential for ensuring that design criteria and target levels
Not for Resale
____
____
~
A P I PUBL*:Lb2öE 9b W 0732290 0559211 927 W
OPERATION AND
MAINTENANCE
CONSIDERATIONS FOR HYDROCARBON
REMEDIATION
SYSTEMS
Table 1-Well EfficiencyTest Procedures
Step
Performed
J
J
J
J
J
J
J
J
J
J
J
--`,,-`-`,,`,,`,`,,`---
J
J
Table 2-Pump
Step
Performed
Steps
Shut in well 24 hours prior to the test.
Instail temporary well flow meter.
Measure and record the following:
- Length from pump suction depth to well datum at top of
casing (TOC).
- Distance from center of discharge pipe to center of pressure gauge dial.
- Distance from TOC to center of discharge pipe.
Calibrate well pressure gauge or replace with a calibrated test gauge.
Begin test by measuring the depth to well liquids from TOC
using an interface probe; record time, the depth to oil
(DTO), and the depth to water (DTW).
Close. the discharge flow valve, start the well pump, and
open the discharge flow valve to get a steady flow rate
(approximately onequarter of total flow rate capacity)
measund through the flow meter.
Check DTO and DTW and maintain steady flow rate until
these parameters stabilize.
Record time, flow rate, discharge pressure, DTO, and DTW.
Perform a step test on the well by increasing the well flow in
increments of approximately onequarter of the total flow
rate capacity and repeating the previous two measurement
procedures until the well has reached its maximum flow
rate.
Estimate the specific capacity by dividing each flow rate by
the corresponding drawdown. Plot DTO and DTW versus
rate and compare with previous test results.
J
Efficiency Test Procedures
Steps
Calculate the total pump discharge head (Ht) for each step
of the test:
Ht = hs + dl + hg + hpg + Vd2/64.4
Where:
hs = distance from top of casing (TOC) or
measuring point to well pumping liquid
level (feet).
dl = distance from TOC or measuring point to
center line of discharge pipe (feet).
hg =discharge pressure [gauge reading in pounds
per square (psi) multiplied by 2.311 (feet).
hpg = distance from center line of discharge pipe
to center of pressure gauge (feet).
Vd = flow velocity in discharge pipe (feet/
second).
J
Each step of the test represents a point on the pump
performance curve (total head vs. flow rate); compare
the test results to the manufacturers’pump performance
curve and also to the original pump performance curve;
test points that fall below these performance curves
indicate the pump is operating inefficiently and may
require maintenance attention.
Note: Use the data generated during well testing (see Table 1).
Notes: 1. The well tests should be performed only when the recovery sys
tem is in operation.
2. Maintenance of the welUpump system should be considered if
the current test results show a decline in the specific capacity of
the well of 25 percent or greater below original test results.
e. Power usage.
f. General equipment condition (pumps, controls, treatment
system).
g. Pump/well efficiency data.
h. Line pressures.
i. LNAPL information.
are satisfied in a cost-effective manner. Data collection and
evaluation criteria are outlined in the following section.
2.3.2 DATA COLLECTION AND EVALUATION OF
GROUNDWATER RECOVERY SYSTEMS
Most of the data collected during routine monitoring discussed in Section 2.2 will also apply to evaluating groundwater recovery systems. A groundwater recovery-system
design will vary from site to site depending on the objectives, target levels, and the site-specific hydrogeologic conditions. The focus of routine data collection and evaluation
should be to ensure that the system is meeting the design
objectives and the permit requirements in a cost-effective
manner. After design and installation of a recovery system,
the operating system must be monitored to enable adjustments to be made to maintain system effectiveness. Data
collection requirements include the following:
a. Actual and corrected groundwater table elevations for
each recovery and monitoring well.
b. Water quality from selected wells.
c. Pumping rates for individual wells.
d. System pumping rate.
Copyright American Petroleum Institute
Provided by IHS under license with API
No reproduction or networking permitted without license from IHS
5
Data collection frequency will vary from site to site
depending on several factors, including the size and complexity of the recovery system, operating conditions, equipment reliability, remote monitoring capability, and
regulatory requirements. Specific factors that will usually
dictate monitoring frequency for groundwater recovery systems include the following:
a. Degree of groundwater table fluctuations or other hydrogeologic conditions that could significantly alter flow patterns over short time frames.
b. Pumping rate fluctuations or related factors that could
result in a loss of plume containment.
c. Aquifer sensitivity.
d. Regulatory requirements.
In the absence of complicating site conditions, data necessary to evaluate flow patterns and optimum pumping rates
should be collected and evaluated at least monthly.
As with LNAPL recovery systems, evaluation of system
performance should include evaluating any trends, patterns,
Not for Resale
~
~~
API P U B L * l b 2 8 E ï b
0732290 0559212 863 W
API PUBLICATION
1628E
or anomalies, such as unusual groundwater fluctuations,and
the ways such patterns affect the performance of the recovery system. The data evaluation should determine if the system is operating as designed to meet the program objectives
(i.e., plume containmenthecovery, pumping rates minimized). Complete evaluations will allow for system adjustments to be made for system optimization.
Plume containment and pumping optimization are probably the most important data evaluation goals. Data evaluation procedures should include the following:
a. System Performance summary.
b. LNAPL recovery and dissolved hydrocarbon concentration information.
c. Plume containment evaluation (capture zone analysis).
d. Welllpump efficiency evaluations.
e. Other system checks (i.e., power usage, silting problems).
These data evaluation procedures are essentially the same
as those discussed in the previous section on LNAPL recovery systems (see 2.2-2.2.2.3).
2.4
2.4.1
Soil Remediation Systems
OVERVIEW
There are several alternatives for remediating soils containing petroleum hydrocarbons above site target levels,
ranging from physical excavation with surface disposal/
treatment to in-situ techniques. By far the most common
techniques are in-situ vapor extraction and bioremediation.
Vapor extraction is accomplished by increasing the movement of air through the hydrocarbon-containing soils in the
unsaturated zone to remove volatile hydrocarbons. This
technique is often referred to as soif venting or soil vapor
extraction. Bioremediation techniques for soil remediation
are commonly accomplished by bioventing, which is a
method closely related to soil venting. The purpose of bioventing is to move air through the hydrocarbon-containing
soils to provide an oxygen supply to stimulate bioremediation processes. The operational difference between soil
venting and bioventing is that soil venting typically operates at higher air flow rates to enhance volatilization of
residual volatile hydrocarbons; whereas bioventing systems operate at lower air flow rates to promote biodegradation by maintaining aerobic conditions and moisture
content.
A soil ventinghioventing system consists of three basic
components:
a. Subsurface vapor extraction wells.
b. Blower fadvacuum pump (to draw air through the soil).
c. Vapor management and treatment system.
The vapor extraction wells provide conduits for air movement to and from the soils containing concentrations of
Copyright American Petroleum Institute
Provided by IHS under license with API
No reproduction or networking permitted without license from IHS
chemical(s) of concern above site target levels to the surface
and may consist of slotted casing or well screen. Fan systems include an explosion-proof motor and a spark-resistant
blower. Vacuum pump systems include an explosion-proof
motor and a liquid-ring vacuum pump or regenerative
blower.
Venting systems can be used effectively in a wide variety
of situations. The rates of recovery and applicability to a
given site depend primarily on the properties of the formation and the volatilityhiodegradability of the hydrocarbons.
Venting systems should be monitored regularly to ensure
that the system is operating as designed and to maximize
operational efficiency. Procedures for data collection and
evaluation are outlined below.
2.4.2
DATA COLLECTIONEVALUATION OF SOIL
REMEDIATION SYSTEMS
Venting system O&M monitoring is performed to determine the amount and movements of chemical(s) of concern
in the subsurface before, during, and after remediation. The
overall goals of a monitoring program are (a) to assess site
conditions to detemine remediation approach, (b) to evaluate the progress of in-situ treatment and ensure the system is
operating according to design, and (c) to document site conditions following treatment. A number of options are available for monitoring venting systems, including measuring
the following parameters:
a. Vapor flow rates-Measurements can be made by a variety of flow meters, including pitot tube, orifice plates, and
rotometers.
b. Vacuum readings-Measurements can be made with
manometers and magnehelic gauges. Pressure should be
monitored at each monitor location while ensuring that a
good seal is maintained so as not to alter in-situ vacuum
measurements.
c. Vapor concentrations and composition-Vapor concentrations can be measured by an on-line total hydrocarbon
analyzer calibrated to a specific hydrocarbon or by periodic
measurements with field instrumentation. This information
can be combined with vapor flow rate data to calculate
removal rates (masdtime) and the cumulative amount of
chemical(s) of concern removed. Compositional measurements of hydrocarbon vapors should be made periodically.
Soil-gas measurements should be made periodically at different radial distances using soil-gas probes to monitor the reduction in the vapor concentrationsof the chemical(s) of concern.
1. Temperature of the soil and ambient air: By monitoring soil temperatures, Conner (1988) predicted that biodegradation was occurring in the soils containing
chemical(s) of concern. At locations with large seasonal
differences between air and soil temperatures, extraction
air temperature is also a qualitative measure of air residence time in the soil.
Not for Resale
--`,,-`-`,,`,,`,`,,`---
6
A P I PUBL*lh28E 9 b
OPERATION AND
m
0 7 3 2 2 9 0 0559233 7 T T
MAINTENANCE
CONSIDERATIONS FOR HYDROCARBON
REMEDIATION
SYSTEMS
2. Water-table elevation: For soils with a relatively shallow water table, water-level measurements should be
made to help ensure that the zone of interest remains
unsaturated and that upwelling of groundwater in the
vicinity of the vapor extraction wells is not causing a significant problem.
3. Meteorological data: These measurements include
barometric pressure, precipitation, and similar data.
Data collection requirements for a variety of data interpretatiodanalysis requirements utilizing venting system and
related data are presented in Table 3.
Monitoring and evaluation of venting system performance should be conducted frequently enough to accurately
represent both the variability in the data set and the overall
decline of hydrocarbon removal rates over time. Collection
of O&M data on too frequent a basis can generate unneeded
quantities of data and will add to the operational costs.
Selection of an appropriate monitoring frequency is a compromise between data quantity and project costs, and may
be influenced by site-specific factors. Many venting systems
are monitored either weekly or monthly; it may be appropriate to monitor weekly (or even daily) during the period following system start-up and then monthly after several weeks.
Soil venting-system performance monitoring is a direct
measurement of the rate of hydrocarbon removal by the system. If the system has been properly designed to access all
residual hydrocarbon in the vadose zone, the rate of hydrocarbon removal should determine time estimates for system
shutdown and site closure.
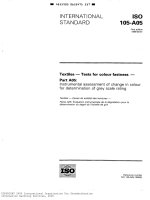
Hydrocarbon mass removal rate graphs are calculated as a
function of the total volatile hydrocarbon concentration of
the system effluent, the molecular weight of the calibration
gas, and the volume of air extracted per unit time. This format allows easy interpretation of the present and past performance of the system, and provides important information
about system efficiency. The relative decline in hydrocarbon mass removal rates, variability of the removal rate data
(which may indicate overriding engineering or hydrologic
controls on system efficiency), and degree of asymptoticity
of the data are easily interpreted from these graphs. An
example of a hydrocarbon mass removal rate graph is shown
on Figure 2.
Site monitoring for carbon dioxide and oxygen levels
using soil vapor probes should be conducted when bioventing systems are operated to evaluate the effects of process
changes on microbiological activity in the subsurface.
These measurements are simple and relatively inexpensive
to conduct and can provide information on the following:
a. Hydrocarbons that have been biodegraded versus volatilized: This information is critical if subsurface conditions,
such as soil moisture, are to be manipulated to improve biodegradation, reduce off-gas treatment costs, and maximize
semivolatile hydrocarbon removal.
b. Site factors limiting biodegradation: If oxygen and carbon dioxide monitoring indicates low oxygen consumption
and carbon dioxide production (and chemical(s) of concern
are still present in the subsurface), further site evaluation
can be conducted to determine what factors are limiting biodegradation.
c. Subsurface air flow characteristics: Measurement of persistently low oxygen or high carbon dioxide in one or more
monitoring wells may indicate an inadequate air supply.
The presence of measurable methane, a by-product of
anaerobic degradation, is also an indicator that oxygen is
limited in the system. In this case, higher extraction rates,
more extraction wells, or cycling of passive and active wells
to eliminate stagnant air flow zones and low oxygen levels
may be needed. The presence of high moisture content or
other immiscible fluids should also be considered as
adversely affecting air flow.
2.5
2.5.1
Groundwater and Air Treatment
Systems
OVERVIEW
Groundwater and air treatment is usually associated with
hydrocarbon remediation projects. The design and successful implementation of these treatment systems with respect
to cost-effective O&M requires the consideration of several
factors including the following:
a. Identification of target compounds to be removed.
b. Background levels of target compounds.
c. Influent concentrations of target compounds.
d. Cleanup objectives.
e. Identification of parameters in the influent stream (typically inorganics) that may inhibit the removal of chemical(s) of concern or cause fouling or corrosion of treatment
system components.
f. Influent flow rates.
g. Power requirements.
During design, O&M requirements should be evaluated to
ensure that the treatment system selected has the following
characteristics:
a. Capability to remove chemical(s) of concern effectively
and efficiently.
b. Reliability.
c. Cost-effectiveness.
d. Compatibility with site conditions.
e. Conformance with regulatory requirements.
Typical treatment systems available for the treatment of
groundwater and/or air at hydrocarbon remediation sites
include oil/water separators, air strippers, bioreactors, carbon systems, and catalytic/thermal oxidation systems.
Routine O&M data collection and evaluation are essential
for ensuring that treatment systems are treating waste
--`,,-`-`,,`,,`,`,,`---
Copyright American Petroleum Institute
Provided by IHS under license with API
No reproduction or networking permitted without license from IHS
7
Not for Resale
A P I PUBL*Lb2BE 9 6
0732290 0559214 636
API PUBUCATION 1628E
8
Table 3-Process
Monitoring Options and Data Interpretation
Data Collection Requirement
Data InterpretatiodAnalysis Requirement
Concentration vs. time
Composition vc. time
Flowrate vs. time
Applied pressudvacuum vs. time
Mass removal rate (mass/time)vs.time cumulative removed by volatilization
(mass) identify mass transfer limitations
1
Aerobic biodegradation contribution to removal rate [mass/time] vs. time
1,2, B
Aerobic biodegradation contribution to cumulative removed (mass)
Total remediation costs ($) vs. time
Cost per mass of hydrocarbon removed ($/kg-removed) vs. time
1.2b. 3
Effect of environmental factors (qualitative)
1. 2b.4
In-situ assessment of treatment with time (qualitativeareal impact)
1,2b, 4O. 5, Sb, 8'. gC
Define zone of vapor containment (qualitativeareal impact)
1.9.7, 1la
Closure monitoring report
1,2b. 3a,4a, 5.7.8.9.10, 11'
Areal impact of air sparging
1.2. 4'. 59 8,7,8', 9, 10, 11'
Effect of water-table elevation changes
1.2,4,5,6,7,9, 10
Injectiodextraction flowrate optimization
1.2,3,4,5,6,7,8.9.10,11
Flow field definition
.Optional, or as required.
bApplicablefor bioventing applications.
qelevant to air sparging.
Note: Data Collection Requirement Key:
1 = Process monitoring data,extractiodinjection flowrate(s) and vacuum(s)/pressure(s),extraction vapor concentration and composition.
2 = Respiratory gas (OZ,C a ) monitoring of extracted vapor stream.
3 = Cost monitoring; capital. operation and maintenance, and utilities costs.
4 = Environmental monitoring; temperature, barometric pressure, precipitation.
5 = In-situ soil gas monitoring: vapor concentration and composition.
6 = In-situ soil gas monitoring; respiratory gases (COZand Oz).
7 =Subsurface pressure distribution monitoring.
8 = Soil samples.
9 = Groundwater monitoring.
10 = Groundwater elevation monitoring.
1I = Tracer gas monitoring.
streams to acceptable levels as cost-effectively as possible.
a. Oillwater separation efficiency.
Data collection criteria are outlined below.
b. Influent concentration (chemical(s) of concern and inorganic parameters that have fouling potential).
c. Effluent concentration.
d. Fiowrates.
e. Line pressures.
f. Percent downtime.
g, Equipment condition.
h. Power usage.
2.5.2
DATA COLLECTIONEVALUATION OF
GROUNDWATER AND AIR TREATMENT
SYSTEMS
Routine data collection requirements for groundwater
treatment systems include the following:
--`,,-`-`,,`,,`,`,,`---
Copyright American Petroleum Institute
Provided by IHS under license with API
No reproduction or networking permitted without license from IHS
Not for Resale
~
A P I PUBL*i,b2õE
ïb
~
0732270 0559235 572
--`,,-`-`,,`,,`,`,,`---
OPERATION
AND MAINTENANCE CONSIDERATIONS
FOR HYDROCARBON
REMEDIATION
SYSTEMS
9
I-
I
N
I
I
I
I
8
o
Copyright American Petroleum Institute
Provided by IHS under license with API
No reproduction or networking permitted without license from IHS
I
I
54
Not for Resale
O
A P I P U B L * < L b 2 8 E 96
O732290 0559216 409
API PUBLICATION
1628E
10
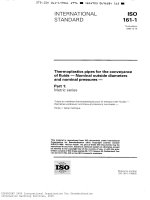
Evaluation of routine data is typically accomplished
graphically. Influent and effluent concentrations for chemical(s) of concern should be tabulated and graphed versus
time. These concentrations are compared with regulatory
limits for the chemical(s) of concern. An example of influenileffluent concentration graphs is shown on Figure 3.
This graphical approach facilitates interpretation of treatment system efficiency and, will usually allow adequate
estimates of time for remediation as trends are developing.
Routine data collection requirements for air treatment
systems include the following:
f. Power usage.
The evaluation of these data is also easily accomplished
graphically. Air influent and effluent readings for each measuring point (Le., treatment system off-gas, extraction system off-gas) are plotted graphically and compared with past
operational data and allowable discharge limits. The flow
rate and effluent concentrations should be used to determine
compliance with specific regulatory emissions requirements.
Typical components of treatment systems that require
routine checks and maintenance are as follows:
a. Influent concentration [typically collected with a photoionization detector (PID), flame ionization detector (FID),
or other field equipment].
b. Effluent concentration.
c. Flow rates (volume for monitoring period).
d. Percent downtime.
e. Equipment condition.
a. Hydraulic: high-low-level switches, pressure sensors,
flow meters, phase separation probes.
b. PhysicaVchemical: pH meters, conductivity probes, turbidity probes, dissolved oxygen probes.
c. Electrical: motorshlowers, circuit breakers, thermal
overloads.
d. Mechanical :automatic valves.
SECTION 3-REHABILITATION/PROBLEM TROUBLESHOOTING
3.1
General
Several factors cause O&M problems for hydrocarbon
remediation systems and lead to the need for rehabilitation
to restore operating efficiency. The more common O&M
problems are associated with the following factors:
--`,,-`-`,,`,,`,`,,`---
a. Poor design (leading to inefficient operation and frequent
maintenance).
b. Inorganic scaling.
c. Iron bacteriahiofouling.
d. Cold weather.
Any of these factors can result in inefficient operation and
costly maintenance of either recovery or treatment systems. This section discusses the problems, troubleshooting,
and solutions to the O&M problems associated with these
factors.
3.2
Poor Design
O&M problems are frequently the result of the decisions,
methods, and systems selected during design. These design
errors can lead to inappropriate or inadequate systems for
site-specific conditions and may require frequent adjustments and maintenance to ensure satisfactory operation.
Numerous examples of this type of problem exist; a few
common problems, troubleshooting methods, and potential
solutions are discussed below.
a. Poor well design: Some well design factors may lead
to premature O&M problems (;.e., improper gravel pack
sizing or screen size). Many times poor well design is
identified through routine monitoring of well efficiency
Copyright American Petroleum Institute
Provided by IHS under license with API
No reproduction or networking permitted without license from IHS
and specific capacity testing. Potential solutions may
include more frequent well- redevelopment and/or well
replacement.
b. Equipment not compatible: It is important to ensure that
equipment used for hydrocarbon recovery and treatment
systems be compatible with the hydrocarbons it will recover
and treat. Equipment not compatible with the specific
hydrocarbon may deteriorate rapidly or operate inefficiently.
This problem might be recognized during efficiency monitoring or routine checks of equipment condition. Equipment replacement will probably be required.
c. Incorrect pump sizing: Incorrect pump sizing can lead to
inefficient flow rates and increased power costs. Testing
pump efficiency and comparing actual operating data with
manufacturer's recommended performance information can
identify this problem. Adjusting operating conditions to
appropriate ranges or equipment replacement may be potential solutions.
d. Inappropriate treatment system: Ìf a treatment system is
being utilized that is not appropriate for site-specific conditions, then increased O&M may be the result. One example
would be a site that uses carbon adsorption where carbon
replacement costs far exceed O&M requirements for other
applicable alternative treatment methods. Although routine
efficiency monitoring and evaluation will likely identify this
problem soon after system start-up, this type of problem
could be avoided by adequate economic and technical consideration during design. Since treatment requirements are
likely to change with time, appropriate measures should be
evaluated during design to ensure cost-effective treatment
throughout the life of the project.
Not for Resale
A P I P U B L * l b 2 8 E 96
OPERATION AND
= 0732290 0559237
~
345
MAINTENANCE
CONSIDERATIONS FOR HYDROCARBON
REMEDIATION
SYSTEMS
11
m
e
7
(u
e
7
I
7
n
a
Q
N
8F
%
ac
z
W
o
z
(u
e
P.
8
irW
Cu
e
LD
3
IL
U
W
(u
?i
N
e
.r
--`,,-`-`,,`,,`,`,,`---
L
m
e
7
(u
$
N
e
Lo
(u
e
7
I
I
I
O
O
5:
O
(u
Copyright American Petroleum Institute
Provided by IHS under license with API
No reproduction or networking permitted without license from IHS
v)
l-
Not for Resale
O
EF
A P I PUBL*Lb28E ỵ b
m 0732290 0559218 281 m
API PUBLICATION
1628E
12
3.3
Inorganic Scaling
Inorganic scaling or fouling of recovery wells, equipment, andor treatment systems can lead to plugging and
reduced efficiency. Scaling occurs when chemical changes
cause certain inorganics to precipitate and build up on
recoverykreatment system surfaces. Primary sources of
inorganic fouling include iron, manganese, and hardness
(particularly, calcium and magnesium).
Under reducing conditions, caused by the depletion of
dissolved oxygen due to the natural degradation of hydrocarbons, inorganics such as iron and manganese will remain
in solution. During pumping andor aboveground treatment,
these inorganics are exposed to oxygen, which can cause
precipitation and scaling problems. Hardness is usually precipitated due to a shift in pH towards alkaline conditions.
The most common reason for this type of pH shift is the
stripping of carbon dioxide due to air stripping or hydraulic
turbulence.
Troubleshooting inorganic scaling requires routine monitoring and evaluation of system efficiencies, equipment condition, and routine water-quality checks for suspect
inorganics. Concentration ranges with corresponding levels
of effort for O&M are presented in Table 4.
Table 4-Operational Consideration for Inorganic
Scaling
Maintenance
Requirements
Iron(Fe).
Magnesium (Mn)
Concentration
0-5 PPm
5-10 ppm
10-20 ppm
>20 ppm
Maintenance:
Diffused Air Strippen
Packed Tower Air Strippers
Hardness
Concenỵration
0-150 ppm
150-300 ppm
>300 ppm
Maintenance as required
Routine maintenance
Constant maintenance
Pretreatmentcan be considered
depending on the flow rate
Changing of filters
Acid washing of packing or
replacement of packing. Required
system shutdown
Maintenance as required
Routinelconstant maintenance
pH control
Maintenance: Required system shutdown and removal of scaling with
muriatic acid.
pH Control: Requires continuous addition of hydrochloric acid (HCl) to
maintain the pH of the influent in 4.0-5.0 range.
Common solutions to inorganic scaling include filter
changes (diffused air strippers), chemical treatment (wells
and treatment systems), well redevelopment,and pH control.
3.4
Iron BacteridBiofouling
Iron bacteria and other biofouling can be one of the most
difficult O&M problems associated with hydrocarbon reme-
diation systems. Natural microorganisms are prevalent in
the subsurface and can also be introduced into the wells during drilling operations. If these microorganisms adapt to
and begin to utilize hydrocarbons as a food source, they can
multiply very rapidly. The collective biomass of these
microorganisms will attach to well materials, pumps, and
treatment components and can cause severe plugging problems. The biomass will also accumulate within the gravel
pack of wells and in the adjacent formation, reducing well
yields. The cumulative results are a loss of well and treatment system efficiency and equipment deterioration.
Biofouling is usually first recognized by the presence of
slime on pumps, probes, and other downhole equipment during routine maintenance. Left unchecked, the problem quickly
escalates to cause severe plugging. If not treated early, biofouling can ultimately lead to well and equipment replacement
There are no easy solutions to O&M problems caused by
biofouling. The best approach is to perform routine maintenance at the first sign of growth on downhole equipment. At
sites where biofouling is suspected, a test probe can be suspended downhole and checked routinely for the presence of
slime. Once the biomass is detected, the well can be treated
with an acceptable biocide. Chlorine solutions or acids
(e.g., hydrochloric acid) can treat this problem; however,
these solutions may have undesirable reactions with the
hydrocarbons present. Nontoxic biocides that may be more
appropriate for this problem are available. After treatment
is applied, the well may require redevelopment. Similar
maintenance can be performed on treatment systems with
this problem. Some form of continuous treatment may be
required to control more serious biofouling problems.
3.5
Cold Weather
Cold weather can present many O&M problems. Primary
impacts due to cold weather include the following:
a. Freezing of groundwater in pipes, sumps, and reactors.
b. Freezing of moisture in air lines.
c. Reduction in treatment system efficiency.
A number of measures can be taken to prevent these cold
weather problems. These measures should consider worstcase ambient conditions:
a. If water will be in place (standing) for a period of time in
which it can freeze, that portion of the system should be
located in a heated enclosure; this is a general rule for prevention of cold-weather problems.
b. The water pipes and air lines should be heat taped and/or
insulated.
c. The water pipes should be slightly sloped to enable the
water to properly drain in case of a system shutdown.
d. In some situations, the treatment unit can be heated with
immersion heaters or heat tape.
--`,,-`-`,,`,,`,`,,`---
Copyright American Petroleum Institute
Provided by IHS under license with API
No reproduction or networking permitted without license from IHS
Not for Resale
~~
A P I P U B L * L b 2 8 E 9 6 M 0732290 0559239 338
OPERATION AND
MAINTENANCE
CONSIDERATIONS FOR HYDROCARBON
REMEDIATION SYSTEMS
SECTION &SYSTEM
O&M COMPARISONS
treatment systems is presented in Tables 5 and 6, respectively.
No one system is appropriate for every site. Several technical and economic factors, including O&M requirements,
need to be evaluated during design to select the most effective system. In addition, site-specific conditions might dictate the use of a more O&M intensive system. O&M
requirements should not be the only design factor evaluated.
--`,,-`-`,,`,,`,`,,`---
The most appropriate time to consider implications of
long-tem O&M costs is during system design. Past expenence with various remediation systems is valuable in
designing a cost-effective system for a given site.
Numerous systems and combinations of systems are
being utilized for hydrocarbon remediation. A comparison
of common O&M requirements for various recovery and
13
Copyright American Petroleum Institute
Provided by IHS under license with API
No reproduction or networking permitted without license from IHS
Not for Resale
0732290 0559220 93T
A P I PUBL*162öE 9b
API PUBUCATION
1628E
14
systems
Skimming Systems
Floating:
large saucer type
small float type
Product Recovery and Control Systems and Equipment (USEPA 1993)
Relative
Capital
costs
Relative
Relative
Potential for
Product
Operating Maintenance
costs
costs
Removal
Disadvantages
No water pumped, skims
very thin layers, moves up
and down with GW
Limited radius of influence.
Clogging of screen,
Generally limited to shallow
(c 25 ft) applications
No water pumped, skims
very thin layers, low cost
Limited radius of influence,
manually adjusted, clogging.
L
L
L
L
M
M
L
L
L
L
L
L
L
L
L
L
L
L
L
L
L
L
M
L-M
L-M
Low cost, low maintenance
surface mounted pumps,
easy to maintain low flows
Pumps water and product,
requires d w separator,
shallow (e20 ft)
Centrifugal pump
L-M
M
M
L-M
Low cost and maintenance
Level sensor and olw separator, required (< 25 ft),
emulsification
Submersiblepump
M
M-H
M
L-M
No depth limitation, ease of
Flow e 1-5 GPM, olw
separator water treatment,
emulsification
Floating inlet:
bailer/passive
pneumatic pump
Absorbent:
absorbent bailer
belt skimmer
Single Pump Systems
Diaphram pump
L-M
Advantages
L-M
L
installation, removes water
and product
Pneumatic
top filling
product only
Duai pump Systems
GWP and PP with separate
levels and product sensors
GWP running steady with
PP and product sensor
GWP running steady with
floating producr skimming
Pump
Direct Removal
Opes excavations or
trcnchcs
Routine skimming or bailing
weh
VacUumEnhanced Pumping
Drop tube lift
in well pump augmentedby
vacuum on well
M
M
M
M
M
M
M-H
M-H
M-H
M-H
M-H
H
M-H
M-H
M
H
M-H
M-H
M
H
-
L
-
L-M
-
L
-
L
M
H
H
H
L
L-H
L-H
L
Can operate over wide range
of low rates, can pump from
deep, low K aquifers
Requires air compressor
system and water treatment
Cone of depression induces
migration of product to well,
high potential product removal rates. pump GW and Product, potential large radius of
influence
High initial cost, high maintenance, recovery well often
becomes clogged and inefficient, works best in clean
sands and gravels, cycling
the GWP on and off with
level sensor not recommended approach
Good initial remedial action
Not practical for removing
product away from excavation area
using vacuum track,absorbent
pads etc.
Inexpensive,works on small
localized product layers
Very limited radius of influence and removal rate
Works well with low to medium Requires high vacuum pump
permeability soils, large radius or blower, usually requires
thermal air treatment system
of influence. increases water
and water treatment
and product flow by 3 to 10
times. Can significantly reduce
site remediation time.
Notes: GW = Groundwater.
GWP = Groundwater F’ump.
PP =productPump.
K = Hydraulic Conductivity.
GPM = Galions Per Minute.
L =Low.
M =Medium.
H =High.
dw =od/water.
Approximate cost rangm based on a unit singie well system including water handling and treatment.
Maintenance Costs: L = e 10% of Capitai Costiyr
Capital costs: L = $3,OOû-10,00
OperatingCosts: L =$500-1,0001mo
M = 10 to 25% of Capital Cost/yr
M = $1O,ooO-25,OOO
M = $1,ûû&3,oOo/mo
H = > 25% of Capital Cost/yr
H =>$3,oOo/m
H = > $B.O00
Copyright American Petroleum Institute
Provided by IHS under license with API
No reproduction or networking permitted without license from IHS
Not for Resale
--`,,-`-`,,`,,`,`,,`---
Table +Free
A P I PUBL*1628E
OPERATION AND
Table 6-Comparison
76
0732270 0559223 876
MAINTENANCE
CONSIDERATIONS FOR HYDROCARBON
REMEDIATION
SYSTEMS
15
of Treatment Alternatives for Removal of Dissolved Petroleum Hydrocarbons in Groundwater
Activated Carbon
Adsorption
Air Stripping
CombinedAir-Stripping and
Carbon Adsorption
Spray irrigation
Biological Treatment
CAPABILITiES
Proven technology for
removing aromatic
compounds
Proven technology for
removing aromatic
compounds
Proven technology for
removing aromatic
compounds
Volatilization,biodegradation,
and adsorption are used to
remove dissolved contaminants
ProvenGhnoloFfor
removing a wide range
of organics
Flexible method that can
be used with a variety
of technologies
Low capital, operating,
and maintenance costs
Cost-effectivebecause carbon
is consumed only for
for removing less volatile
organics
Enhancement of in-situ
biodegradation
Potential problems with air
emissions are minimized
Readily availabletechnology
Simple technology that
is easy to operate
Readily available technology
Treated waters can be polished
Compounds not removable
by other methods (t-butyl,
alcohol, for example) may
be removed
Tolerant of some
fluctuations in
concentrationsand flow
Readily available technology
Carbon costs can be high
Dissolved constituents in Higher capital costs because
two-unit operations are
groundwater, such as
iron, may result in
required
fouling of packing
material
A large area will be required
for treatment
Higher capital, operating, and
maintenance costs
Spent carbon must be regenerated or disposed
Air emissions standards More complicated because
two units must be operated
may require treatmen
of vapors
and maintained
Available land must be suitable
to handle anticipated hydraulic
loading
Greater potential for
malfunctions
Pretreatment for oil and
grease removal where
concentrationsare greater
than 10 ppm is required
Low temperature will
Regulatory constraints
System requires more
monitoring
Intolerant of high suspended solids levels
Sensitiveto fluctuations
in hydraulic loading
~
Potential problems with air
emissions are minimized
LIMITATIONS
result in poor remova
efficiency
Potential air emissions issues
Requires oiUwater separation
--`,,-`-`,,`,,`,`,,`---
Note: ppm = Parts per million
t- = Tertiary
Copyright American Petroleum Institute
Provided by IHS under license with API
No reproduction or networking permitted without license from IHS
Not for Resale
= 0732290
0559222 702
--`,,-`-`,,`,,`,`,,`---
A P I PUBL*Lb28E 96
Copyright American Petroleum Institute
Provided by IHS under license with API
No reproduction or networking permitted without license from IHS
Not for Resale
A P I PUBL*Lb28E 96
m
0732290 0559223 b 4 9
m
--`,,-`-`,,`,,`,`,,`---
Additional copies available from API Publications and Distribution:
(202) 682-8375
Information about API Publications, Programs and Services is
available on the World Wide Web at:
American
Petroleum
Institute
Copyright American Petroleum Institute
Provided by IHS under license with API
No reproduction or networking permitted without license from IHS
1220 L Street, Northwest
Washington, D.C. 20005-4070
202-682-8000
Not for Resale
Order No. A l 628E