Bsi bs en 12673 1999 (2008) bs 6068 2 65 1999
Bạn đang xem bản rút gọn của tài liệu. Xem và tải ngay bản đầy đủ của tài liệu tại đây (288.34 KB, 20 trang )
BRITISH STANDARD
Water quality Ð Gas
chromatographic
determination of some
selected chlorophenols
in water
The European Standard EN 12673:1998 has the status of a
British Standard
ICS 13.060.50
NO COPYING WITHOUT BSI PERMISSION EXCEPT AS PERMITTED BY COPYRIGHT LAW
|
|
|
|
|
|
|
|
|
|
|
|
|
|
|
|
|
|
|
|
|
|
|
|
|
|
|
|
|
|
|
|
|
|
|
|
|
|
|
|
|
|
|
|
|
|
|
|
|
|
|
|
|
|
|
|
|
|
|
|
|
|
|
|
|
|
|
|
|
|
|
|
|
|
|
|
|
|
|
|
|
|
|
|
|
|
|
|
|
|
|
|
|
|
|
|
|
|
|
|
|
|
|
|
|
|
|
|
|
|
|
|
|
|
|
|
|
|
|
|
|
|
|
|
|
|
|
|
|
BS EN
12673:1999
BS 6068-2.65:
1999
Confirmed
July 2008
BS EN 12673:1999
National foreword
This British Standard is the English language version of EN 12673:1998.
The UK participation in its preparation was entrusted by Technical Committee EH/3,
Water quality, to Subcommittee EH/3/2, Physical, chemical and biochemical
methods, which has the responsibility to:
Ð aid enquirers to understand the text;
Ð present to the responsible international/European committee any enquiries
on the interpretation, or proposals for change, and keep the UK interests
informed;
Ð monitor related international and European developments and promulgate
them in the UK.
A list of organizations represented on this subcommittee can be obtained on request
to its secretary.
BS EN 12673 is one of a series of standards on water quality, others of which have
been, or will be, published as Sections of BS 6068. This standard has therefore been
given the secondary identifier BS 6068-2.65. The various Sections of BS 6068 are
comprised within Parts 1 to 7, which, together with Part 0, are listed below.
Part 0 Introduction
Part 1 Glossary
Part 2 Physical, chemical and biochemical methods
Part 3 Radiological methods
Part 4 Microbiological methods
Part 5 Biological methods
Part 6 Sampling
Part 7 Precision and accuracy
NOTE The tests described in this British Standard should only be carried out by suitably qualified
persons with an appropriate level of chemical expertise. Standard chemical procedures should be
followed throughout.
Cross-references
The British Standards which implement international or European publications
referred to in this document may be found in the BSI Standards Catalogue under the
section entitled ªInternational Standards Correspondence Indexº, or by using the
ªFindº facility of the BSI Standards Electronic Catalogue.
A British Standard does not purport to include all the necessary provisions of a
contract. Users of British Standards are responsible for their correct application.
Compliance with a British Standard does not of itself confer immunity
from legal obligations.
Summary of pages
This document comprises a front cover, an inside front cover, the EN title page,
pages 2 to 16, an inside back cover and a back cover.
This British Standard, having
been prepared under the
direction of the Health and
Environment Sector Committee,
was published under the
authority of the Standards
Committee and comes into effect
on 15 June 1999
BSI 06-1999
ISBN 0 580 30998 3
Amendments issued since publication
Amd. No.
Date
Comments
EN 12673
EUROPEAN STANDARD
NORME EUROPÊENNE
EUROPẰISCHE NORM
December 1998
ICS 13.060.01
Descriptors: water tests, water, quality, water pollution, chemical analysis, determination of content, phenols, chromatographic analysis,
gas chromatography, extraction
English version
Water quality Ð Gas chromatographic determination of some
selected chlorophenols in water
Qualite de l'eau РDosage par chromatographie en
phase gazeuse de certains chloropheÂnols dans les
eaux
Wasserbeschaffenheit Ð Gaschromatographische
Bestimmung einiger ausgewaÈhlter Chlorphenole in
Wasser
This European Standard was approved by CEN on 26 November 1998.
CEN members are bound to comply with the CEN/CENELEC Internal Regulations
which stipulate the conditions for giving this European Standard the status of a
national standard without any alteration. Up-to-date lists and bibliographical
references concerning such national standards may be obtained on application to
the Central Secretariat or to any CEN member.
This European Standard exists in three official versions (English, French, German).
A version in any other language made by translation under the responsibility of a
CEN member into its own language and notified to the Central Secretariat has the
same status as the official versions.
CEN members are the national standards bodies of Austria, Belgium, Czech
Republic, Denmark, Finland, France, Germany, Greece, Iceland, Ireland, Italy,
Luxembourg, Netherlands, Norway, Portugal, Spain, Sweden, Switzerland and
United Kingdom.
CEN
European Committee for Standardization
Comite EuropeÂen de Normalisation
EuropaÈisches Komitee fuÈr Normung
Central Secretariat: rue de Stassart 36, B-1050 Brussels
1998 CEN All rights of exploitation in any form and by any means reserved worldwide for CEN national
Members.
Ref. No. EN 12673:1998 E
Page 2
EN 12673:1998
Foreword
This European Standard has been prepared by
Technical Committee CEN/TC 230, Water analysis, the
Secretariat of which is held by DIN.
This European Standard shall be given the status of a
national standard, either by publication of an identical
text or by endorsement, at the latest by June 1999, and
conflicting national standards shall be withdrawn at
the latest by June 1999.
According to the CEN/CENELEC Internal Regulations,
the national standards organizations of the following
countries are bound to implement this European
Standard: Austria, Belgium, Czech Republic, Denmark,
Finland, France, Germany, Greece, Iceland, Ireland,
Italy, Luxembourg, Netherlands, Norway, Portugal,
Spain, Sweden, Switzerland and the United Kingdom.
Annexes designated ªinformativeº are only given for
information. In this standard annexes A to G are
informative.
It is absolutely essential that tests conducted according
to this standard are carried out by suitably qualified
staff.
BSI 06-1999
Page 3
EN 12673:1998
1 Scope
4 Principle
This European Standard describes the gas
chromatographic determination of 19 chlorophenols
(2-, 3-, and 4-chlorophenol, 2,3-, 2,4-, 2,5-, 2,6-, 3,4- and
3,5-dichlorophenol, 2,3,4-, 2,3,5-, 2,3,6-, 2,4,5-, 2,4,6 and
3,4,5-trichlorophenol, 2,3,4,5-, 2,3,4,6-, and
2,3,5,6-tetrachlorophenol and pentachlorophenol) in
drinking water, groundwater, rainwater, waste water,
sea water and surface water.
This standard describes an acetylation followed by a
liquid/liquid extraction and determination by gas
chromatography and electron capture detection or
mass selective detection. The method is validated for
drinking water, surface water and waste water, but
may be used for all above mentioned types of water.
With this method chlorophenols can be determined
over a range of concentrations from 0,1 mg/l to 1 mg/l,
depending on the quantity of sample used and the
component sensitivity (level of chlorination)
(see annex A).
In some cases complete separation of isomers cannot
be achieved. Then the sum is reported.
This method may be applicable to other halogenated
phenolic compounds, provided the method is validated
for each case.
Chlorophenols present in the aqueous samples are
derivatized with acetic anhydride to their
corresponding acetates. The derivatives formed are
extracted from the sample with hexane. The hexane
fraction is analysed by gas chromatography with
electron capture detection or mass selective detection.
Depending on the sample type pretreatment involves
acid-base partition prior to the derivatization step.
2 Normative references
This European Standard incorporates by dated or
undated reference, provisions from other publications.
These normative references are cited at the
appropriate places in the text and the publications are
listed hereafter. For dated references subsequent
amendments to or revisions of any of these
publications apply to this European Standard only
when incorporated in it by amendment or revision. For
undated references the latest edition of the publication
referred to applies.
ISO 5667-5:1991, Water quality Ð Sampling Ð Part 5:
Guidance on sampling of drinking water and water
used for food and beverage processing.
ISO 5667-6:1990, Water quality Ð Sampling Ð Part 6:
Guidance on sampling of rivers and streams.
ISO 5667-8:1993, Water quality Ð Sampling Ð Part 8:
Guidance on sampling of wet deposition.
ISO 5667-9:1992, Water quality Ð Sampling Ð Part 9:
Guidance on sampling from marine waters.
ISO 5667-10:1992, Water quality Ð Sampling Ð
Part 10: Guidance on sampling from waste waters.
ISO 5667-11:1993, Water quality Ð Sampling Ð
Part 11: Guidance on sampling from ground waters.
3 Definitions
For the purpose of this European Standard the
following definition applies.
3.1
chlorophenol
compound having an aromatic nucleus carrying one
hydroxyl group and from one to five chlorine atoms
BSI 06-1999
5 Interferences
Surfactants, emulsifiers, higher concentrations of polar
solvents and other phenolic substances can affect the
extractive derivatization step.
Suspended particles in the water can also interfere and
reduce the recovery. A second liquid phase in the
water (e.g. mineral oil compounds, highly volatile
halogenated hydrocarbons, emulsified fats and waxes)
disturbs sampling, sample preparation and the
enrichment. In those cases the examination is
restricted to the aqueous phase and the portion of the
non-aqueous phase is reported separately.
6 Reagents
WARNING The use of this European Standard may
involve hazardous materials, operations and equipment.
This standard does not purport to address all the
safety problems associated with its use. It is the
responsibility of the user of this standard to establish
appropriate safety and health practices and determine
the applicability of regulatory limitations prior to use.
6.1 General requirements
All reagents shall be of such a purity that they do not
give rise to significant interfering peaks in the gas
chromatographic analysis of the extracts. This shall be
verified for each batch of material by running
procedural blanks with each batch of samples
analyzed. Reagents shall be stored in all glass
containers with glass stoppers or with
polytetrafluoroethylene (PTFE) lined caps.
6.2 Gas chromatographic gases, including helium,
argon/methane, nitrogen or hydrogen. They shall be of
a purity as recommended by the gas chromatograph
manufacturer.
6.3 Ethanol, C2H5OH.
6.4 n-Hexane, C6H14.
6.5 Potassium carbonate solution,
c(K2CO3) = 1,0 mol/l.
6.6 Potassium carbonate solution,
c(K2CO3) = 0,1 mol/l.
6.7 Acetic anhydride, C4H6O3.
NOTE Impurities in the acetic anhydride may affect the recovery.
In that case it is possible to purify acetic anhydride by distillation.
Page 4
EN 12673:1998
6.8 Toluene, C7H8.
6.9 Phosphoric acid, c(H3PO4) = 0,5 mol/l.
6.10 Sodium sulfate, Na2SO4, anhydrous, neutral.
NOTE Some batches of sodium sulfate have been found to be
alkaline. In these circumstances it is possible to wash with
methanol containing 0,5 ml concentrated hydrochloric acid per
litre and to dry on a steam bath before roasting in a muffle
furnace (7.6) at 500 8C ± 20 8C for 4 h ± 0,5 h.
6.11 Sodium hydroxide, c(NaOH) = 0,1 mol/l.
6.12 Sodium thiosulfate pentahydrate,
(Na2S2O3´5H2O), crystals or a 10 % (m/m) solution.
6.13 2-chlorophenol, C6H5OCl.
6.14 3-chlorophenol, C6H5OCl.
6.15 4-chlorophenol, C6H5OCl.
6.16 2,3-dichlorophenol, C6H4OCl2.
6.17 2,4-dichlorophenol, C6H4OCl2.
6.18 2,5-dichlorophenol, C6H4OCl2.
6.19 2,6-dichlorophenol, C6H4OCl2.
6.20 3,4-dichlorophenol, C6H4OCl2.
6.21 3,5-dichlorophenol, C6H4OCl2.
6.22 2,3,4-trichlorophenol, C6H3OCl3.
6.23 2,3,5-trichlorophenol, C6H3OCl3.
6.24 2,3,6-trichlorophenol, C6H3OCl3.
6.25 2,4,5-trichlorophenol, C6H3OCl3.
Prepare a mixed standard of two component solutions
in such a concentration that if a small volume is added
to a sample, the amount of the internal standards gives
peak heights on the chromatogram in the upper part of
the linear working range.
Typically a concentration of 10 mg/ml can be used.
Confirm their concentration prior to use.
6.32.2 Stock solutions
Prepare stock solutions of the chlorophenols by
weighing each compound (6.13 to 6.31) and dissolving
it in ethanol (6.3). Typical concentrations of the stock
solutions are given in annex B. Alternatively,
commercially available standard solutions can be used.
Confirm the concentrations.
NOTE 1 Confirmation may be accomplished by spectrometric
methods (e.g. UV spectrometry) or comparison with a standard of
known concentration or from another source.
NOTE 2 Stock solutions are stable for at least half a year when
stored in the dark at 4 8C. At a temperature of 218 8C they are
stable for at least one year.
6.32.3 Intermediate standards
Prepare this mixed standard solution by dilution of the
stock solutions (6.32.2). Suitable concentrations are
given in annex B. The intermediate standards should
be prepared freshly every month.
6.32.4 Working standards
Prepare a minimum of five different concentrations by
suitable dilutions of the intermediate solution (6.32.3)
with ethanol (6.3). Suitable concentrations are given in
annex B. The working standards may be used
for 5 days.
6.26 2,4,6-trichlorophenol, C6H3OCl3.
7 Apparatus
6.27 3,4,5-trichlorophenol, C6H3OCl3.
7.1 General requirements
Standard laboratory glassware cleaned to eliminate all
interferences.
6.28 2,3,4,5-tetrachlorophenol, C6H2OCl4.
6.29 2,3,4,6-tetrachlorophenol, C6H2OCl4.
6.30 2,3,5,6-tetrachlorophenol, C6H2OCl4.
6.31 Pentachlorophenol, C6Cl5OH.
6.32 Standard solutions of chlorophenols
6.32.1 Internal standard solutions
Prepare solutions of at least two internal standards in
ethanol (see 6.3).
For electron capture detection the following internal
standard can be used:
Ð 2,4-dibromophenol, C6H4OBr2;
Ð 2,6-dibromophenol, C6H4OBr2;
Ð 2,3,6-trichlorophenol (see 6.24), C6H3OCl3;
Ð 2,4,6-tribromophenol, C6H3OBr3.
For mass selective detection similar labelled
compounds can be used.
NOTE The two internal standards are used as a control for the
analytical procedure. The choice of the two internal standards
should reflect the anticipated occurrence of the chlorophenols in
the sample (e.g. if dichlorophenols are expected 2,4-dibromophenol
and 2,6-dibromophenol should be used).
NOTE Heating to a temperature above 150 8C before use assists
in freeing glassware from possible contaminations. This procedure
should not be used for volumetric bottles. Also an alkaline
washing procedure can be used.
7.2 Sample bottles, all glass, with glass stoppers or
with PTFE lined caps. A random bottle per batch shall
be checked for interfering contamination by running a
blank determination prior to use (see 9.5).
7.3 Flasks with ground stopper, glass, 100 ml.
7.4 Capillary gas chromatograph, equipped with an
injector system which minimizes decomposition of the
sample (e.g. on-column or glass-lined injector), an
electron capture detector or mass selective detector
and a recorder system (integrator, computer etc.).
7.5 Capillary columns, fused silica; for electron
capture detection at least two with stationary phases
of different polarity; for mass spectrometric detection
one column suffices.
Typical: length 30 m, internal diameter < 0,4 mm, coated
with chemically bonded methyl silicones or phenyl
(5 %) methyl silicones (apolar) or
cyanopropylene (14 %) methylsilicones (polar) and with
a film thickness of 0,25 mm or equivalent.
BSI 06-1999
Page 5
EN 12673:1998
7.6 Muffle furnace, set to 500 8C ± 20 8C.
7.7 Apparatus for liquid/liquid (L/L) extraction
7.7.1 Separating funnels, 500 ml and 250 ml with
grease free glass or PTFE taps.
7.7.2 Shaking machine.
8 Sampling
For sampling the following ISO methods are applicable:
drinking water
surface water
rainwater
sea water
waste water
groundwater
ISO 5667-5;
ISO 5667-6;
ISO 5667-8;
ISO 5667-9;
ISO 5667-10;
ISO 5667-11.
The bottles shall be filled to the brim with the water
sample and stoppered.
On sample collection, take care that no interfering
substances enter the water sample, and no losses of
the determinands occur. This is especially important in
the use of any plastic tubing used within the sampling
apparatus. If necessary, it shall be proved by control
tests that no losses by adsorption occur. Glass and
stainless steel devices are preferable.
Some chlorophenols may degrade in an aqueous
environment. Therefore, unless experimental stability
trials indicate otherwise, extract samples within two
days of sampling. If extraction is extended beyond two
days this shall be noted in the test report.
If the interval between sampling and extraction
exceeds one day, keep the samples at 4 8C in the dark.
If free halogens are suspected, add, at the time of
sampling, some crystals of Na2S2O3´5H2O or 0,1 ml of
a 10 % (m/m) Na2S2O3 solution (6.12) per 125 ml of
sample.
Otherwise, do not add any preservation agent.
9 Procedure
9.1 Sample pretreatment
In this section two procedures are given:
Ð a method including acid-base partition which may
be applied for dirty samples or when enrichment of
the sample is required (9.1.1);
Ð a procedure employing direct acetylation suitable
for relatively clean samples (9.1.2).
It is permissible for sample volumes to be increased if
required. The volumes of all other reagents (except the
internal standard) shall be adjusted accordingly.
Moreover, as the calibration is based on the total
procedure, the volumes used for the preparation of
calibration solutions shall also be adjusted accordingly.
Apply one of the following procedures.
BSI 06-1999
9.1.1 Clean up/enrichment procedure
Adjust the pH of the sample to pH = 4 by the addition
of phosphoric acid (6.9). Pour 200 ml of the sample
into a 500 ml separating funnel (7.7.1). Add 200 ml of
internal standard (6.32.1). Extract successively with
40 ml, 40 ml and 20 ml of toluene (6.8). Shake for
10 minutes each time using the shaking
machine (7.7.2).
NOTE If an emulsion forms during the extraction process, the
emulsion can be broken by e.g. violent shaking, deep freezing,
ultrasonification or separating out by means of the addition of
salts.
Shake the collected toluene extract with a 3 3 20 ml
0,1 mol/l potassium carbonate solution (6.6), for
3 minutes each time, in a 250 ml separating funnel.
Collect the water layers and proceed with 9.2.2.
9.1.2 Pretreatment if no clean up/enrichment
procedure is followed
Take a sample of 50 ml or an aliquot diluted with
distilled water to a volume of 50 ml. Neutralize acidic
samples with sodium hydroxide (6.11) to a pH value of
about 7 and alkaline samples with phosphoric
acid (6.9) to a pH of about 10.
Add 200 ml of internal standard (6.32.1).
9.2 Acetylation procedure
9.2.1 Acetylation of the working standards
Treat each of the working standards (6.32.4) as
follows.
Transfer with a pipette into a 100 ml open flask (7.3):
Ð 50 ml of distilled water;
Ð 2,00 ml of the working standard (6.32.4);
Ð 200 ml of the internal standard (6.32.1).
The following steps shall be carried out in the exact
times given and without interruption.
Add 5 ml of the 1 mol/l potassium carbonate
solution (6.5) and subsequently 1 ml of the acetic
anhydride (6.7) and stir vigorously for 5 min to allow
the release of carbon dioxide.
NOTE 1 This procedure can also be carried out using a
separating funnel or a microseparator (see annex C).
Allow to stand for 10 min and then add 5,0 ml of
n-hexane (6.4). Close the flask with the stopper and
stir for 5 min. Allow the two phases to separate.
Transfer as large a portion as possible of the hexane
phase to a vial. Dry the hexane phase with anhydrous
sodium sulfate (6.10) or by freezing. Store at 4 8C.
These acetylated solutions are the calibration solutions.
Calculate the content of each substance (mg/ml) in
each of the calibration solutions.
NOTE 2 The efficiency of the derivatization step may be checked
with a selection of chlorophenolacetates. Generally these
compounds are not suitable for calibration purposes because
sufficiently pure chlorophenolacetates are not always available.
Page 6
EN 12673:1998
9.2.2 Acetylation of the sample
Transfer the collected aqueous phases or an aliquot
of 9.1.1 or the (neutralized) sample of 9.1.2 into
a 100 ml open flask (7.3) and add 5 ml of the 1 mol/l
potassium carbonate solution (6.5).
Carry out the following steps in the exact times given
and without interruption.
Determine the calibration function by regression
analysis using the ratios yie/yse and rie/rse. Establish
the linear regression function using the pairs of ratios
yie/yse and rie/ rse of the measured series in the
following equation.
yie
r
= mi ie + bi
(1)
yse
rse
NOTE 1 This procedure can also be carried out using a
separating funnel or a microseparator (see annex C).
Where:
Add 1 ml of acetic anhydride (6.7). Stir vigorously
for 5 min to allow the release of carbon dioxide. Allow
to stand at room temperature for 10 min and add 5,0 ml
of n-hexane (6.4). Close the flask with the stopper and
stir for 5 min. Allow the phases to separate. Remove
the water layer and dry the hexane phase with
anhydrous sodium sulfate (6.10) or by freezing.
NOTE 2 If an emulsion forms during the extraction process, the
emulsion can be broken by e.g. violent shaking, deep freezing,
ultrasonification or separating out by means of the addition of
salts. In case of emulsification recoveries should be checked.
yie
yse
rie
rse
9.3 Calibration
9.3.1 Gas chromatograph calibration
Set up the gas chromatographic instrument, equipped
with the columns (7.5), according to the
manufacturer's instructions. Optimize gas flows. Ensure
it is in a stable condition. Guidance on the initial gas
chromatographic conditions is given in annex D.
Calibrate by direct injection of the acetylated working
standards (9.2.1) and in addition run a blank. Measure
the gas chromatographic signals for each substance
against concentration. This gives information on
retention times and relative responses of the
determinands and the linear working range of the gas
chromatograph and detector.
NOTE 1 Chromatograms of standards should be checked for
retention time and peak resolution changes, and losses caused by
decomposition within the injection liner.
NOTE 2 Separation can be considered as satisfactory if the
height measured from the base line of the trough between the two
adjacent peaks is no more than 20 % of the height of the highest
peak; the peaks in this instance need to be of comparable height.
Separation between 2,3,4,5-tetrachlorophenol acetate
and 2,3,4,6-tetrachlorophenol acetate can be critical. The
resolution should at least be 0,5. Generally the acetates of 2,4and 2,5-dichlorophenol are not separated.
9.3.2 Calibration of the procedure
For explanation of the subscripts used see Table 1.
Table 1 Ð Explanation of the subscripts
Subscript
Meaning
i
Identity of the substance
e
Calibration
s
Internal standard
mi
bi
is the measured value of the determinand i
as e.g. peak height or peak area;
is the measured value of the internal
standard s as e.g. peak height or peak area;
is the mass concentration of the
determinand i in the calibration solution in
micrograms per litre;
is the mass concentration of the internal
standard s in the calibration solution in
micrograms per litre;
is the slope of the calibration function, also
called the response factor;
is the intercept of the calibration function
with the ordinate as e.g. peak height or peak
area.
9.4 Measurement
Prepare gas chromatograms of the extracts obtained
in 9.2.2 by injecting a defined volume, typically 1 ml
to 5 ml (but the same volume as in 9.3.1), into the gas
chromatograph. This procedure shall be performed by
analysing the samples on the two capillary columns of
a differing polarity (7.5).
The following measurement conditions shall be
observed in the detection of substances using a mass
spectrometer.
Ionization procedure: electron ionization, electron
energy at least 45 eV.
Mass range during registration of the spectra:
46 to 280 absolute mass units (u), at least 10 u above
the highest molecular mass of the substances in
question.
If there is interference e.g. due to CO2, the spectra
registration can be begun at 46 u.
Cycle time: < 2 sec ± at least 5 spectra should be
registered for each substance peak.
If, with increased sensitivity only selected ions are
detected register the base peak with 2 additional ions
(as they appear in the spectra) with the same cycle
time as above.
BSI 06-1999
Page 7
EN 12673:1998
9.5 Quality control experiment
For the quality control of the analytical procedure take
the following steps.
Determine the substance specific blanks by running the
background gas chromatograms of the respective total
method as applied to a sample of interference free
water (i.e. pretreatment, extraction, purification, gas
chromatography).
If blank values are unusually high (more than 10 % of
the lowest measured values) every step in the
procedure shall be checked in order to find the reason
for these high blanks.
If samples concentrations are close to the limit of
determination, however, blank values higher than 10 %
of the lowest measured value have to be tolerated.
When the blank value significantly differs from the
intercept of the calibration curve the cause shall be
determined.
The minimum validity of the calibration shall be
checked with every batch of samples. Inject two
standard extracts, one at approx. 20 % and the other at
approx. 80 % of the selected linear working range.
Repeat the injections once.
Compare the means of the two concentrations with the
calibration curve. If the values are within the
confidence interval of the corresponding values used in
the procedure, it is permissible to use them as a
calibration curve. If not, check the entire procedure
and establish a complete new calibration curve.
10 Expression of results
10.1 Interpretation and quantification
10.1.1 GC-ECD
The following steps shall be done for each column
separately.
By means of the absolute retention times, identify the
peaks of the internal standards. For the remaining
relevant peaks of the gas chromatograms, determine
the relative retention time as compared with both
internal standards. Consider that a compound has been
shown if the relative retention time differs by less
than 0,2 % from the relative retention time obtained as
in 9.3.1.
The chlorophenols are quantified by using an internal
standard added to the sample. Errors can occur when
an interfering compound co-elutes with the internal
standard in the chromatogram of the extract. For this
reason at least two internal standards are used to
determine whether interfering compounds are present
or absent.
This presence or absence of interfering compounds
can be determined from the measured responses of the
internal standards. When no interfering compounds are
present in the extract, the ratio between the responses
of the internal standard is equal to that of the ratio in
the working standard. The quotient of these ratios is
called the relative response ratio, RRR.
BSI 06-1999
When no interfering compounds are present in the
extract the value of RRR is in principle 1,00. In this
standard it is assumed that no interfering compounds
are present in the extract when RRR = 1,00 ± 0,10.
When the value of RRR deviates from 1,00 ± 0,10 the
response of one of the internal standards is influenced
by an interfering compound present in the extract. In
that case the chlorophenols are quantified by using the
undisturbed internal standard.
10.1.2 GC-MS
Identify the peaks by means of retention times as
described in 10.1.1. Information on characteristic ions
is given in annex F.
When the full scan mode is used correct the spectra by
background substraction. Identify the compounds by
matching the spectra from the sample with the spectra
of the reference substances taking into account the
limits given in the following clauses. Produce all
spectra under the same instrumental conditions. The
individual reference spectra shall be created by each
individual laboratory on the same GC-MS system used
for the samples. The reference spectra may be stored
in a spectra library or derived from the corresponding
calibration.
In the case of acquiring selected ions (SIM mode), at
least three characteristic ions shall be used.
(See annex F.) The signal-to-noise ratio of the least
intensive ion should be at least 3 (S/N > 3). The ratio of
the three masses in a spectra shall be evaluated from
the mass peak height scanned at the peak maximum
applying identical measurement conditions with sample
and reference substance. The ratio of abundance of the
two less intensive ions to the base peak shall not
deviate by more than 10 % between these acquisitions.
Structural isomers producing similar mass spectra can
only be identified clearly if their GC retention times
are sufficiently different. Acceptable resolution is
achieved if the height of the valley between two peaks
is less than 25 % of the average height of the two
peaks. Otherwise, structural isomers are identified as
isomeric pairs.
In general, all ions present above 10 % relative
abundance in the mass spectra of the standard should
be present in the mass spectra of the sample
component. The abundance between different ions
(intensity ratio) shall agree within 20 % (absolute)
between the sample and reference spectra. At least
three most important ions (see annex F) should be
used for this test.
Page 8
EN 12673:1998
10.1.3 Calculation
Calculate the mass concentration of the substance
using equation (2) [following the solution of
equation (1)].
yi
2 bi
ys
3 rs
ri =
(2)
f 3 mi
ys
rs
ri
mi
bi
f
Table 2 Ð Rounding of results
concentration (mg/l)
greater than
0,01
0,1
1
Where:
yi
Round off the results as in Table 2.
is the measured value of the determinand i as
e.g. peak height or peak area;
is the measured value of the internal
standard in the sample as e.g. peak height or
peak area;
is the mass concentration of the internal
standard in the sample e.g. in micrograms per
litre;
is the mass concentration of substance i,
e.g. in micrograms per litre;
is the slope of the calibration function;
is the intercept of the calibration function
with the ordinate as e.g. peak height or peak
area;
concentration factor; 4 for the procedure with
clean-up/enrichment (9.1.1); 1 for direct
procedure (9.1.2).
Using mass spectrometry take for yi or ys respectively
the peak height or peak area of the most intensive
(fragment-) mass (base peak) from the corresponding
substance's spectrum.
10.2 Results
When using electron capture detection employing two
gas chromatographic methods the application of the
calculation method (10.1) provides one individual
result for each column used. Derive the final
quantitative result from these results as follows:
Ð take the arithmetic mean, provided that the
differences between the individual results are less
than 10 % of the lowest result;
Ð choose the smallest value in the event of larger
differences. The larger values can be the result of
peak overlap. Such results shall be labelled as
measured values obtained from a single separation
only.
For both the MS result obtained from a single column
and the final quantitative ECD result report the mass
concentrations of the substances to not more than two
significant figures.
concentration (mg/l)
up to and including
0,1
1
10
round up
to (mg/l)
0,001
0,01
0,1
10.3 Precision
In November 1996 an interlaboratory trial was carried
out in which 24 laboratories from 8 different countries
took part. The comparison was conducted on three
types of water; drinking water, surface water and
waste water.
In Tables 3, 4 and 5 information on the reproducibility
and repeatability on the three water types is given.
Information on the lowest detected concentration is
given in annex A.
11 Test report
The following information shall be included in the
report:
a) a reference to the present European Standard;
b) the data required for identification of the sample
examined;
c) the interval between sampling and extraction;
d) if stabilization by sodium thiosulfate is applied;
e) the types of columns and gas chromatography
conditions employed;
f) the concentration of each of the chlorophenols, in
micrograms per litre;
g) any special circumstances observed during the
determination, such as for instance other peaks
observed in the chromatogram;
h) all operations (e.g. the settling or filtration of the
sample) not prescribed in the standard which might
have affected the result;
i) detection with ECD or MS;
For detection with MS:
Identification through the registration of complete
mass-spectra (SCAN mode) or individual registration
of selected masses (SIM mode); number of registered
or examined ion masses (given in annex F); possible
occurrence of divergence of the experimental
expected isotope/fragment ion-ratio; quantification
mass.
BSI 06-1999
Page 9
EN 12673:1998
Table 3 Ð Performance data for drinking water (high and low concentration)
Sample type
Phenol
Drinking water
Low
Drinking water
High
n
p
o
x
p
Sr %
Sr mg/l
SL %
SL mg/l
SR %
SR mg/l
is
is
is
is
is
is
is
is
is
is
is
BSI 06-1999
the
the
the
the
the
the
the
the
the
the
the
2342, 32, 42, 52, 63, 43, 52, 3, 42, 3, 52, 3, 62, 4, 52, 4, 63, 4, 52, 3, 4, 52, 3, 4, 62, 3, 5, 6pentachloro
2342, 32, 42, 52, 63, 43, 52, 3, 42, 3, 52, 3, 62, 4, 52, 4, 63, 4, 52, 3, 4, 52, 3, 4, 62, 3, 5, 6pentachloro
n
p
51
15
34
11
55
16
50
o
x
p
%
mg/l
mg/l
Sr
SL
%
SR
%
mg/l
mg/l
%
mg/l
14,89 16,50 15
2,185
33 4,866
36 5,295
5,77
3,18 41
2,354
121 7,009
128 7,398
5,9
1,60
1,60 14
0,231
47 0,747
49 0,782
14
6,7
1,30
1,14 20
0,257
43 0,564
48 0,624
46
54
12
15
7,7
0,80
1,24
0,89 19
1,28 21
0,154
0,264
21 0,169
45 0,556
27 0,22
50 0,62
27
43
37
8
13
11
11,1
13,3
0,15
0,21
0,23
0,15 15
0,18 12
0,20 20
0,022
0,026
0,047
49 0,074
36 0,077
23 0,054
57 0,086
41 0,088
31 0,072
25
44
55
7
12
16
22,2
0,08 0,10 9
0,11 0,13 20
22,76 27,50 22
0,008
0,022
5,045
45 0,037
24 0,028
33 7,584
47 0,039
45 0,051
41 9,229
33
10
16,7
10,10 10,61
8
0,788
38 3,888
40 4,034
56
16
5,9
3,27
3,21
8
0,27
44 1,453
45 1,478
55
54
16
16
15
5
16,7
5,41
5,11
0,08
6,50 10
6,24 18
0,08 9
0,516
0,913
0,008
32 1,722
34 1,744
39 0,032
36 1,974
38 1,966
40 0,033
49
47
58
14
14
17
6,7
6,7
4,68
1,63
0,87
5,11 5
1,94 10
0,90 17
0,229
0,158
0,145
21 0,996
27 0,432
26 0,229
22 1,048
29 0,467
32 0,277
47
46
58
14
14
16
17,6
0,90
2,47
0,98
0,93
2,91
1,26
0,059
0,198
0,082
44 0,395
30 0,747
28 0,272
45 0,406
33 0,818
35 0,345
5,9
number of values
number of data sets, i.e. number of laboratories
percentage of outliers
general mean, without outliers
indicator value
relative repeatability standard deviation
repeatability standard deviation
relative between-laboratory standard deviation
between-laboratory standard deviation
relative reproducibility standard deviation
reproducibility standard deviation
7
8
8
Page 10
EN 12673:1998
Table 4 Ð Performance data for surface water (high and low concentration)
Sample type
Surface water
High
Surface water
Low
Phenol
2342, 32, 42, 52, 63, 43, 52, 3, 42, 3, 52, 3, 62, 4, 52, 4, 63, 4, 52, 3, 4, 52, 3, 4, 62, 3, 5, 6pentachloro
2342, 32, 42, 52, 63, 43, 52, 3, 42, 3, 52, 3, 62, 4, 52, 4, 63, 4, 52, 3, 4, 52, 3, 4, 62, 3, 5, 6pentachloro
n
p
50
48
14
14
56
58
16
16
50
o
x
p
%
mg/l
mg/l
12,5
12,5
Sr
%
91,31 110,02 12
78,82 97,64 8
SL
mg/l
SR
%
mg/l
%
mg/l
10,67
6,065
29
28
26,13
21,82
30
29
27,13
22,73
5,9
21,51
11,06
28,06 9
10,69 13
1,969
1,468
33
43
7,18
4,763
14
12,5
44,57
57,17
8
3,362
36
50
14
6,7
8,04
8,90
7
0,544
21
1,689
24
1,914
15
52
56
7
15
16
12,5
6,3
5,9
0,10
14,99
8,83
0,09
19,45
9,04
1
7
5
9E-04
1,027
0,437
74
34
26
0,074
5,083
2,29
74
35
27
0,074
5,181
2,364
51
44
60
15
13
17
11,8
7,1
2,81
8,29
5,44
2,78 15
9,71 5
6,31 9
0,416
0,419
0,468
39
27
29
1,092
2,25
1,586
42
28
31
1,168
2,338
1,7
50
14
12,5
25,16
33,01 11
2,712
32
7,939
33
8,401
32
10
9,1
4,40
6,37 13
0,561
40
1,744
42
1,852
56
16
5,9
3,29
3,21
7
0,239
45
1,494
46
1,522
58
16
2,10
2,29 13
0,269
36
0,765
44
0,917
48
53
13
15
13,3
1,51
2,29
1,78 10
2,55 14
0,156
0,313
21
45
0,318
1,021
25
47
0,379
1,069
27
57
44
9
16
12
10,0
14,3
0,32
0,39
0,40
0,29 8
0,36 12
0,40 12
0,027
0,047
0,049
65
25
14
0,207
0,099
0,055
65
29
24
0,209
0,113
0,096
32
46
9
13
10,0
7,1
0,25
0,20
0,19 9
0,25 17
0,023
0,034
63
21
0,16
0,042
89
37
0,226
0,073
16,06
34
45
37
7,392
4,941
16,59
For the explanation of symbols see Table 3.
BSI 06-1999
Page 11
EN 12673:1998
Table 5 Ð Performance data for waste water (high and low concentration)
Sample type
Waste water
High
Waste water
Low
Phenol
2342, 32, 42, 52, 63, 43, 52, 3, 42, 3, 52, 3, 62, 4, 52, 4, 63, 4, 52, 3, 4, 52, 3, 4, 62, 3, 5, 6pentachloro
2342, 32, 42, 52, 63, 43, 52, 3, 42, 3, 52, 3, 62, 4, 52, 4, 63, 4, 52, 3, 4, 52, 3, 4, 62, 3, 5, 6pentachloro
n
o
x
p
%
mg/l
mg/l
48
52
13
15
56
50
16
14
52
14
50
14
6,7
7,77
8,90
14
46
56
5
13
16
16,7
13,3
0,09
14,15
9,19
0,09
19,45
9,04
47
41
50
14
12
14
12,5
7,7
12,5
46
13
19
Sr
SL
SR
%
mg/l
%
mg/l
%
mg/l
5
5
4,568
3,437
34
32
29,84
19,89
35
33
30,75
20,81
13,3
6,3
87,58 110,02
62,62 97,64
12,5
21,78
11,01
28,06 10
10,69 9
2,194
0,944
35
49
45,48
57,17 11
5,087
40
9
0,674
20
1,553
22
1,706
2
5
8
0,001
0,65
0,776
54
41
31
0,047
5,746
2,825
54
41
32
0,047
5,852
2,947
2,69
8,18
4,98
2,78 36
9,71 6
6,31 9
0,97
0,504
0,465
42
35
24
1,121
2,893
1,172
56
36
26
1,492
2,936
1,307
7,1
18,47
27,50 10
1,789
30
5,549
36
6,604
7
12,5
6,06
10,61
4
0,24
81
4,931
82
4,943
52
15
6,3
3,19
3,21 12
0,37
53
1,685
54
1,723
54
50
23
15
14
7
6,7
22,2
4,37
4,61
0,11
6,50 17
6,24 14
0,08 6
0,725
0,65
0,007
35
33
47
1,531
1,537
0,05
39
37
48
1,709
1,713
0,051
50
52
56
14
15
16
6,7
4,48
1,60
0,95
5,11 7
1,94 13
0,90 20
0,297
0,212
0,191
29
35
37
1,32
0,564
0,35
30
38
40
1,353
0,606
0,383
47
46
54
14
13
15
17,6
11,8
0,83
2,43
0,92
0,93 12
2,91 25
1,26 19
0,097
0,599
0,171
34
28
15
0,282
0,68
0,14
36
38
34
0,3
0,918
0,311
For the explanation of symbols see Table 3.
BSI 06-1999
p
5,9
7,723
5,423
18,37
37
50
43
8,018
5,525
19,44
Page 12
EN 12673:1998
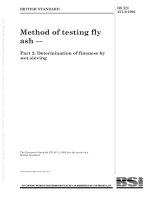
Annex A (informative)
Figure A.1 Ð Indication of the lowest detected concentration
Lowest concentrations detected in real samples by the participants in the interlaboratory trial. These data are
only given as guidance. The actual LOD achievable will have to be established in each particular laboratory.
Annex B (informative)
Table B.1 Ð Typical concentrations of the standard solutions
Stock solution
(6.32.2)
Intermediate
standards
(6.32.3)
30 mg/ml
Working standards
(6.32.4)
monochlorophenol
1 mg/ml
0,03 mg/ml to 1 mg/ml
dichlorophenols
400 mg/ml
4 mg/ml
0,004 mg/ml to 0,5 mg/ml
trichlorophenols
300 mg/ml
3 mg/ml
0,003 mg/ml to 0,5 mg/ml
tetrachlorophenols
200 mg/ml
2 mg/ml
0,002 mg/ml to 0,5 mg/ml
pentachlorophenol
100 mg/ml
1 mg/ml
0,001 mg/ml to 0,5 mg/ml
NOTE The dilution factor for the preparation of the intermediate standards of the monochlorophenols is 3:100. For the other
chlorophenols this factor is 1:100.
These values are given as an indication, the actual choice should reflect the anticipated occurrence of the analytes in the sample, as well
as the linear range of the detector used.
BSI 06-1999
Page 13
EN 12673:1998
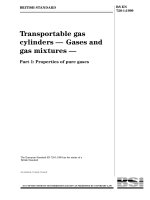
Annex C (informative)
Dimensions in millimetres
All dimensions are approximate.
Figure C.1 Ð Microseparator
BSI 06-1999
Page 14
EN 12673:1998
Annex D (informative)
Guideline for gas chromatography
conditions
The chromatographic separation can be optimized
starting from the following guidelines using the
calibration solutions (9.2.1).
Injection
temperature1: 250 8C
Oven
temperature:
50 8C during 1 min
50 8C to 112 8C at 6 8C/min
112 8C during 1 min
112 8C to 170 8C at 2 8C/min
170 8C during 1 min
170 8C to 280 8C at 20 8C/min
280 8C during 3 min
columns:
A 14% CNRPH Me Siloxane (HP-1701)
B Crosslinked 5% PhMe Silicone (HP-5)
both fused silica, 30 meter, 0,32 mm I.D.
film thickness 0,25 mm.
Detector:
ECD
Detector
temperature: 300 8C
Carrier gas:
helium
Gas flow:
20 cm/s to 30 cm/s
Annex E (informative)
External calibration procedure
In the interlaboratory trial the calibration using both
the internal standard procedure and the external
standard procedure were tested. It proved that the
external standard procedure gave deviating results.
E.1 Treatment of the working standards
Treat the working standards according to 9.2.1
omitting the addition of the internal standard solution.
E.2 Treatment of the samples
Treat the samples according to either 9.1.1 or 9.1.2
depending on whether or not clean-up or enrichment is
required, omitting the addition of the internal standard
solution. Continue with 9.2.
E.3 Calibration of the procedure using external
standards
Establish the linear regression function using the pairs
of values yie and rie of the measured series in the
following equation.
yie = mi 3 rie + bi
(E.1)
Where:
yie
rie
mi
bi
E.4 Interpretation
Compare the gas chromatogram obtained for the
sample extract to the ones obtained with the
acetylated standards. If no peaks appear at the specific
retention times in the chromatogram of the sample
extract consider the compound as not detected.
When electron-capture detection is employed compare
the retention times in both chromatograms. When
peaks appear in both chromatograms at the specific
retention times consider the presence of the
compounds as highly probable.
If mass spectrometric detection is employed proceed
according to 10.1.2.
E.5 Calculation
Calculate the mass concentration of the substance
using equation (E.2) [following the solution of
equation (E.1)].
y 2 bi
ri = i
(E.2)
f 3 mi
Where:
yi
ri
mi
bi
f
1
is the measured value of the determinand i as
e.g. peak height or peak area;
is the mass concentration of the
determinand i in the calibration solution in
micrograms per litre;
is the slope of the calibration function, also
called the response factor;
is the intercept of the calibration function
with the ordinate as e.g. peak height or peak
area.
is the measured value of the determinand i
as e.g. peak height or peak area;
is the mass concentration of substance i,
e.g. in micrograms per litre;
is the slope of the calibration function;
is the intercept of the calibration function
with the ordinate as e.g. peak height or peak
area.
concentration factor; 4 for the procedure with
clean-up/enrichment (9.1.1); 1 for direct
procedure (9.1.2).
Applicable only with split/splitless injection.
BSI 06-1999
BSI 06-1999
Annex F (informative)
Table F.1 Ð Characteristic ions for MS detection
Component
Formula
Molecular
mass
Isotopes (M+n)+
Molecular ion
M+
relative
intensity
n=2
relative
intensity
n=4
relative
intensity
Fragmentation
fragment
M242
relative
intensity
fragment
(M+2)242
relative
intensity
fragment
(M+4)242
relative
intensity
2-Chlorophenolacetate
C8H7O2Cl
170,54
170
10
172
3
128
100
130
34
3-Chlorophenolacetate
C8H7O2Cl
170,54
170
14
172
4,5
128
100
130
29
4-Chlorophenolacetate
C8H7O2Cl
170,54
170
13
172
4
128
100
130
35
2,6-Dichlorophenolacetate
C8H6O2Cl2 205,04
204
4,9
206
3,3
208
0,6
162
100
164
67
166
11
2,4-Dichlorophenolacetate
C8H6O2Cl2 205,04
204
9
206
6
208
0,8
162
100
164
66
166
11
2,5-Dichlorophenolacetate
C8H6O2Cl2 205,04
204
3,5-Dichlorophenolacetate
C8H6O2Cl2 205,04
204
28
206
2,3-Dichlorophenolacetate
C8H6O2Cl2 205,04
204
13
206
3,4-Dichlorophenolacetate
C8H6O2Cl2 205,04
204
2,4,6-Trichlorophenolacetate
C8H5O2Cl3 239,48
238
2,3,6-Trichlorophenolacetate
C8H5O2Cl3 239,48
238
2,3,5-Trichlorophenolacetate
C8H5O2Cl3 239,48
238
8,9
240
2,4,5-Trichlorophenolacetate
C8H5O2Cl3 239,48
238
9,2
2,3,4-Trichlorophenolacetate
C8H5O2Cl3 239,48
238
7
3,4,5-Trichlorophenolacetate
C8H5O2Cl3 239,48
206
19
9,2
162
164
relative
intensity
166
208
0,6
162
100
164
66
166
11
208
1,9
162
100
164
66
166
11
206
11
208
1,9
162
100
164
66
166
11
240
6
242
2,2
196
100
198
98
200
30
202
240
16
242
5,5
196
100
198
100
200
31
202
3,5
9,9
242
2,3
196
100
198
100
200
31
202
3,5
240
9,9
242
2,3
196
96,1
198
100
200
30
202
3,3
240
7,7
242
1,9
196
100
198
98
200
31
202
3,5
238 11,4
240 11,9
242
4,9
196
100
198
100
200
31
202
4
2,3,4,5-Tetrachlorophenolacetate C8H4O2Cl4 273,93
272
274
276
2,3,5,6-Tetrachlorophenolacetate C8H4O2Cl4 273,93
272
5,9
274
7,9
276
4,3
230
79
232
100
234
46
236
10
2,3,4,6-Tetrachlorophenolacetate C8H4O2Cl4 273,93
272
1,6
274
3,1
276
1,5
230
78
232
100
234
47
236
10
Pentachlorophenolacetate
306
1,6
308
2,8
310
2.3
264
66
266
100
268
65
270
22
C8H3O2Cl5 308,37
17
208
fragment
(M+6)242
5,6
15
230
232
234
3,5
236
Page 15
EN 12673:1998
Page 16
EN 12673:1998
Annex G (informative)
Bibliography
[1] Wegman R.C.C., Hofstee A.W.M., Water Research,
Vol. 13, p. 651-657 ªChlorophenols in surface waters of
the Netherlands (1976-1977)º.
[2] Abrahamsson K., Xie T.M.,
J. Chromatogr., 279 (1983), p. 199.
[3] Starck B., Bethge P-O., Gergov M. and Talka E.,
Paperi ja Puu ± Papper och TraÈ, 12 (1985), p. 745.
EN 25667-1:1994, Water quality Ð Sampling Ð Part 1:
Guidance on the design of sampling programmes
(ISO 5667-1:1980).
EN 25667-2:1993, Water quality Ð Sampling Ð Part 2:
Guidance on sampling techniques (ISO 5667-2:1991).
ENV ISO 13530, Water quality Ð Guide to analytical
quality control for water analysis (ISO/TR 13530:1997).
BSI 06-1999
blank
BS EN
12673:1999
BS 6068-2.65:
1999
BSI
389 Chiswick High Road
London
W4 4AL
|
|
|
|
|
|
|
|
|
|
|
|
|
|
|
|
|
|
|
|
|
|
|
|
|
|
|
|
|
|
|
|
|
|
|
|
|
|
|
|
|
|
|
|
|
|
|
|
|
|
|
|
|
|
|
|
|
|
|
|
|
|
|
|
|
|
|
|
|
|
|
|
|
|
|
|
|
|
|
|
|
|
|
|
|
|
|
|
|
|
|
|
|
|
|
|
|
|
|
|
|
|
|
|
|
|
|
|
|
|
|
|
|
|
|
|
|
|
|
|
|
|
|
|
|
|
|
BSI Ð British Standards Institution
BSI is the independent national body responsible for preparing British Standards. It
presents the UK view on standards in Europe and at the international level. It is
incorporated by Royal Charter.
Revisions
British Standards are updated by amendment or revision. Users of British Standards
should make sure that they possess the latest amendments or editions.
It is the constant aim of BSI to improve the quality of our products and services. We
would be grateful if anyone finding an inaccuracy or ambiguity while using this
British Standard would inform the Secretary of the technical committee responsible,
the identity of which can be found on the inside front cover. Tel: 020 8996 9000.
Fax: 020 8996 7400.
BSI offers members an individual updating service called PLUS which ensures that
subscribers automatically receive the latest editions of standards.
Buying standards
Orders for all BSI, international and foreign standards publications should be
addressed to Customer Services. Tel: 020 8996 9001. Fax: 020 8996 7001.
In response to orders for international standards, it is BSI policy to supply the BSI
implementation of those that have been published as British Standards, unless
otherwise requested.
Information on standards
BSI provides a wide range of information on national, European and international
standards through its Library and its Technical Help to Exporters Service. Various
BSI electronic information services are also available which give details on all its
products and services. Contact the Information Centre. Tel: 020 8996 7111.
Fax: 020 8996 7048.
Subscribing members of BSI are kept up to date with standards developments and
receive substantial discounts on the purchase price of standards. For details of
these and other benefits contact Membership Administration. Tel: 020 8996 7002.
Fax: 020 8996 7001.
Copyright
Copyright subsists in all BSI publications. BSI also holds the copyright, in the UK, of
the publications of the international standardization bodies. Except as permitted
under the Copyright, Designs and Patents Act 1988 no extract may be reproduced,
stored in a retrieval system or transmitted in any form or by any means ± electronic,
photocopying, recording or otherwise ± without prior written permission from BSI.
This does not preclude the free use, in the course of implementing the standard, of
necessary details such as symbols, and size, type or grade designations. If these
details are to be used for any other purpose than implementation then the prior
written permission of BSI must be obtained.
If permission is granted, the terms may include royalty payments or a licensing
agreement. Details and advice can be obtained from the Copyright Manager.
Tel: 020 8996 7070.