How to write GRAPHS AND CHARTS in IELTS writing task 1
Bạn đang xem bản rút gọn của tài liệu. Xem và tải ngay bản đầy đủ của tài liệu tại đây (321.19 KB, 6 trang )
GRAPHS AND CHARTS
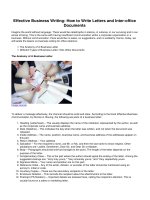
The graph below shows the monthly consumption of vegetables, fish and red meat in kilograms in households in Malaysia between
1990 and 2010.
Fish
Veg
Red Meat
OUTLINE
1st Paragraph
SAMPLE
What is the study all about?
1. Paraphrase
- Show: compare, present, illustrate,
exhibit, showcase
2. Present Tense
3. From, To // Between, And
DRILL:
The graph below shows the monthly consumption of
vegetables, fish and red meat in kilograms in
households in Malaysia between 1990 and 2010.
(Linear Graph.)
The linear graph compares the amount of vegetables,
fish and red meat consumed in kilograms per month
by Malaysian homes from 1990 to 2010.
2nd Paragraph
What is the overall trend?
1. Identify the Relationships
2. Refrain from quoting Specific Figures
- No figures (No numbers)
3. Expressions: By and large, Overall, All in
all, Generally, On the whole
In general, while the demand for red meat was
consistently decreasing, the use of both vegetables and
fish was inversely proportional to that of red meat.
-
Over the span of ____ years
Over a ____ - period
From the start to the end of the period.
Over the surveyed years.
A. Two Types of Relationships:
1. Inversely Proportional // Inverse Proportion
2. Directly Proportional // Direct Proportion
Formula: A is Inversely Proportional to B
Formula: A is Directly Proportional to B
B. Trend
TREND:
Movement + Modifier
MOVEMENT: Increase or Decrease
MODIFIERS
1.
2.
3.
4.
5.
6.
7.
gradually/slowly
dramatically/sharply/steeply
considerably/significantly/markedly
whopping/staggering/tremendous
exponential/astronomical
consistently/continuously/regularly
occasionally/sporadically
3rd and 4th
Paragraph
10- 11- 13- 14- 16- 17
10- 20- 30- 40- 50- 60
10- 35- 70- 95- 120- 150
10- 100- 250- 400- 600
10- 1, 000- 5. 000- 10, 000
10- 11- 13- 25- 40- 42- 43 (GENERIC MODIFIERS)
10- 18- 15- 29- 20- 45 Versus (Fluctuation)
REMINDERS
1. Divide the details into 2 groups.
2. Use the correct verb tenses.
3. Compare and Contrast
OUTLINE
General Description- Trend
- Compare and Contrast 1
- Compare and Contrast 2
Compare and Contrast
1.
2.
3.
4.
5.
6.
Percentage
Folds of Change
Numbers of Change
Plus/ Minus
Range
Enumerate in RARE occasions only.
FORMULA:
1. Percentage
= Fv – Iv x 100%
Iv
2. Folds of Change
= Fv – Iv
Iv
3. Number of Change
= Fv
Iv
4. Plus/ Minus
Plus= Fv- Iv
Minus= Iv- Fv
5. Range
Sv – Hv
From// To; Between// And
3rd Paragraph
GROUP 1
The household members in Malaysia made a dramatic decrease in their red meat consumption. In
1990, 40 kilograms of red meat was eaten by Malaysians per month. After 5 years, it decreased by
25% and was further cut into 50% by 2000. This amount, nonetheless, scaled down to as low as 5
kilograms in the final year which is also equivalent to 12.5%.
4th Paragraph
GROUP 2
Meanwhile, although not as high as meat usage, the demand for fish recorded a steep increase.
Initially 5 kilograms of fish was consumed monthly, yet this went up to 300% after 2 decades.
Moreover, vegetable consumption had an occasional climb ranging between 10 and 14 kilograms
during the years surveyed.
SAMPLE DRILL
The graph below shows the monthly consumption of vegetables, fish and red meat in kilograms in households in
Malaysia between 1990 and 2010.
The linear graph compares the amount of vegetables, fish and red
meat consumed in kilograms per month by Malaysian homes from
1990 to 2010.
In
general, while the demand for red meat was consistently
decreasing, the use of both vegetables and fish was inversely
proportional to that of red meat for a span of 20 years.
The household members in Malaysia made a dramatic decrease in their red meat consumption. In 1990, 40
kilograms of red meat was eaten by Malaysians per month. After 5 years, it decreased by 25% and was further
cut into 50% by 2000. This amount, nonetheless, scaled down to as low as 5 kilograms in the final year which
is also equivalent to 12.5%.
Meanwhile, although not as high as meat usage, the demand for fish recorded a steep increase. Initially 5
kilograms of fish was consumed monthly, yet this went up to 300% after 2 decades. Moreover, vegetable
consumption had an occasional climb ranging between 10 and 14 kilograms during the years surveyed.
EASY DRILL
The graph below shows the number of puppies and kittens sold at X Pet Shop from 2000 to 2015.
1st Paragraph
2nd Paragraph
The linear graph presents the total sales of puppies and kittens between 2000 and 2015 at X
pet shop.
Considerable increase// significant fluctuations
By and large, while puppies had a considerable increase in sales, kittens, in contrast, experienced
significant fluctuations over a 15-year period.
3rd Paragraph
4th Paragraph
DRIFFICULT DRILL
The graph below shows the proportion of the population aged 10 to 15 who were considered genius in three different
countries between 2000 and 2015.
1st Paragraph
2nd Paragraph
3rd Paragraph
4th Paragraph


![have a nice conflict [electronic resource] how to find success and satisfaction in the most unlikely places](https://media.store123doc.com/images/document/14/y/zs/medium_zsa1401356484.jpg)