Minerals - Principle of food chemistry
Bạn đang xem bản rút gọn của tài liệu. Xem và tải ngay bản đầy đủ của tài liệu tại đây (1020.57 KB, 19 trang )
INTRODUCTION
In addition to the major components, all
foods contain varying amounts of minerals.
The mineral material may be present as inor-
ganic or organic salts or may be combined
with organic material, as the phosphorus is
combined with phosphoproteins and metals
are combined with enzymes. More than 60
elements may be present in foods. It is cus-
tomary to divide the minerals into two
groups, the major salt components and the
trace elements. The major salt components
include potassium, sodium, calcium, magne-
sium, chloride, sulfate, phosphate, and bicar-
bonate. Trace elements are all others and are
usually present in amounts below 50 parts
per million (ppm). The trace elements can be
divided into the following three
groups:
1.
essential nutritive elements, which
include Fe, Cu, I, Co, Mn, Zn, Cr, Ni,
Si,
F, Mo, and Se.
2.
nonnutritive, nontoxic elements, in-
cluding Al, B, and Sn
3.
nonnutritive, toxic elements, including
Hg,
Pb, As, Cd, and Sb
The minerals in foods are usually deter-
mined by ashing or incineration. This
destroys the organic compounds and leaves
the minerals behind. However, determined in
this way, the ash does not include the nitrogen
contained in proteins and is in several other
respects different from the real mineral con-
tent. Organic anions disappear during inciner-
ation, and metals are changed to their oxides.
Carbonates in ash may be the result of
decomposition of organic material. The phos-
phorus and sulfur of proteins and the phos-
phorus of lipids are also part of ash. Some of
the trace elements and some salts may be lost
by volatilization during the ashing. Sodium
chloride will be lost from the ash if the incin-
eration temperature is over
60O
0
C.
Clearly,
when we compare data on mineral composi-
tion of foods, we must pay great attention to
the methods of analysis used.
Some elements appear in plant and animal
products at relatively constant levels, but in a
number of cases an abundance of a certain
element in the environment may result in a
greatly increased level of that mineral in
plant or animal products. Enrichment of ele-
ments in a biological chain may occur; note,
for instance, the high mercury levels re-
ported in some large predatory fish species
such as
swordfish
and tuna.
MAJORMINERALS
Some of the major mineral constituents,
especially monovalent species, are present in
Minerals
CHAPTER
5
foods as soluble salts and mostly in ionized
form. This applies, for example, to the cat-
ions sodium and potassium and the anions
chloride and sulfate. Some of the polyvalent
ions,
however, are usually present in the form
of an equilibrium between ionic, dissolved
nonionic, and colloidal species. Such equilib-
ria exist, for instance, in milk and in meat.
Metals are often present in the form of che-
lates.
Chelates are metal complexes formed
by coordinate covalent bonds between a
ligand and a metal cation; the ligand in a che-
late
has two or more coordinate covalent
bonds to the metal. The name chelate is
derived from the claw-like manner in which
the metal is held by the coordinate covalent
bonds of the ligand. In the formation of a che-
late,
the ligand functions as a Lewis base, and
the metal ion acts as a Lewis acid. The stabil-
ity constant of a chelate is influenced by a
number of factors. The chelate is more stable
when the ligand is relatively more basic. The
chelate's
stability depends on the nature of
the metal ion and is related to the electroneg-
ative character of the metal. The stability of a
chelate normally decreases with decreasing
pH.
In a chelate the donor atoms can be N, O,
P,
S, and Cl; some common donor groups are
-NH
2
,
=C=O,
=NH, -COOH, and -OH-O-
PO(OH)
2
.
Many metal ions, especially the
transition metals, can serve as acceptors to
form chelates with these donor groups. For-
mation of chelates can involve ring systems
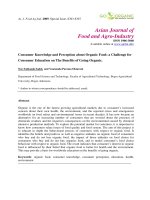
with four, five, or six members. Some exam-
ples of four- and five-membered ring struc-
tures are given in Figure 5-1. An example of
a
six-membered
chelate ring system is chlo-
rophyll. Other examples of food components
that can be considered metal chelates are
hemoglobin and
myoglobin,
vitamin
B
12
,
and
calcium casemate
(Pfeilsticker
1970). It has
also been proposed that the gelation of certain
polysaccharides, such as alginates and pec-
tates,
with metal ions occurs through
chela-
tion involving both hydroxyl and
carboxyl
groups (Schweiger 1966). A requirement for
the formation of chelates by these polysac-
charides is that the OH groups be present in
vicinal pairs.
Concerns about the role of sodium in
human hypertension have drawn attention to
the levels of sodium and potassium in foods
and to measures intended to lower our
sodium intake. The total daily intake by
Americans of salt is 10 to
12
g, or 4 to 5 g of
sodium. This is distributed as 3 g occurring
naturally in food, 3 g added during food
preparation and at the table, and 4 to 6 g
added during commercial processing. This
amount is far greater than the daily require-
ment, estimated at 0.5 g (Marsh 1983). Salt
has an important effect on the flavor and
acceptability of a variety of foods. In addi-
tion to lowering the level of added salt in
food, researchers have suggested replacing
salt with a mixture of sodium chloride and
potassium chloride (Maurer 1983; Dunaif
and Khoo 1986). It has been suggested that
calcium also plays an important role in regu-
lating blood pressure.
Interactions with Other Food
Components
The behavior of minerals is often influ-
enced by the presence of other food constit-
uents.
The recent interest in the beneficial
effect of dietary fiber
has
led to studies of
the role fiber plays in the absorption of min-
erals.
It has been shown (Toma and Curtis
1986) that mineral absorption is decreased
by fiber. A study of the behavior of iron,
zinc,
and calcium showed that interactions
occur with phytate, which is present in fiber.
Phytates can form insoluble complexes with
iron and zinc and may interfere with the
absorption of calcium by causing formation
of fiber-bound calcium in the
intestines.
Iron bioavailability may be increased in the
presence of meat (Politz and Clydesdale
1988).
This is the so-called meat factor. The
exact mechanism of this effect is not known,
but it has been suggested that amino acids or
polypeptides that result from digestion are
able to chelate nonheme iron. These com-
plexes would facilitate the absorption of iron.
In nitrite-cured meats some factors promote
iron bioavailability (the meat factor), particu-
larly heme iron and ascorbic acid or
erythor-
bic acid. Negative factors may
in-clude
nitrite and nitrosated heme (Lee and Greger
1983).
Minerals in Milk
The normal levels of the major mineral
constituents of cow's milk are listed in Table
5-1.
These are average values; there is a
considerable natural variation in the levels of
these constituents. A number of factors
influence the variations in salt composition,
such as feed, season, breed and individuality
of the cow, stage of lactation, and udder
infections. In all but the last case, the varia-
tions in individual mineral constituents do
not affect the milk's osmotic pressure. The
ash content of milk is relatively constant at
about 0.7 percent. An important difference
between milk and blood plasma is the
rela-
Figure
5-1 Examples of Metal
Chelates.
Only the relevant portions of the molecules are shown. The
chelate formers are: (A)
thiocarbamate,
(B) phosphate, (C) thioacid, (D) diamine, (E)
0-phenantrolin,
(F)
oc-aminoacid,
(G)
0-diphenol,
(H) oxalic acid. Source: From K. Pfeilsticker, Food Components as Metal
Chelates, Food Sd.
Technol.,
Vol. 3, pp. 45-51, 1970.
5-Ring
4-Ring
Table
5-1
Average Values for Major Mineral
Content of
Cow's MIIk
(Skim Milk)
Normal Level
Constituent
(mg/100
mL)
Sodium 50
Potassium 145
Calcium 120
Magnesium 13
Phosphorus (total) 95
Phosphorus (inorganic) 75
Chloride 100
Sulfate 10
Carbonate (as
CO
2
)
20
Citrate (as citric acid)
175
tive levels of sodium and potassium. Blood
plasma contains 330 mg/100 mL of sodium
and only 20 mg/100 mL of potassium. In
contrast, the potassium level in milk is about
three times as high as that of sodium. Some
of the mineral salts of milk are present at
levels exceeding their solubility and there-
fore occur in the colloidal form. Colloidal
particles in milk contain calcium, magne-
sium, phosphate, and citrate. These colloidal
particles precipitate with the curd when milk
is coagulated with rennin. Dialysis and ultra-
filtration are other methods used to obtain a
serum free from these colloidal particles. In
milk the salts of the weak acids (phosphates,
citrates, and carbonates) are distributed
among the various possible ionic forms. As
indicated by Jenness and Patton (1959), the
ratios of the ionic species can be calculated
by using the Henderson-Hasselbach equa-
tion,
[salt]
pU=pK
a
+
log
[^id]
The values for the dissociation constants of
the three acids are listed in Table
5-2.
When
these values are substituted in the Henderson-
Hasselbach equation for a sample of milk at
pH 6.6, the following ratios will be obtained:
Citrate"
Citrate
=
^ .
T-J
=
J,IHJU
=
IL
Citric
acid
Citrate
-
Citrate
=
.,
~
=
1°
Citrate"
From these ratios we can conclude that in
milk at pH 6.6 no appreciable free citric acid
or monocitrate ion is present and that
trici-
trate and dicitrate are the predominant ions,
present in a ratio of about 16 to
1.
For phos-
phates, the following ratios are obtained:
H
2
PO
4
'
HP0
4
=
o^prT
=
43
'
600
~-
=
03
°
W
3
FU
4
H
2
PO
4
PO
4
"
—_
= 0.000002
HPO
4
'
This indicates that mono- and diphosphate
ions are the predominant species. For car-
bonates the ratios are as follows:
HCO
3
"
H^CO
3
-
=
L?
C0
3
=
-_=
0.0002
HCO
3
Table
5-2
Dissociation
Constants of Weak Acids
Acid
PK
1
pK
2
pK
3
Citric
3~08474
5^40
Phosphoric
1.96 7.12 10.32
Carbonic
6.37 10.25 —
The predominant forms are bicarbonates and
the free acid.
Note that milk contains considerably more
cations than anions; Jenness and Patton
(1959) have suggested that this can be
explained by assuming the formation of
complex ions of calcium and magnesium
with the weak acids. In the case of citrate
(symbol
©~)
the following equilibria exist:
H©
=
^
©
s
+
H
+
©
s
+
Ca
++
^
Ca
©"
Ca©-
+
H
+
^
CaH ©
2Ca©~
+
Ca
++
^
Ca
3
©
2
Soluble complex ions such as Ca ©~ can
account for a considerable portion of the cal-
cium and magnesium in milk, and analogous
complex ions can be formed with phosphate
and possibly with bicarbonate.
The equilibria described here are repre-
sented schematically in Figure 5-2, and the
levels of total and soluble calcium and phos-
phorus are listed in Table 5-3. The mineral
equilibria in milk have been extensively
studied because the ratio of ionic and total
calcium exerts a profound effect on the sta-
bility of the caseinate particles in milk. Pro-
cessing conditions such as heating and
evaporation change the salt equilibria and
therefore the protein stability. When milk is
heated, calcium and phosphate change from
the soluble to the colloidal phase. Changes in
pH result in profound changes of all of the
salt equilibria in milk. Decreasing the pH
results in changing calcium and phosphate
from the colloidal to the soluble form. At pH
5.2, all of the calcium and phosphate of milk
becomes soluble. An equilibrium change
results from the removal of
CO
2
as milk
leaves the cow's udder. This loss of
CO
2
by
stirring or heating results in an increased pH.
Concentration of milk results in a dual effect.
The reduction in volume leads to a change of
calcium and phosphate to the colloidal
phase,
but this also liberates hydrogen ions,
which tend to dissolve some of the colloidal
calcium phosphate. The net result depends
on initial salt balance of the milk and the
nature of the heat treatment.
The stability of the caseinate particles in
milk can be measured by a test such as the heat
stability test, rennet coagulation test, or alco-
hol stability test. Addition of various phos-
phates—especially
polyphosphates, which are
effective calcium complexing
agents—can
increase the caseinate stability of milk. Addi-
tion of calcium ions has the opposite effect and
decreases the stability of milk. Calcium is
bound by polyphosphates in the form of a che-
late,
as shown in Figure 5-3.
Minerals
in
Meat
The major mineral constituents of meat are
listed in Table
5-4.
Sodium, potassium, and
phosphorus are present in relatively high
amounts. Muscle tissue contains much more
potassium than sodium. Meat also contains
considerably more magnesium than cal-
cium. Table
5—4
also provides information
about the distribution of these minerals
between the soluble and nonsoluble forms.
The nonsoluble minerals are associated with
the proteins. Since the minerals are mainly
associated with the nonfatty portion of meat,
the leaner meats usually have a higher min-
eral or ash content. When liquid is lost from
meat (drip loss), the major element lost is
sodium and, to a lesser extent, calcium,
Table
5-3 Total and Soluble Calcium and
Phosphorus
Content of Milk
Constituent
mg/1
OO
mL
Total
calcium 112.5
Soluble
calcium 35.2
Ionic
calcium 27.0
Total
phosphorus 69.6
Soluble
phosphorus 33.3
phosphorus, and potassium. Muscle tissue
consists of about 40 percent intracellular
fluid, 20 percent extracellular fluid, and 40
percent solids. The potassium is found
almost entirely in the intracellular fluid, as
are magnesium, phosphate, and sulfate.
Sodium is mainly present in the extracellular
Figure
5-3
Calcium Chelate of a
Polyphosphate
Figure 5-2 Equilibrium Among Milk Salts. Source: Reprinted with permission from R. Jenness and S.
Patton, Principles of Dairy
Chemistry,
© 1959, John Wiley & Sons.
Colloidal Complex
Casein
Calcium
Phosphate Magnesium
Citrate
Table
5-4
Mineral Constituents in Meat (Beef)
Constituent
mg/100g
Total calcium
8.6
Soluble calcium
3.8
Total
magnesium
24.4
Soluble magnesium
17.7
Total citrate
8.2
Soluble citrate
6.6
Total inorganic phosphorus 233.0
Soluble inorganic phosphorus
95.2
Sodium
168
Potassium
244
Chloride
48
fluid in association with chloride and bicar-
bonate. During cooking, sodium may be lost,
but the other minerals are well retained. Pro-
cessing does not usually reduce the mineral
content
of
meat. Many processed meats
are
cured
in a
brine that contains mostly sodium
chloride.
As a
result,
the
sodium content
of
cured meats may be increased.
Ionic equilibria play
an
important role
in
the water-binding capacity
of
meat (Hamm
1971). The normal pH
of
rigor
or
post-rigor
muscle
(pH 5.5) is
close
to the
isoelectric
point
of
actomyosin.
At
this point
the net
charge
on the
protein
is at a
minimum.
By
addition
of
an acid or base,
a
cleavage
of
salt
cross-linkages occurs, which increases
the
electrostatic repulsion (Figure
5-4),
loosens
the protein network,
and
thus permits more
water to be taken up. Addition
of
neutral salts
such
as
sodium chloride
to
meat increases
water-holding capacity
and
swelling.
The
swelling effect has been attributed mainly
to
the chloride ion. The existence
of
intra- and
extracellular fluid components
has
been
de-
scribed
by
Merkel
(1971)
and
may explain
the effect
of
salts such
as
sodium chloride.
The proteins inside
the
cell membrane
are
nondiffusible,
whereas
the
inorganic ions
may move across this
semipermeable
mem-
brane.
If a
solution
of
the sodium salt
of a
Figure
5-4
Schematic Representation
of
the
Addition
of
Acid
(HA)
or
Base
(B ) to an
Isoelectric
Pro-
tein.
The
isoelectric protein
has
equal numbers
of
positive
and
negative
charges.
The
acid
HA
donates
protons,
the
base
B~
accepts
protons.
Source:
Reprinted with
permission
from
R.
Hamm,
Colloid
Chem-
istry
of
Meat,
©
1972,
Paul
Parey
(in
German).
Acid:
Base:
protein is on one side of the membrane and
sodium chloride on the other side, diffusion
will occur until equilibrium has been
reached. This can be represented as follows:
3Na
+
3Na
+
4Na
+
2Na
+
3Pr
3cr
3
Pr
2cr
icr
At start At equilibrium
At equilibrium the product of the concen-
trations of diffusable ions on the left side of
the membrane must be equal to the product
on the right side, shown as follows:
[Na
+
]
L
[Cr]
L
=
[Na
+
]
R
[Cl-]
R
In addition, the sum of the cations on one
side must equal the sum of anions on the
other side and vice versa:
[Na
+
]
L
=
[Pr]
L
+
[C1-]
L
and
[Na
+
]
R
=
[CT|
R
This is called the Gibbs-Donnan equilib-
rium and provides an insight into the reasons
for the higher concentration of sodium ions
in the intracellular fluid.
Struvite
Occasionally, phosphates can form unde-
sirable crystals in foods. The most common
example is
struvite,
a magnesium-am-
monium phosphate of the composition
Mg.(NH
4
)PO
4
.6H
2
O.
Struvite crystals are
easily mistaken by consumers for broken
pieces of glass. Most reports of struvite for-
mation have been related to canned seafood,
but occasionally the presence of struvite in
other foods has been reported. It is assumed
that in canned seafood, the struvite is formed
from the magnesium of sea water and ammo-
nia generated by the effect of heat on the fish
or shellfish muscle protein.
Minerals in Plant Products
Plants generally have a higher content of
potassium than of sodium. The major miner-
als in wheat are listed in Table 5-5 and
include potassium, phosphorus, calcium,
magnesium, and sulfur (Schrenk 1964).
Sodium in wheat is present at a level of only
about 80 ppm and is considered a trace ele-
ment in this case. The minerals in a wheat
kernel are not uniformly distributed; rather,
they are concentrated in the areas close to the
bran coat and in the bran
itself.
The various
fractions resulting from the milling process
have quite different ash contents. The ash
content of flour is considered to be related to
quality, and the degree of extraction of wheat
in milling can be judged from the ash content
of the flour. Wheat flour with high ash con-
tent is darker in color; generally, the lower
the ash content, the whiter the flour. This
general principle applies, but the ash content
of wheat may vary within wide limits and is
influenced by rainfall, soil conditions, fertil-
izers,
and other factors. The distribution of
mineral components in the various parts of
the wheat kernel is shown in Table 5-6.
Table
5-5
Major Mineral
Element
Components
in
Wheat Grain
Element Average
(%)
Range
(%)
Potassium
0.40
0.20-0.60
Phosphorus
0.40
0.15-0.55
Calcium
0.05
0.03-0.12
Magnesium
0.15
0.08-0.30
Sulfur
0.20
0.12-0.30
Source:
Reprinted
with
permission
from
W.G.
Schrenk,
Minerals
in
Wheat
Grain,
Technical Bulletin
136,
© 1964,
Kansas
State
University
Agricultural
Experimental
Station.
High-grade patent flour, which is pure
endosperm, has an ash content of 0.30 to
0.35 percent, whereas whole wheat meal
may have an ash content from 1.35 to 1.80
percent.
The ash content of soybeans is relatively
high, close to 5 percent. The ash and major
mineral levels in soybeans are listed in Table
5-7.
Potassium and phosphorus are the ele-
ments present in greatest abundance. About
70 to 80 percent of the phosphorus in soy-
beans is present in the form of phytic acid,
the phosphoric acid ester of inositol (Figure
5-5).
Phytin
is the calcium-magnesium-
potassium salt of inositol hexaphosphoric
acid or phytic acid. The phytates are impor-
tant because of their effect on protein solu-
bility and because they may interfere with
absorption of calcium from the diet. Phytic
acid is present in many foods of plant origin.
A major study of the mineral composition
of fruits was conducted by Zook and Leh-
mann (1968). Some of their findings for the
major minerals in fruits are listed in Table
5-8. Fruits are generally not as rich in min-
erals as vegetables are. Apples have the low-
est mineral content of the fruits analyzed.
The mineral levels of all fruits show great
variation depending on growing region.
The rate of senescence of fruits and vege-
tables is influenced by the calcium content of
the tissue (Poovaiah 1986.) When fruits and
vegetables are treated with calcium solu-
tions,
the quality and storage life of the prod-
ucts can be extended.
TRACE ELEMENTS
Because trace metals are ubiquitous in our
environment, they are found in all of the
foods we eat. In general, the abundance of
trace elements in foods is related to their
abundance in the environment, although this
relationship is not absolute, as has been indi-
cated by Warren (1972b). Table 5-9 presents
the order of abundance of some trace ele-
ments in soil, sea water, vegetables, and
humans and the order of our intake. Trace
elements may be present in foods as a result
of uptake from soil or feeds or from contami-
nation during and subsequent to processing
Table
5-6
Mineral Components in Endosperm and Bran Fractions of Red Winter Wheat
Total
endosperm
Total bran
Wheat kernel
Center sec-
tion
Germ end
Brush end
Entire kernel
P(%)
0.10
0.38
0.35
0.55
0.41
0.44
K(%)
0.13
0.35
0.34
0.52
0.41
0.42
Na(%)
0.0029
0.0067
0.0051
0.0036
0.0057
0.0064
Ca(%)
0.017
0.032
0.025
0.051
0.036
0.037
Mg(%)
0.016
0.11
0.086
0.13
0.13
0.11
Mn (ppm)
2.4
32
29
77
44
49
Fe (ppm)
13
31
40
81
46
54
Cu (ppm)
8
11
7
8
12
8
Source:
From V.H. Morris et
al.,
Studies on the Composition of the Wheat Kernel. II. Distribution of Certain Inor-
ganic Elements in Center Sections,
Cereal
Chem.,
Vol. 22, pp.
361-372,
1945.
of foods. For example, the level of some
trace elements in milk depends on the level
in the feed; for other trace elements,
increases in levels in the feed are not
reflected in increased levels in
the
milk.
Crustacea and
mollusks
accumulate metal
ions from the ambient sea water. As a result,
concentrations of 8,000 ppm of copper and
28,000 ppm of zinc have been recorded
(Meranger and Somers 1968). Contamina-
tion of food products with metal can occur as
a result of pickup of metals from equipment
or from packaging materials, especially tin
cans.
The nickel found in milk comes almost
Table
5-7 Mineral Content of Soybeans (Dry Basis)
Mineral
Ash
Potassium
Calcium
Magnesium
Phosphorus
Sulfur
Chlorine
Sodium
No.
of
Analyses
29
9
7
37
6
2
6
Range
(%)
3.30-6.35
0.81-2.39
0.19-0.30
0.24-0.34
0.50-1.08
0.10-0.45
0.03-0.04
0.14-0.61
Mean
(%)
4.60
1.83
0.24
0.31
0.78
0.24
0.03
0.24
Source:
Reprinted with permission from A.K. Smith and SJ.
Circle,
Soybeans:
Chemistry
and
Technology,
©
1972,
AVI
Publishing Co.
Figure 5-5 Inositol and Phytic Acid
INOSITOL
PHYTIC
ACID
exclusively from stainless steel in processing
equipment. Milk coming from the udder has
no detectable nickel content. On the other
hand, nutritionists are concerned about the
low iron intake levels for large numbers of
the population; this low intake can in part be
explained by the disappearance of iron
equipment and utensils from processing and
food preparation.
Originally, nine of the trace elements were
considered to be essential to humans: cobalt,
copper, fluorine, iodine, iron, manganese,
molybdenum, selenium, and zinc. Recently,
chromium, silicon, and nickel have been
added to this list (Reilly 1996). These are
mostly metals; some are metalloids. In addi-
tion to essential trace elements, several trace
elements have no known essentiality and
Table 5-8 Mineral Content of Some Fruits
Minerals (mg/100
g)
Fruit
Orange (California navel)
Apple (Mclntosh)
Grape (Thompson)
Cherry (Bing)
Pear (Bartlett)
Banana (Ecuador)
Pineapple (Puerto Rico)
N
162
30
121
194
63
168
71
Ca
23.7
2.4
6.2
9.6
4.8
2.7
2.2
Mg
10.2
3.6
5.8
16.2
6.5
25.4
3.9
P
15.8
5.4
12.8
13.3
9.3
16.4
3.0
K
175
96
200
250
129
373
142
Source:
From E.G. Zook and J. Lehmann, Mineral Composition of Fruits, J.
Am.
Dietetic
Assoc.,
Vol. 52, pp. 225-
231,1968.
Table 5-9 Order of Abundance of Some Trace Elements in Various Media
Element
Iron
Manganese
Nickel
Zinc
Copper
Cobalt
Lead
Molybdenum
Cadmium
Mercury
Soil
1
2
4
3
5
7
6
8
9
9
Sea
Water
1
4
7
2
3
8
5
6
?
9
Vegetables
1
3
6
2
4
8
5
7
9
9
Man
1
5
6
2
3
8
4
7
9
10
Man's Intake
1
3
5
2
4
8
6
7
9
9
Source:
From H.V.
Warren,
Geology and Medicine,
Western
Miner,
pp. 34-37,
1972.
some are toxic (such as lead, mercury, and
cadmium). These toxic trace elements, which
are classified as contaminants, are dealt with
in Chapter
11.
Trace elements get into foods by different
pathways. The most important source is from
the soil, by absorption of elements in aque-
ous solution through the roots. Another,
minor, source is foliar penetration. This is
usually associated with industrial air pollu-
tion and vehicle emissions. Other possible
sources are fertilizers, agricultural chemi-
cals,
and sewage sludge. Sewage sludge is a
good source of nitrogen and phosphate but
may contain high levels of trace minerals,
many of these originating from industrial
activities such as electroplating. Trace min-
erals may also originate from food process-
ing and handling equipment, food packaging
materials, and food additives.
Cobalt
Cobalt is an integral part of the only metal
containing vitamin
B
12
.
The level of cobalt
in foods varies widely, from as little as 0.01
ppm in corn and cereals to 1 ppm in some
legumes. The human requirement is very
small and deficiencies do not occur.
Copper
Copper is present in foods as part of sev-
eral copper-containing enzymes, including
the
polyphenolases.
Copper is a very power-
ful prooxidant and catalyzes the oxidation of
unsaturated fats and oils as well as ascorbic
acid. The normal daily diet contains from 2
to 5 mg of copper, more than ample to cover
the daily requirement of 0.6 to 2 mg.
Iron
Iron is a component of the heme pigments
and of some
enzymes.
In spite of the fact that
some foods have high iron levels, much of
the population has frequently been found to
be deficient in this element. Animal food
products may have high levels that are well
absorbed; liver may contain several thousand
ppm of iron. The iron from other foods such
as vegetables and eggs is more poorly ab-
sorbed. In the case of eggs the uptake is poor
because the ferric iron is closely bound to the
phosphate of the yolk phosphoproteins. Iron
is used as a food additive to enrich flour and
cereal products. The form of iron used sig-
nificantly determines how well it will be
taken up by the body. Ferrous sulfate is very
well absorbed, but will easily discolor or oxi-
dize the food to which it is added. Elemental
iron is also well absorbed and is less likely to
change the food. For these reasons, it is the
preferred form of iron for the enrichment of
flour.
Zinc
Zinc is the second most important of the
essential trace elements for humans. It is a
constituent of some enzymes, such as car-
bonic anhydrase. Zinc is sufficiently abun-
dant that deficiencies of zinc are unknown.
The highest levels of zinc are found in shell-
fish, which may contain 400 ppm. The level
of zinc in cereal grains is 30 to 40 ppm.
When acid foods such as fruit juices are
stored in galvanized containers, sufficient
zinc may be dissolved to cause zinc poison-
ing. The zinc in meat is tightly bound to the
myofibrils and has been speculated to influ-
ence meat's water-binding capacity (Hamm
1972).
Manganese
Manganese is present in a wide range of
foods but is not easily absorbed. This metal
is associated with the activation of a number
of enzymes. In wheat, a manganese content
of 49 ppm has been reported (Schrenk 1964).
This is mostly concentrated in the germ and
bran; the level in the endosperm is only 2.4
ppm. Information on the manganese content
of seafoods has been supplied by Meranger
and
Somers
(1968). Values range from a low
of
1.1
ppm in salmon to a high of 42 ppm in
oyster.
Molybdenum
Molybdenum plays a role in several
enzyme reactions. Some of the molybdenum-
containing enzymes are aldehyde oxidase,
sulfite
oxidase, xanthine dehydrogenase, and
xanthine oxidase. This metal is found in
cereal grains and legumes; leafy vegetables,
especially those rich in chlorophyll; animal
organs; and in relatively small amounts, less
than
0.1
ppm, in fruits. The molybdenum con-
tent of foods is subject to large variations.
Selenium
Selenium has recently been found to pro-
tect against liver necrosis. It usually occurs
bound to organic molecules. Different sele-
nium compounds have greater or lesser pro-
tective effect. The most active form of
selenium is selenite, which is also the least
stable chemically. Many selenium com-
pounds are volatile and can be lost by cook-
ing or processing. Kiermeier and Wigand
(1969) found about a 5 percent loss of sele-
nium as a result of drying of skim milk. The
variation in selenium content of milk is wide
and undoubtedly associated with the sele-
nium content of the soil. The same authors
report figures for selenium in milk in various
parts of the world ranging from 5 to 1,270
|ig/kg.
The selenium in milk is virtually all
bound to the proteins. Morris and Levander
(1970)
determined the selenium content of a
wide variety of foods. Most fruits and vege-
tables contain less than 0.01
|iig/g.
Grain
products range from 0.025 to 0.66
|ig/g,
dried skim milk from 0.095 to 0.24
|Hg/g,
meat from
0.1
to 1.9
M-g/g,
and seafood from
0.4 to 0.7
|iig/g.
Fluorine
Fluorine is a constituent of skeletal bone
and helps reduce the incidence of dental car-
ies.
The fluorine content of drinking water is
usually below 0.2
mg/L
but in some loca-
tions may be as high as 5
mg/L.
The optimal
concentration for dental health is 1
mg/L.
The fluoride content of vegetables is low,
with the exception of spinach, which con-
tains 280
|0,g/100
g. Milk contains 20
[Ig/
100 g and beef about 100
|Lig/100
g. Fish
foods may contain up to 700
|ng/100
g and
tea about 100
|Hg/g.
Iodine
Iodine is not present in sufficient amounts
in the diet in several areas of the world; an
iodine deficiency results in goiter. The addi-
tion of iodine to table salt has been extremely
effective in reducing the incidence of goiter.
The iodine content of most foods is in the
area of a few
mg/100
g and is subject to great
local variations. Fish and shellfish have
higher levels. Saltwater fish have levels of
about 50 to 150 mg/100 g and shellfish may
have levels as high as 400 mg/100 g.
Nickel
Foods with a relatively high nickel content
include nuts, legumes, cocoa products, shell-
fish, and hydrogenated fats. The source of
nickel in the latter results from the use of
nickel catalyst in the hydrogenation process.
Animal products are generally low in nickel,
plant products high (Table 5-10). The intake
of nickel from the diet depends, therefore, on
the origin and amounts of various foods con-
sumed. Dietary nickel intake has been esti-
mated to be in the range of
150
to 700
|Lig/day
(Nielsen 1988), and the suggested dietary
nickel requirement is about 35
|ig/day.
Finished hydrogenated vegetable oils con-
tain less than 1 mg/kg nickel. Treatment of
the finished oil with citric or phosphoric acid
followed by bleaching should result in nickel
levels of less than 0.2
mg/kg.
Chromium
Recent well-controlled studies (Anderson
1988) have found that dietary intake of chro-
Table
5-10 Nickel Content of Some Foods
Nickel Content
Food
([ig/g Fresh Weight)
Cashew nuts 5.1
Peanuts
1.6
Cocoa powder 9.8
Bittersweet
chocolate 2.6
Milk chocolate
1.2
Red kidney beans 0.45
Peas,
frozen 0.35
Spinach 0.39
Shortening 0.59-2.78
Source: Reprinted with permission from RH.
Nielsen,
The Ultratrace Elements, in
Trace Minerals
in
Foods,
KT. Smith, ed., p. 385, 1988, by courtesy of
Marcel Dekker, Inc.
mium is in the order of 50
|ig/day.
Refining
and processing of foods may lead to loss of
chromium. As an example, in the milling of
flour, recovery of chromium in white flour is
only 35 to 44 percent of that of the parent
wheat (Zook et
al.
1970). On the other hand,
the widespread use of stainless steel equip-
ment in food processing results in leaching
of chromium into the food products
(Offen-
bacher and Pi-Sunyer 1983). No foods are
known to contain higher-than-average levels
of chromium. The average daily intake of
chromium from various food groups is
shown in Table
5-11.
It has been suggested
that the dietary intake of chromium in most
normal individuals is suboptimal and can
lead to nutritional problems (Anderson
1988).
Silicon
Silicon is ubiquitous in the environment
and present in many foods. Foods of animal
origin are relatively low in silicon; foods of
plant origin are relatively high. Good plant
sources are unrefined grains, cereal products,
and root crops. The dietary intake of silicon
is poorly known but appears to be in the
range of 20 to 50
|iig/day.
Although silicon is
now regarded as an essential mineral for
humans, a minimum requirement has not
been established.
Additional Information on Trace
Elements
The variations in trace elements in vegeta-
bles may be considerable (Warren 1972a)
and may depend to a large extent on the
nature of the soil in which the vegetables are
grown. Table 5-12 illustrates the extent of
the variability in the content of copper, zinc,
lead, and molybdenum of a number of vege-
tables.
The range of concentrations of these
metals frequently covers one order of magni-
tude and occasionally as much as two orders
of magnitude. Unusually high concentrations
of certain metals may be associated with the
incidence of diseases such as multiple sclero-
sis and cancer in humans.
Aluminum, which has been assumed to be
nonnutritious and nontoxic, has come under
increasing scrutiny. Its presence has been
suggested to be involved in several serious
conditions, including Alzheimer's disease
(Greger 1985). Since aluminum is widely
used in utensils and packaging materials,
there is great interest in the aluminum con-
tent of foods. Several aluminum salts are
used as food additives, for example, sodium
aluminum phosphate as a leavening agent
and aluminum sulfate for pH control. The
estimated average daily intake of aluminum
is 26.5 mg, with 70 percent coming from
grain products (Greger 1985).
Fruits contain relatively high levels of
organic acids, which may combine with
metal ions. It is now generally agreed that
these compounds may form chelates of the
general formula
M
y
H
p
L
m
(OR)
x
,
where M
and L represent the metal and the ligand,
respectively. According to Pollard and Tim-
berlake
(1971),
cupric
ions form strong com-
plexes with acids containing
oc-hydroxyl
groups. The major fruit acids, citric, malic,
and
tartaric,
are multidendate ligands capa-
ble of forming polynuclear chelates. Cupric
and ferric ions form stronger complexes than
ferrous ions. The strongest complexes are
formed by citrate, followed by malate and
then tartrate.
METAL UPTAKE IN CANNED FOODS
Canned foods may take up metals from the
container, tin and iron from the tin plate, and
tin and lead from the solder. There are sev-
eral types of internal can corrosion. Rapid
detinning
is one of the most serious problems
of can corrosion. With most acid foods,
when canned in the absence of oxygen, tin
forms the anode of the tin-iron couple. The
tin under these conditions goes into solution
Table
5-11
Chromium Intake from Various Food Groups
Food
Group
Cereal products
Meat
Fish and seafood
Fruits,
vegetables, nuts
Dairy products, eggs, margarine
Beverages, confectionery, sugar, and
condiments
Total
Average
Daily
Intake
(\ig)
3.7
5.2
0.6
6.8
6.2
6.6
29.1
Co/?7A77ente
55%
from wheat
55%
from pork
25%
from beef
70%
from fruits and berries
85%
from milk
45%
from beer, wine, and soft
drinks
Source:
Reprinted with permission from
R.
A.
Anderson, Chromium, in
Trace Minerals
in
Foods,
KT. Smith,
ed.,
p.
238,
1988,
by courtesy of Marcel Dekker, Inc.
at an extremely slow rate and can provide
product protection for two years or longer.
There are, however, conditions where iron
forms the anode, and in the presence of
depolarizing or oxidizing agents the dissolu-
tion of tin is greatly accelerated. The food is
protected until most of the tin is dissolved;
thereafter, hydrogen is produced and the can
swells and becomes a springer. Some foods
are more likely to involve rapid detinning,
including spinach, green beans, tomato prod-
ucts,
potatoes, carrots, vegetable soups, and
Table
5-12
Extreme
Variation
in the Content of Copper, Zinc, Lead, and Molybdenum in Some
Vegetables
Copper
Lettuce
Cabbage
Potato
Bean (except broad)
Carrot
Beet
Zinc
Lettuce
Cabbage
Potato
Bean (except broad)
Carrot
Beet
Lead
Lettuce
Cabbage
Potato
Bean (except broad)
Carrot
Beet
Molybdenum
Lettuce
Cabbage
Potato
Bean (except broad)
Carrot
Beet
"Normal"
Content
in ppm Wet
Weight
0.74
0.26
0.92
0.56
0.52
0.78
4.9
1.9
2.9
3.6
3.4
4.1
0.25
0.10
0.40
0.24
0.22
0.20
0.06
0.20
0.15
0.48
0.22
0.04
Minimum
as
Fraction
of
"Normal"
1
/15
1
/6
1
/9
%
VQ
1
/9
1
/6
1
/2
1
/2
1
/2
1
/2
1
/4
1
/10
Vs
1
/10
1
/5
1
/3
VQ
VB
!£o
1/16
%0
1
/4
1
/30
Maximum
as
Multiple
of
"Normal"
8
2.5
4
2.5
2.5
2.5
15
6
5
2
8
12
30
2.5
15
4
9
11
12
8
7.5
7
3.5
10
Extreme
Range
1-120
1-15
1-36
1-22
1-22
1-20
1-90
1-12
1-10
1-4
1-48
1-16
1-300
1-20
1-150
1-20
1-27
1-66
1-96
1-240
1-120
1-210
1-14
1-300
Source:
From H.V. Warren, Variations in the Trace Element Contents of Some Vegetables, J.
Roy.
Coll.
Gen.
Prac-
tit.,Vo\.
22, pp. 56-60, 1972.
certain fruit juices such as prune and grape-
fruit juice.
Another corrosion problem of cans is
sul-
fide staining. This may happen when the
food contains the sulfur-containing amino
acids cysteine, cystine, or
methionine.
When
the food is heated or aged, reduction may
result in the formation of
sulfide
ions, which
can then react with tin and iron to form SnS
and FeS. The compound SnS is the major
component of the sulfide stain. This type of
corrosion may occur with foods such as
pork, fish, and peas (Seiler 1968). Corrosion
of tin cans depends on the nature of the
canned food as well as on the type of tin
plate used. Formerly, hot dipped tin plate
was used, but this has been mostly replaced
by electrolytically coated plate. It has been
shown (McKirahan et
al.
1959) that the size
of the crystals in the tin coating has an
important effect on corrosion resistance. Tin
plate with small tin crystals easily develops
hydrogen swell, whereas tin plate containing
large crystals is quite resistant. Seiler
(1968)
found that the orientation of the different
crystal planes also significantly affected the
ease of forming sulfide stains.
The influence of processing techniques for
grapefruit juice on the rate of can corrosion
was studied by
Bakal
and Mannheim
(1966).
They found that the dissolved tin content can
serve as a corrosion indicator. In Israel the
maximum prescribed limit for tin content of
canned food is 250 ppm. Deaeration of the
juice significantly lowers tin dissolution. In a
study of the
in-can
shelf life of tomato paste,
Vander Merwe and Knock
(1968)
found that,
depending on maturity and variety, 1 g of
tomato paste stored at
22
0
C
could corrode tin
at rates ranging from 9 x
10~
6
g/month to 68
x
10~
6
g/month. The useful shelf life could
vary from 24 months to as few as 3 months.
Up to 95 percent of the variation could be
related to effects of maturity and variety and
the associated differences in contents of
water-insoluble solids and nitrate.
Severe detinning has often been observed
with applesauce packed in plain cans with
enameled ends. This is usually characterized
by detinning at the headspace interface.
Stevenson and Wilson (1968) found that
steam flow closure reduced the detinning
problem, but the best results were obtained
by complete removal of oxygen through
nitrogen closure. Detinning by canned spin-
ach was studied by Lambeth et al.
(1969)
and
was found to be significantly related to the
oxalic acid content of the fresh leaves and
the pH of the canned product.
High-oxalate
spinach caused detinning in excess of 60 per-
cent after 9 months' storage.
In some cases the dissolution of tin into a
food may have a beneficial effect on food
Table 5-13 Iron and Tin Content of Fruit Juices
Product Iron (ppm) Tin (ppm)
Fresh orange 0.5 7.5
juice
Bottled orange 2.5 25
juice
Bottled orange 2.0 50
juice
Bottled pineapple 15.0 50
juice
Canned orange 2.5 60
juice
Canned orange 0.5 115
juice
Canned orange 2.5 120
juice
Canned pineapple 17.5 135
juice
Source:
From WJ. Price and J.T.H. Roos, Analysis
of Fruit Juice by Atomic Absorption Spectrophotometry.
I. The Determination of Iron and Tin in Canned Juice,
J. Sd.
FoodAgric.,
Vol. 20, pp.
427-439,
1969.
color, with iron having the opposite effect.
This is the case for canned wax beans (Van
Buren and Downing 1969).
Stannous
ions
were effective in preserving the light color
of the beans, whereas small amounts of iron
resulted in considerable darkening. A black
discoloration has sometimes been observed
in canned all-green asparagus after opening
of the can. This has been attributed (Lueck
1970) to the formation of a black, water-
insoluble coordination compound of iron
and
rutin.
The iron is dissolved from the can,
REFERENCES
Anderson,
R.A.
1988. Chromium. In
Trace
minerals in
foods,
ed. K.T. Smith. New York: Marcel Dekker.
Bakal,
A.,
and H.C. Mannheim. 1966. The influence of
processing variants of grapefruit juice on the rate of
can corrosion and product quality. Israel J. Technol.
4:
262-267.
Dunaif,
G.D., and C S. Khoo. 1986. Developing low
and reduced-sodium products: An industrial per-
spective. Food
Technol.
40, no. 12: 105-107.
Greger, J.L. 1985. Aluminum content of the American
diet. Food
Technol.
39, no. 5: 73-80.
Hamm, R.
1971.
Interactions between phosphates and
meat proteins. In Phosphates in food
processing,
ed.
J.M. deMan and P. Melnychyn. Westport, CT: AVI
Publishing Co.
Hamm, R. 1972. Colloid chemistry of meat (in Ger-
man).
Berlin: Paul Parey.
Jenness,
R.,
and S. Patton. 1959. Principles of dairy
chemistry.
New York: John Wiley & Sons.
Kiermeier, F, and W.
Wigand.
1969. Selenium content
of milk and milk powder (in German). Z Lebensm.
Unters.
Forsch.
139:
205-211.
Lambeth, V.N., et
al.
1969. Detinning by canned spin-
ach as related to oxalic acid, nitrates and mineral
composition. Food
Technol.
23, no. 6:
132-134.
Lee,
K.,
and J.L. Greger. 1983. Bioavailability and
chemistry of iron from nitrite-cured meats. Food
Technol.
37, no. 10: 139-144.
Lueck, R.H. 1970. Black discoloration in canned
asparagus. Interrelations of iron, tin, oxygen, and
rutin. Agr. Food
Chem.
18: 607-612.
and the rutin is extracted from the asparagus
during the sterilization. Rutin is a flavonol,
the
3-rutinoside
of quercetin. The black dis-
coloration occurs only after the iron has
been oxidized to the ferric state. Tin forms a
yellow, water-soluble complex with rutin,
which does not present a color problem. The
uptake of iron and tin from canned foods is a
common occurrence, as is demonstrated by
Price and Roos (1969), who studied the
presence of iron and tin in fruit juice (Table
5-13).
Marsh, A.C. 1983. Processes and formulations that
affect the sodium content of foods. Food Technol.
37,
no. 7:
45-49.
Maurer, AJ. 1983. Reduced sodium usage in poultry
muscle foods. Food
Technol.
37, no. 7:
60-65.
McKirahan, R.D., et al. 1959. Application of differen-
tially coated tin plate for food containers. Food
Technol. 13: 228-232.
Meranger, J.C., and E. Somers. 1968. Determination of
the heavy metal content of seafoods by atomic
absorption spectrophotometry. Bull. Environ. Con-
tamination
Toxicol.
3: 360-365.
Merkel,
R.A.
1971. Inorganic constituents. In The sci-
ence of meat and meat
products,
ed. J.F. Price and
B.S.
Schweigert. San Francisco: W.H. Freeman and
Co.
Morris, V.C., and
O.A.
Levander. 1970. Selenium con-
tent of
foods. J. Nutr. 100: 1383-1388.
Nielsen, RH. 1988. The ultratrace elements. In Trace
minerals
in
foods, ed. K.T. Smith. New York: Marcel
Dekker.
Offenbacher, E.G., and F.X. Pi-Sunyer. 1983. Tempera-
ture and pH effects on the release of chromium from
stainless steel into water and fruit juices. J. Agr.
Food
Chem.
31: 89-92.
Pfeilsticker,
K. 1970. Food components as metal che-
lates.
Food Sd.
Technol.
3:
45-51.
Politz, M.L., and RM. Clydesdale. 1988. Effect of
enzymatic digestion, pH and molecular weight on
the iron solubilizing properties of chicken muscle. J.
Food
ScL
52: 1081-1085, 1090.
Pollard,
A.,
and C.F.
Timberlake.
1971. Fruit juices. In
The biochemistry of fruits and their
products,
Vol. 2,
ed. A.C.
Hulme.
New York: Academic Press.
Poovaiah,
B.W.
1986. Role of calcium in prolonging
storage life of fruits and vegetables. Food
Technol
40,
no. 5: 86-89.
Price,
W.J.,
and J.T.H. Roos. 1969. Analysis of fruit
juice by atomic absorption spectrophotometry I. The
determination of iron and tin in canned juice. J. ScL
FoodAgric.
20:
427-439.
Reilly, C. 1996. Selenium in food and health. London:
Blackie Academic and Professional.
Schrenk, W.G. 1964. Minerals in
wheat
grain. Techni-
cal Bulletin 136. Manhattan, KS: Kansas State Uni-
versity Agricultural Experimental Station.
Schweiger,
R.G. 1966. Metal chelates of pectate and
comparison with alginate.
KolloidZ.
208:
28-31.
Seiler, B.C. 1968. The mechanism of
sulflde
staining
of tin foodpacks. Food Technol 22: 1425-1429.
Stevenson, C.A., and C.H. Wilson. 1968. Nitrogen
enclosure of canned applesauce. Food
Technol.
33:
1143-1145.
Toma, R.B., and DJ. Curtis. 1986. Dietary fiber: Effect
on mineral
bioavailability.
Food
Technol.
40, no. 2:
111-116.
Van Buren, J.P., and D.L. Downing. 1969. Can charac-
teristics, metal additives, and chelating agents:
Effect on the color of canned wax beans. Food Tech-
nol 23: 800-802.
Vander
Merwe,
H.B., and G.G. Knock. 1968.
In-can
shelf life of tomato paste as affected by tomato vari-
ety and maturity. J. Food Technol
3:
249-262.
Warren,
H.V.
1972a. Variations in the trace element
contents of some vegetables. J. Roy. Coll Gen.
Practit. 22:
56-60.
Warren,
H.V.
1972b. Geology and medicine. Western
Miner,
Sept.,
34-37.
Zook, E.G. et
al.
1970. Nutrient composition of
selected wheat and wheat products. Cereal
Chem.
47:
720-727.
Zook, E.G., and J. Lehmann. 1968. Mineral composi-
tion of fruits. J. Am. Dietetic Assoc. 52:
225-231.