predicting the effect of shot peening on weld fatigue life
Bạn đang xem bản rút gọn của tài liệu. Xem và tải ngay bản đầy đủ của tài liệu tại đây (517.14 KB, 16 trang )
PREDICTING
THE
EFFECT
OF
SHOT
PEENING
ON
WELD
FATIGUE
LIFE
Se-Tak
Chang
and
F.
V.
Lawrence.
Jr.
Department
of
Metallurgy
and
Mining
Engineering, University
of
Illinois at
Urbana-Champaign, Urbana, IL
61801, USA
ABSTRACT
An
analytical
model
was
developed
to
predict
the
effect
of shot peening
on
the
fatigue
life
of a weld.
The
total
fatigue
life
of a
weld
was
considered to
be
composed
of a crack
initiation
and
crack propagation period. Residual
stresses
and
the material
properties
of the
peened
surface
were
considered in the
estimation of the crack
initiation
life
but
not
in the crack propagation
life.
The
shot-peened
weld
toe
was
considered to
be
a
strain
hardened
and
heavily
plastic-deformed surface layer with
altered
material
properties
and
high
compressive residual
stresses.
Fatigue notch factors
(Kf)
were
estimated using
Peterson's
equation
and
the
Kf
maximum
concept.
The
max1mum
compressive residual
stresses
at
weld
toe introduced
by
shot peening
were
estimated
from
experimental
data.
Neuber's rule
was
used
to
determine the local
stress-strain
behavior
and
the
mean
stress
established
during the set-up cycle at
weld
toe.
Fatigue
tests
of
A514
grade
F/E110
steel
butt
welds in the shot peened
and
as-welded conditions
were
conducted to verify the
analytically
predicted
total
fatigue
lives.
KEYWORDS
Fatigue
of
weldments; shot peening;
fatigue
life
predictions;
fatigue.
IMPROVING
THE
FATIGUE
RESISTANCE
OF
WELDS
The
fatigue
resistance
of welds
is
generally
less
than
that
of the plain
plate
members
which
they
join.
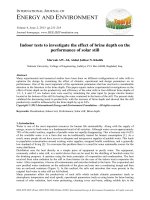
Figure 1
shows
the output of a fatigue data
bank
compiled
by
Munse
(1)
for mild
steel
butt
welds.
As
shown
in Fig. 1 for mild
steel,
the average fatigue strength of plain
plate
is
significantly
greater
than
that
of welds. This loss in
fatigue
life
can
be
reduced
by
one
of several
methods:
altering
the
weld
geometry,
c~mtrolling
weld
residual
stresses
or
by
improving the material
properties
which
promote
greater
fatigue
resistance.
As
will
be
discussed in
this
study, shot peening
is
a very
effective
post-weld
treatment
which
lengthens the fatigue
life
by
the
latter
two
means.
The
fatigue
resistance
of a
weldment
can
never exceed the fatigue
life
of the plain
plate
which
it
joins;
therefore,
no
weld
fatigue
life
improvement
scheme
can
lead
to
lives
in excess of the plain
plate
fatigue
resistance.
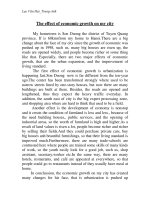
This fact leads to the
concept of
maximum
recoverable
life,
the
difference
between
plain
plate
and
weldment
fatigue
life
at a given
stress
(see Fig.
2).
SP-
f_E
461
462
PREDICTING
THE
FATIGUE
RESISTANCE
OF
WELDS
To
permit the accurate prediction of
weldment
fatigue
reistance
and
to provide a
means
of
interrelating
the parameters
which
improve
the fatigue
life
of welds,
an
analytical
model
for estimating the
total
fatigue
life
of
welds
has
been
developed
(2)
which
assumes
that
the
total
fatigue
life
of a
weldment
{NT)
is
composed
of a
fatigue crack
initiation
period
{NI)
and
a fatigue crack propagation period
{Np)
such
that:
100
80
60
40
<J>
20
-"'
0
<J>
<J>
~
Ui
x
0
;:;:
Fig.
l.
~
U)
100
<J
80
.,
"'
60
c
0
0:
"'
40
"'
~
U)
20
10
4
10
Fig. 2.
Mild Steel R = 0
AW
= Butt Welds,
As
Welded
PP
= Plain Plate
Lower Tolerance
Limit-
99
'7o
Survival
50'7o
Confidence Level
95'7.
Confidence Level
Cycles
To
Failure,
In
Thousands
Stress
range versus cycles to
failure
for
mild
steel
butt
welds
subjected to
zero-to-tension
loading.
The
fatigue
resistance
of
as-welded
butt
welds
is
generally
less
than the
fatigue
resistance
of
plain
plate.
A514/EIIO
Bull
Weld
R=O
t = 12.7mm
(l/2in.)
o-
AW(<T,
=+
Sy)
Ktm =3.13
.p=90°
8=45°
-
PP(<T,
=0)
1000
c
a
BOO
;:;:
ui
_
600
<J
_
.,
400
"'
c
0
0:
"'
"'
200
~
Ui
100
5 6 7
10
10
10
Reversals
To
Failure , 2N
1
The
maximum
recoverable
life
of
ASTM
A514/Ell0
butt
welds.
463
The
initiation
portion of
life
(N
1
)
is
estimated using
strain-control
faigue data
and
is
considered to
consist
of the
number
of cycles for the
initiation
of a
fatigue
crack(s)
and
its
(their)
early
growth
and
coalescence
into
a dominant
fatigue crack.
The
fatigue
crack propagation portion of
life
(N
)
is
estimated
using (long-crack) fatigue-crack propagation data assuming the
"gppropriate" value
of the
initiated
crack length (a
1
).
The
base metal of a
weld
is
seldom
involved in the
fatigue
crack
initiation
pro-
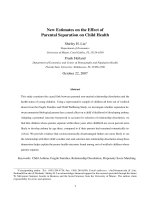
cess (Fig.
3);
most
fatigue cracks
initiating
at
internal defects
do
so
in
tempered
weld
metal; toe cracks will
initiate
in the grain-coarsened heat
affected-zone (high wetting angles) or in untempered, highly
diluted
weld
metal
(low
wetting
angles).
Test data
on
weld
metal
and
heat
affected
zone
materials
are generally unavailable
and
difficult
to obtain experimentally, but
it
is
possible
to
estimat~
roughly the
fatigue
strength
coefficient
(a;),
the
transition
fatigue
life
(2Ntr) , the fatigue strength exponent (b)
and
the
mean
stress
relaxation exponent (k)
from
hardness (Fig. 4) determined
by
measurements
performed in the region
which
the
fatigue
crack
is
expected to
initiate
(3).
5
For
long-life
fatigue
(N
1
> 10
cycles),
cyclic hardening
and
softening
effects
can
usually
be
ignored,
and
generally
elastic
conditions
may
be
asssumed.
For
such
cases, N
1
can
account for the major portion of the
total
fatigue
life
and
can
be
estimated using the Basquin
relationship
(4):
where:
aa
=
(a.f
- a
0
)
[2N
1
Jb
(2)
aa
is
the
stress
amplitude,
a.f
is
the
fatigue
strength
coefficient,
a
0
is
the
mean
stress
including
weld
residual as well as
remote
mean
stress,
2N
1
is
the reversals to
fatigue
crack
initiation,
and
b
is
the fatigue strength exponent.
The
notch-root
stress
amplitude, the
stress
at
the
critical
region in the
weld
(weld
toe or
internal
defect),
can
be
taken
as
~S/2
Kf
so
that
Eq.
2
becomes:
~S
Kf
= (a.f - a
0
)
[2N
1
Jb
(3)
where:
65
is
the remote
stress
range,
and
Kf
is
the
fatigue
notch
factor
(also
Kfmax)·
A
difficulty
in proceeding with the
life
estimation
calculation
suggested
by
Eq.
3
is
determining the appropriate value of
Kf
for the
weld
toe.
This
difficulty
arises
from
the
fact
that
the notch-root radius of a
discontinuity
such
as
the
weld
toe
is
unknown
and
variable.
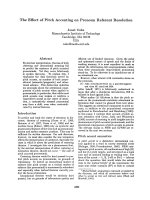
Microscopic examination of
weld
toes reveals
*The
transition
fatigue
life,
Ntr•
is
defined
as
the fatigue
life
at
which
the
elastic
and
plastic
strains
are equal.
464
that
practically
any
value of radius
can
be
observed (see Fig. 7);
thus,
notches
such
as
weld
toes
must
be
considered
to
have
all
possible values of notch-root
radius
which
conclusion
has
led to the idea of a
maximum
value of
Kf
for a given
weld
shape,
Kfmax
(2).
Kf
can
be
estimated using Peterson's equation:
K - 1
K
1+-t
__
f = 1 +
~
r
(4)
where:
Kt
is
the
elastic
stress
concentration
factor,
5
_2
for
steels
(mm),
a
is
a material
parameter(~
1.08 x
10
Su
),
r
is
the notch-root radius
(mm),
and
Su
is
the ultimate strength
(MPa).
The
elastic
stress
concentration
factor
(Kt)
can
be
estimated using
finite
element
methods
as
a function of
assumed
notch root radii
(r)
for a given
we
1 d
geometry
(Fig.
5).
Assuming
the general
form
of
Kt
for
welds
(5):
where:
lj2
Kt
= 1 + a ( t I
r)
(
5)
a
is
a constant determined
by
the
weld
geometry
and
type of loading
and
t
is
the
plate
thickness.
Fig. 3. Typical locations of
fatigue
crack
initiation
in a
butt
weld.
Fatigue cracks
can
initiate:
in
diluted,
untempered
weld
metal
(A); in
the heat
affected
zone
close to the
line
of fusion (B);
and
in tempered
weld
metal (C).
465
10
4
"'
0
10
3
E
"'
>
"'
b
Cl:
-
z
C\1
_.,.,"'~+50
2
-log
2N
1
=-Q00633BHN
+5.463
ll
SAE
1045
ll
SAE
1045
ll
0
o SAE
950
C
o SAE
950
C
o
SAE
950
X
10
o
SAE
950
X
•
Van-
80
•
Van
-80
• A36
(BM,
HAZ,
WM)
ol
A36
(BM,
HAZ,
WM)
e A514 (BM,
HAZ,
WM)
e A514
(BM,
HAZ,
WM)
00
I
0
100
200
300
400
500
600
700
800
Hardness,
BHN
Hardness,
BHN
-0.14
-0.5
-b.,
_J._
log ( 2(BHN+IOO))
ll<l2
A36 Group
A514
Group
6
BHN
(•m =
±0.005)
(•m
= ± 0.004)
ll
SAE
1045
±0.002
ll
0
-0.12
0
o
SAE
950
C
-0.4
f-
±0.003
•
o
SAE
950
X
±0004
'V
0
•
Van
-80
0
ol
A36(BM,HAZ,WM)
e
A514
(BM,HAZ,
WM)
c
"'
-0.10
c
-0.3-
0
'V
a.
ll
"
'V
w
-'V
.c
c
.2
'V
-0.08
0
-0.2-
ll
"
__,___
0
.2
"'
Cl:
0
ll
~~
-0.06
-0.1-
ll
0
1\
•
•
-0.040
0
~~
I I
100
200
300
400
500
600
700
800
0
100
200
300
400
500
600
700
800
Hardness,
BHN
Hardness, BHN
Fig. 4. Variation
of
of'
b, 2Ntr'
and
k with Brinnel Hardness
(BHN).
Substituting
this
into
Eq.
4
and
differentiating
with respect
to
(r)
to
obtain the
maximum
value of
Kf,
Kfmax=
1J2
lj2
) ( )
Kfmax
= 1 +
(a/2}(t/a)
" 1 +
.0015a
Sut
(for
steel
6
466
As
seen in Fig. 5,
Kt
always increases with decreasing
(r),
but
Kf
passes through
a
maximum
(Kfmaxl
at
rcrit
equal to "a" in
Peterson's
equation
(Eq.
4).
Kfmax
should
be
the largest possible value of
Kf
for the
weld
shape
and
material
1n
question. Because
"a"
is
dependent
upon
the ultimate strength (Su), higher
strength
steels
will
have
higher values of
Kfmax
for the
same
weld
shape.
In
addition,
Kfmax
depends
upon
the shape of the
weld
and
the type of loading
to
which
it
is
subjected
(a),
and
upon
the
size
or scale of the
weldment
(t).
Using
Eq.
6
and
the observed
variation
in fatigue
properties
with hardness (Fig.
4),
Eq.
3
can
be
rewritten:
where:
s =
a
Su
+
344
-
crr
1+.0015a
Sut I
the
fatigue
strength
at
2N
1
(R
=
-1),
and
crr
is
the residual
stress
at
weld
toe.
(7)
The
fatigue
strength of
steel
weldments
predicted
by
Eq.
7
is
a function of
Su
and
is
plotted
in Fig.
6
6 for
three
assumptions of
weld
toe residual
stress
(crr)
at a
fatigue
life
of
10
cycles.
5.0 , , , ,
0
4>
=
90°
8 =
60°
I t =
25mm
I s
I
I
I
\(Kt
180-8
\
~ (Ktlmax
=
3.31
\
\
\
'\
- (Ktlmax =
2.68
'
',
r (mm)
s
Fig. 5. Variations
of
Kfmax
with
strength
level (Su)
and
consequent changes
in the material parameter a.
467
For
the assumption of
no
residual
stress,
it
can
be
seen
that
the
fatigue
resistance
of a
steel
weldment
continues to increase with increasing
Su
even
though the increase in
~f
due
to
the increase in
Su
is
partially
offset
by
a
larger
Kfmax·
Under
the assumption of
positive
residual
stresses
equal
to
the
base metal
yield
strength
(cr
= + S
),
the
fatigue
limit
is
no
longer a strong
function of
s but increasesronly
srightly
and
then, for the case considered,
decreases
wit~
increases in
Su
above
550
MPa.
Thus, increasing the strength (Su)
of
weldments
in the as-welded condition
may
actually
decrease
their
fatigue
strength
due
to the
combined
effects
of increasing
Kfmax
and
crr·
When
the
mean
stress
relaxes during cycling, the current value of
mean
stress
(a
0
)
may
be
estimated
by
(6):
where:
cro
(2Ni
-
l)k
0
os
cro
current
value
of
mean
stress,
0
os
initial
value of
mean
stress,
2Ni
elapsed
reversals,
and
k
relaxation
exponent
(a
function of
strain
amplitude).
Su
,
MPa
100 200
400
600
1000
200
400
IOOr-~~ ~~, +~~rrTr~ ,~~_,~;,
600
0
(f)
Fig. 6.
~-8
s~s
Ktmox
r
50
Su,
ksi
400
200
100
ct'
80
:::;:
60
cn°
40
20
10
Predicted influence of ultimate
strength
(Su)
on
the
fatigue
strength
of a
steel
butt
weld
at
106
cycles.
(8)
468
Assuming
that
the notch-root
strains
are
essentially
elastic
(2N
1
> 2Ntr) the
damage
per cycle
is:
1
2Ni
(9)
Using
the Palmgren-Miner rule of cumulative
damage
and
Eqs.
8
and
9,
the
fatigue
crack
initiation
life
under conditions of relaxing
mean
stress
can
be
calculated
by
integrating
the equation
below
using approximate
methods
(6):
and
solving for the upper
limit
of
integration
1 1
(
::
r
(~
(
2N.
)k
)b
0
os
1
,
d(2N.)
of
1
1
Fig.
7.
Appearance
of
as-welded
weld
toe (above)
and
shot-peened
weld
toe(below)at 45x.
(Scanning
electron
microscope micrographs)
(10)
469
The
total
fatigue
life
{NT)
is
considered
to
be
the
sum
of the crack
initiation
life
and
the fatigue crack propagation
life
{Eq.
1).
When
initiation
occurs at
an
obvious defect
such
as a pore, slag pocket or
deep
notch, the
size
of the
initiated
crack length
(ai)
may
be
taken
as
the dimension of the
defect.
Thus,
the fatigue crack propagation
life
{Np}
may
be
calculated
taking the defect
size
as
ai
and
added
to the estimate of
NI
using
Eq.
3
(naturally
in the case of
serious defects
NI
may
be
rather
short)
to obtain
NT·
Problems
arise
in the
instance of
weld
aiscontinuities
such
as
weld
toes
which
are serious defects but
not
deep
notches.
In
this
case, the value of the
initiated
crack length
(ai)
is
not
clear.
It
has
been
past
practice
to
assume
arbitrarily
that
ai
was
.01-in.
regardless of the
stress
level or the material (2). Recent
work
by
Chen
(7}
has
provided
an
alternative
strategy
for the
definition
of
ai.
For
fatigue
failure
to
occur,
an
ai
just
greater
than the length of a non-propagating crack (ath)
must
be
provided
by
the process of fatigue crack
initiation.
Thus,
at
long
lives,
ai
should
be
just
a
little
larger
than
ath·
INFLUENCE
OF
SHOT
PEENING
ON
THE
FATIGUE
LIFE
OF
WELDMENTS
The
analytical
model
discussed in the previous section provides a
means
of
exploring
ways
to
improve
the fatigue
resistance
of weldments. Since the
fatigue
crack
initiation
life
{NI}
dominates
at
long
lives
for
low
Kt
notches
such
as
weld
toes,
the long
life
fatigue
resistance
of
weldments
can
be
improved
principally
by
increasing
NI,
that
is
by:
reducing the
severity
of the
critical
notch
(i.e.,
reducing
Kf
to
va
1
ues
1 ess than
Kfmax
or reducing the abso 1 ute
va
1
ue
of
Kfmax
through the production of
less
severe
weldment
shapes);
by
controlling
resldual
stresses;
and
by
improving material
properties.
Thus
reducing the height of the
weld
crown
(e = 45°+15°) should increase the
fatigue
strength
from
0 +A in Fig.
6.
Stress
relief
(o =
+S
+
0}
should increase the fatigue
strength
from
0 +
B.
Over-sfressi~g
in tension should induce compressive
residuals
(or=
+S
+-
S)
and
increase the
fatigue
strength as
much
as
from
0 +
C,
while shot
~eening
should increase the strength of the material in the
region of
fatigue
crack
initiation
and
induce very large compressive residual
stresses
and
thus
result
in the
largest
of the
above
improvements, 0 +
D.
To
apply the
analytical
model
for
weldment
fatigue
life
it
is
assumed
that
the
Kfma~
condition occurs for shot-peened weldments. Scanning
electron
microscope
exam1nations of the
peened
weld
toes
have
shown
that
the
peened
surfaces are very
rough
and
consist
of overlapping shot impact
craters:
see Fig. 7.
The
values of
the compressive residual
stresses
induced
by
shot peening
have
been
measured
(8}
and
found
to
be
a function of the
initial
hardness of the
peened
metal {Fig. 8}.
The
fatigue
properties
of'
b
and
k
were
estimated
from
the hardness of the peened
material
at
the
weld
toe
at
a depth of
200
~m:
see Figs. 4
and
9.
FATIGUE
TESTS
ON
SHOT-PEENED
ASTM-A514
WELDMENTS
ASTM-A514
structural
steel
weldments
were
fabricated
for a study of the
effects
of
shot peening
on
fatigue
resistance.
The
material
properties
are given in Tables
1, 2,
and
3.
The
A514
steel
plates
were
ground
to
remove
mill
scale.
Bead-on
plate
weldments
were
fabricated
by
depositing a
weld
bead
on
one
side of a
steel
plate
using a semi-automatic
GMA
welding apparatus (process parameters are given
in
Table
4).
Shot peening
was
performed
on
these
weldments
prior
to
final
machining. Test pieces
were
saw-cut
from
the
welded
and
post-welded
treated
plates
and
machined
to dimensions
shown
in Fig. 10. Shot peening of the
weld
toe
region
was
performed
by
a local shot peening
company.
Total peening coverage
was
insured
by
Peenscan {8}.
All
process parameters suggested
by
the shot peening
company
are
listed
in Table 5.
470
UTS(MPol
1000 1500
2000
-150r r : _;,:;_;:-: =: ;.:: ;
1000
0
"'
Q_
""'
:::;:
-
"'
900
.;
"'
!
"'
~
(f)
(j,
0
0
::>
"0
::>
·u;
"0
"'
·u;
0::
"'
0::
><
x
0
0
:::;:
800
:::;:
•100
700
100
200
300
UTS (ksi l
17
34
43
50
57
Rc
Fig. 8. Relationship between ultimate
strength
and
max-
imum
residual
stress
induced
by
shot peening
(8).
TABLE
1
Chemical
Compositions of
Base
Metal
and
Welding
Electrode
Base
Metal
Weldin9
Elect rode
Element
(%)
A514*
EllO*
Mn
.82 1.70
p
.012 .005
s
.019 .009
Si
.23 .46
Cu
.27
Ni
.76 2.40
Cr
.54
.05
Mo
.47
.50
v .06 .02
B
.004
A1
.003
Ti
.025
*Ladle compositions supplied
by
the manufacturers
471
TABLE
2 Mechanical
Proeerties
of Base,
Weld,
and
Heat-Affected Materials
Material
A514-BM
A514-HAZ
EllO-WM
Hardness,
DPH/BHN
320/303
496/461 382/362
Modulus
of
Elasticity,
E
(MPa)
209,000 209,000
209,000
0.2%
Offset Yield Strength,
(MPa)
889
1179
834
Ultimate Tensile
Strength,
Su
(MPa)
938
1407
1034
Percent Reduction in Area,
%RA
63.0 52.7 57.6
True
Fracture
Strength,
crf
(MPa)*
1489/1269 2248/1986 2206/1910
True
Fracture
Ductility,
e:f
0.994
0.750 0.857
Strain
Hardening Exponent, n
0.994 0.092 0.092
Strength
Coefficient,
K
(MPa)
1186
2210
1558
*The
first
value
is
the load
just
before
it
is
suddenly decreased
prior
to
fracture
divided
by
the final area of the
fracture
specimen.
The
second value
is
corrected for
triaxial
stress
due
to
necking
as
proposed
by
Bridgmen.
TABLE
3 Cyclic
and
Fatigue
Proeerties
of Base,
Weld,
and
Heat-Affected Materials
Material:
Cyclic Yield
Strength,
0.2%
(MPa)
Cyclic
Strain
Hardening Exponent, n'
Cyclic Strength
Coefficient,
K'
(MPa)
Fatigue Strength
Coefficient,
crf(MPa)
Fatigue
Ductility
Coefficient,
e:f
Fatigue Strength Exponent, b
Fatigue
Ductility
Exponent, c
Transition Fatigue
Life,
2Nt
TABLE
4
Parameter
Plate
Thickness
(mm)
Electrode Diameter
(mm)
Voltage
(V)
Current
(amps)
Travel
Speed
(mpm)
Preheat
Temp
(°C)
Heat, Input
(kJ/mm)
Shielding
Gas
A514-BM
A514-HAZ
E110-WM(1P)
604
938
649
0.091 0.103 0.177
1089
1765
2020
1303
1999
1889
0.975 0.783 0.848
-0.079 -0.087
-0.115
-0.699
-0.713 -0.734
346
1138 1536
Welding
Parameters
Welding
12.7
1.59
30
290
0.43
96
1.2
Ar-2%
o
2
TABLE
5
Air
jet
nozzle
size
mm
Shot
nozzle size
(mm)
Angle
of
impingement
Air pressure
(MPa)
Length
of cycle
(mm)
Cycle time
(min)
Shot
size
(mm)
472
Parameters
6.35
12.7
45°
0.55 ± 0.07
100
5
0.84
*Recommended
and
performed
by
commercial
shot peening
company
Two
Micro-Measurements
strain
gauges
(6.3
mm,
120
Q)
were
attached
to
both sides
of
each
specimen to monitor bending
stresses.
A proper distance
from
the
weld
toe
to
the
strain
gauges
was
maintained to guarantee
that
the monitored
strains
would
be
independent of the
weld
toe
stress
concentration
and
would
approximate the
nominal
surface
strain.
Specimens
were
fatigue
tested
in a
100
kip
MTS
machine
under load control
(R=O)
at
5Hz.
The
bending
strain
due
to nominally axial loading
was
measured
under small
axial loads
prior
to
cycling
and
any
bending
strain
was
reduced
by
forcing the
grips
and
specimens into alignment through
minor
grip adjustments.
In
this
manner, the bending
stresses
were
reduced
to
less
than
2%
of the axial
stresses.
The
fatigue
test
results
of
treated
A514/E110
weldments
are
shown
in Fig. 11.
Regions
of
interest
were
examined
with
SEM
and
optical microscope
to
characterize
microstructures, toe geometries,
and
crack
initiation
sites.
Micro-hardness
traverse
were
performed
on
several of the
peened
weldments
(Fig.
9).
Peening
produced
no
observable changes in the microstructure but induced a great increase
in hardness
at
approximately
500
vm
below
the surface.
SEM
investigations
of
weld
toes
showed
sufficient
surface
discontinuities
to use the
Kf(max)
condition
for
all
cases (Fig.
7).
Fatigue
failures
initiated
at
the original
weld
toes.
z
>
I
300-
200
0
TOE
\
\
500
\
\
\
1000
As-Welded
Shot-
Peened
Shot-
Peened
(Cycled)
__
,
1500
2000
2500
3000
Distance (p.m)
Fig. 9. Vickers hardness
(VHN)
inward
from
the
weld
toe
for
as-welded
and
(cycled
and
uncycled) shot-peened specimens.
473
A comparison of the experimental
results
and
predictions of the
effects
of shot
peening
on
the fatigue
resistance
of
ASTM
A514
weldments
using Eqs. 1
and
10
is
given in Fig. 11.
The
predicted
lives
of the shot-peened
and
as-welded specimens
agree well with the experimental observations.
THE
CONCEPT
OF
MAXIMUM
RECOVERABLE
LIFE
The
maximum
possible
improvement
in
weldment
fatigue
life
(maximum
recoverable
life
or
MRL)
can
be
predicted using the
analytical
model
discussed
(Eq.
3):
~
[
when:
p w
2NI,
2NI
p w
Kf'
Kf
,p
,w
of
'
of
p
w
oo
'
oo
bp.
bw
t::.S
1
p
]-
t::.S
Kf
bp
( I p
p)
0
f -
0
o
w
1
t::.S
Kf
J
bw
2
(of
W -
o~)
Initiation
life
of plain
plate
and
weldment,
respectively,
( 11)
Fatigue notch
factor
for plain
plate
and
weldment,
respectively,
Fatigue strength
coefficient
for plain
plate
and
weldment
HAZ,
(after
post
weld
treatment)
respectively,
Mean
stress
for plane
plate
and
weld
toe,
respectively,
Fatigue strength exponent for
~lane
plate
and
weldment
HAZ,
respectively,
and
Remote
stress
range.
The
maximum
recoverable
life
(MRL)
is:
p w p w
MRL
=
2NI
-
2NI
~
2NT
-
2NT
(12)
Assuming
b =
bw,
the best possible
weldment
performance will occur
when
the
maximum
re@overable
life
is
reduced to zero through manipulation of o
0
(i.e.,
or)'
Kf,
or
of'
For
this
condition:
K
W
,w
w
f
<
of
-
oo
(13)
?
,P
p
f
of
-
oo
Now
p
K p
so
and
oo
f
<f>
-"
(f)
<l
"'
0>
c
0
0::
<f>
<f>
"'
(f)
474
2"
Radius
50.8mm
~~ ~::;;:
__
14_"
1
355.6mm
0.5"
12.7mm'1
10.5"
, , <91P4:~ , ,, ~
"\_Stram
Gauges
12
·
7
mm
Fig. 10. Dimensions of specimens
for
fatigue
testing
of
as-welded
and
shot-peened bead-on-plate weldments.
100
80
60
40
20
10
4
10
A514/
EIIO
Butt
Weld
R=O
t=l2.7mm(l/2inl
o-
AW
(G",
= +
Sy
ksi
l K
1
m=
3.13
4>
=9o•
e
=45•
D TD
(G",
= + Sy
ksil
-0-
S P
(G",
=-
Sy
ksi l Ktm=3.30
p p
(G",
= 0 l
::: ::::
Ur~-:: ::,.= ~-
DO
IT =:
5
10
6
10
Reversals
Ta
Failure ,
2N
1
o::-
1000
cE
800
:::'<
600
~
400
"'
0>
c
0
0::
"'
"'
200
1:
7
10
100
(j,
Fig. 11. Total
fatigue
life
predictions
for shot-peened
and
as-welded
ASTM
A514/Ell0 bead-on-plate weldments together with experimental
re-
sults
for
T.I.G. dressed,shot-peened
and
as-welded bead-on-plate
weldments.
w
(14)
~1here:
S
0
remotely applied
mean
stress
and
475
weld
toe residual
stress.
Therefore, Equations
13
and
14
result
in:
K/
<
crfW_
crr
K p
,P-
f
0
f
(15)
Equation
15
shows
the
quantitative
relation
between
the
three
controllable
factors
for completely regaining the recoverable fatigue
life
(MRL
=
0)
and
implies
that
recovery
does
not
depend
on
stress
range
(6S)
or R
(=
Smi
/Smax)
ratio,
but
strongly depends
on
the
factors
of geometry (Kf),
residua~
stress
(crr)
and
material property (crf).
If
Eq.
15
is
applied
t~
several
~ost-weld
treatment~
fo~
improving
weld
fatigue
life,
assuming
that
cr'
"
1.
5
crf:
, the ranges of
Kf
/Kf
which
will permit the
maximum
possible
imprbvement
in
weldment
fatigue
l1fe are given in the
table
below:
TABLE
6 Estimated Effect of Post
Weld
Treatments
Treatment
crr
Range
of
K~/K~
for
MRL
= 0
stress
relief
0
1
+ 1.5
SUBM
over
stressing
-Sy
"'-
-2-
1
+ 2
reduction in
Kf
Sy
SUBM
1+
-2-
shot-peening
-0.5
.w
1 + 3
(Jf
The
fatigue notch
factor
(Kf)
can
be
rQduced
to
values
less
than
Kfmax
by
laspr
or
TIG
dressing
which
treatments
makes
Kf
at the
new
toe nearly
equa
to the
Kf
and
thereby give complete recovery. Shot-peening
is
particularly
effective
in
incre~sin~
the fatigue
life
of a
weldment
up
to
its
plain
plate
life
for
ratios
of
Kf
/Kf in the range 1
to
approximately 3.
ACKNOWLEDGEMENTS
This study
was
principally
supported
by
the University of
Illinois
Fracture
Control
Program
which
is
funded
by
a consortium of
midwest
industries.
The
authors
wish
to thank Professor
JoDean
Morrow
of the Department of Theoretical
and
Applied
Mechanics
for his advice
and
help
and
Patrick
Murzyn
for his help in
the experimental portions of the study
and
for providing the
SEM
micrographs.
The
authors are
particularly
indebted to the
Metal
Improvement
Company
{Chicago
Division) for shot peening the
weldments
and
supplying a great deal of technical
information
on
the shot-peening process.
476
REFERENCES
1. Radziminski,
J.
B., Srinivansan, R.,
Moore,
D., Thrasher,
C.
and
W.
H.
Munse,
(1973). Structural Research Series
No.
405,
University of
Illinois
at U-C.,
Urbana,
IL.
2.
Lawrence,
F.
V.,
Jr.,
Mattos,
R.
J.,
Higashida,
Y.
and
J.
D.
Burke
(1978).
ASTM
STP,
648,
134-158.
3. Higashida,
Y.,
Burk,
J.
D.
and
F.
V.
Lawrence,
Jr.
(1978). Strain-Controlled
Fatigue Behavior of a
STM
A36
and
A514
Grade
F Steels
and
5083-0
Aluminum
Weld
Materials.
Welding
Journal, 57, 334s-344s.
4. Basquin,
0.
H.
(1910).
The
Exponential
Law
of
Endurance
Tests. Proc.
ASTM,
10,
625.
5.
Lawrence,
F.
V.
Ho,
N-J,
and
P.
K.
Mazumdar
(1981). Predicting the Fatigue
Reistance of
Welds.
Ann.
Rev.
Material
Sci.,
11, 401-425.
6.
Burk,
J.
D.
and
F.
V.
Lawrence,
Jr.
{1978). Fracture Control
Program
Report
No.
29,
University
of
Illinois
at
Champaign-Urbana,
Urbana, IL.
7.
Chen,T
C.
and
F.
V.
Lawrence,
Jr.
(1979). Fracture Control
Program
Report
No.
32, University of
Illinois
at
Urbana-Champaign,
Urbana, IL.
8.
ShOfl>eening Applications (1980), 6th
ed.,
Metal
Improvement
Co., Inc.
Paramus,
NJ.