determination of methanol and ethanol
Bạn đang xem bản rút gọn của tài liệu. Xem và tải ngay bản đầy đủ của tài liệu tại đây (400.6 KB, 8 trang )
Talanta 49 (1999) 245–252
Determination of methanol and ethanol by gas
chromatrography following air sampling onto florisil
cartridges and their concentrations at urban sites in the
three largest cities in Brazil
Pedro Afonso de Paula Pereira, Eliane Teixeira Sousa Santos,
Tatiana de Freitas Ferreira, Jailson B. de Andrade *
Instituto de Quı´mica, Uni6ersidade Federal da Bahia, Campus Uni6ersita´rio de Ondina,
40
.
170
-
290
, Sal6ador, Bahia, Brazil
Received 23 February 1998; received in revised form 30 September 1998; accepted 5 October 1998
Abstract
A new sampling protocol was developed to determine methanol and ethanol in the gas phase, at low concentration
levels, in urban atmospheres. The procedure involves collection of air samples (20.0 –30.0 l) with three florisil
cartridges connected in series, at a flow rate ranging from 1.0 to 2.0 l min
−1
and subsequent elution of the alcohols
with water. Separation and quantification were done by gas chromatography (GC) coupled with a flame ionization
detector, ‘SPI’ injector and column DB WAX (30 m ×0.53 mm×1 mm). The minimum mass detected by the method,
based on two times the average background mass on the blank cartridges, was 0.3 mg for both alcohols which, for
a sampled volume of 30 l, resulted in detection limits of 7.6 and 5.3 ppbV for methanol and ethanol, respectively. The
determined alcohol concentrations, in 42 different samples from the three largest cities in Brazil—Sa˜o Paulo, Rio de
Janeiro and Salvador —ranged from 72 ppbV to below the detection limit for methanol and from 355 to 12 ppbV for
ethanol. © 1999 Elsevier Science B.V. All rights reserved.
Keywords
:
Atmospheric methanol; Atmospheric ethanol; Sampling
1. Introduction
In the last two decades, the use of oxygenated
fuels, like methanol and ethanol, pure or mixed
with gasoline, has been growing due to the
benefits of improved air quality and also for
economic reasons. In Brazil, the number of light
duty vehicles powered by pure hydrated ethanol is
estimated at about 4 million [1–3], while the
remaining vehicles actually utilize a mixture
(22:78 v/v) of ethanol:gasoline. This results in an
increase of alcohol emissions to the atmosphere in
at least two ways: evaporation and as unburned
fuel. Therefore, there is a need for the develop-
ment of analytical procedures to determine these
* Corresponding author. Fax: +55-71-2375524.
E-mail address
:
(J.B. de Andrade)
0039-9140/99/$ - see front matter © 1999 Elsevier Science B.V. All rights reserved.
PII: S0039-9140(98)00376-2
P.A. de Paula Pereira et al.
/
Talanta
49 (1999) 245 – 252
246
compounds in the atmosphere, at low concentra-
tion levels, in order to permit an evaluation of
possible impacts from their emissions on forma-
tion of chemical species in the atmosphere, such
as ozone, aldehydes, carboxylic acids and other
photochemical oxidants [4,5]. Unfortunately,
there is very little information in the literature
regarding analytical protocols for alcohol sam-
pling at low concentration levels. Due to these
low concentrations, the air volumes required to
determine, in a quantitative way, the atmospheric
levels of methanol and ethanol, are frequently in
the range of several liters. Classical sample collec-
tion into glass impingers containing water is
difficult and troublesome for handling during field
campaigns, while the commonly used solid sor-
bents present very low breakthrough volumes for
both compounds [6]. In fact, most of the analyti-
cal methods reported were developed for alcohol
determination in vehicle exhaust [7– 10] or alco-
holic beverages [11 –18]. In both cases the deter-
minations involve high concentration levels.
The present work compares the use of water
and three solid sorbents (silica, basic alumina and
florisil) in terms of efficiency of collection for
atmospheric methanol and ethanol, taking into
account the breakthrough volumes for each.
Florisil cartridges showed, among the collection
media evaluated, the best mean results for
methanol and ethanol sampling. Thus, this system
was tested in real sites, by means of atmospheric
determination of ethanol and methanol in urban
places in Rio de Janeiro, Sa˜o Paulo and Salvador.
The first results of alcohol concentrations in these
cities are reported here
2. Experimental
2
.
1
. Material
The following were used: Tedlar and Teflon
bags (80 l; BGI); Teflon chamber, transparent to
sunlight, (3.5 m
3
); flowmeters; SEP-PAK (Mil-
lipore) solid sorbent cartridges: silica (80 mm ×
690 mg×30 mm×9 mm i.d.), alumina (175
mm× 1850 mg× 27 mm× 9 mm i.d.) and florisil
(125 mm×900 mg×24 mm× 9 mm i.d.)); glass
impinger; Teflon and silicone tubes; ethanol,
methanol and acetonitrile, analytical grade
(Merck); water, distilled and further purified in an
E-Pure (Altech) system; and ‘zero’ gases (nitro-
gen, air, helium).
2
.
2
. Equipment
The following were used: gas chromatograph
(Varian 3400), equipped with flame ionization
detector and ‘SPI’ injector; DB WAX column (30
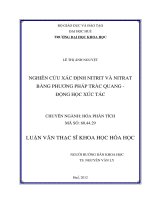
Fig. 1. Chromatograms for methanol and ethanol determina-
tions from: (a) a standard dilution; and (b) a sample collected
on florisil cartridge.
P.A. de Paula Pereira et al.
/
Talanta
49 (1999) 245 – 252
247
Table 1
Calibration curves for GC determination of methanol and
ethanol [H=aC+b]
a
br
2
Alcohol a (l mg
−1
)
3.952666Methanol 0.9992
1938 3.5 0.9998Ethanol
a
a, slope (l mg
−1
); b, intercept; C, concentration (mg l
−1
);
H, peak height; r
2
=correlation coefficient.
limits of 7.6 and 5.3 ppbV for methanol and
ethanol, respectively.
All cartridges, prior sampling, were pre-condi-
tioned by elution with water (5 ml) and acetoni-
trile (MeCN) (5 ml), followed by partial dryness
passing helium or nitrogen throughout. Methanol
(MeOH) and ethanol (EtOH) standard atmo-
spheres were obtained by injection, with a mi-
crosyringe, into the bags, of known amounts (1 or
10 ml) of the respective alcohol using a ‘zero’ air
flux as carrier gas (2.0–3.0 l min
−1
), which, in
turn, was used to fill the bag with specific air
volumes ( 70 l for small bags and 1000– 2000 l
for Teflon chamber). The exact concentration of
methanol or ethanol, in each experiment, was
determined taking into account the mass of alco-
hol put into the bag and the air volume used in
dilution.
2
.
4
. Breakthrough tests
For breakthrough tests, a known amount (6.8
mg) of MeOH or EtOH was collected on columns
or impingers containing purified water, by means
of a fixed volume (0.60 l) of standard atmosphere
withdrawn from the Tedlar bag. Then, the
columns or impingers were exposed to a ‘zero’ air
flow, at1lmin
−1
, for variable periods, ranging
from 0 to 75 min, one column or impinger for
each time period. The air flow rate was controlled
by a mass flowmeter, which was previously cali-
brated against a standard. After this time passing
‘zero’ air throughout, the column was eluted with
5 ml of water to a volumetric flask (10 ml) and the
volume taken up. A 1.0-ml aliquot of this solution
was injected and analyzed by GC. When using
water as collection medium, an aliquot (1 ml) of
the total volume (10 ml) was directly injected into
the chromatograph immediately after each period
passing ‘zero’ air. The scheme for alcohol sam-
pling from the bag is shown in Fig. 2.
2
.
5
. Samplings from bags, indoor, outdoor and
urban atmospheric air
Samples were collected from Teflon bags (80 l)
and Teflon chamber (3.5 m
3
), with concentrations
ranging from 15 to 74 ppbV for methanol and
m× 0.53 mm×1 mm); Zero air supplier model
111 (Thermo Environmental); and vacuum pump.
Analysis were carried out according to the fol-
lowing conditions:
column oven: 45°C (1 min.) 75°C (5°C
min
−1
) 120°C (15°C min
−1
) 120°C (1 min)
injector: 150°C
FID detector: 200°C; sensib.: 10
−12
AFS;
atenn.: 2
carrier gas: helium (: 5mlmin
−1
).
The GC analysis was completed in about 12
min. Typical chromatograms, for standard and
sample, are shown in Fig. 1.
2
.
3
. Procedure
Analytical curves for methanol and ethanol
were done using external standards, ranging from
0 to 5.0 mg l
−1
, prepared by dilution of a stock
solution in purified water. Injections of 1.0 ml
were made in the chromatographic system and the
peak heights of methanol and ethanol determined.
The analytical curves presented good linearity and
correlation coefficients (r
2
) in the order of 0.998,
as shown in Table 1. The minimum mass detected
by the method, based on two times the average
background mass of alcohol on the blank car-
tridges, was 0.3 mg for both alcohols which, for a
sampled volume of 30 l, resulted in detection
Fig. 2. Scheme for alcohol sampling from bag.
P.A. de Paula Pereira et al.
/
Talanta
49 (1999) 245 – 252
248
Fig. 3. Ethanol fraction still retained, as function of the sampling system and zero air volume through it.
from 10 to 51 ppbV for ethanol, from two sites
inside the laboratory, outside the building of the
Institute of Chemistry, and at urban sites in Sal-
vador, Rio de Janeiro and Sa˜o Paulo. The flow
rates ranged from 1.0 to 2.0 l min
−1
and final
volumes from 30.0 to 60.0 l for samples collected
from bags, inside and outside the laboratory,
while for urban atmospheric samples final vol-
umes were 20.0 or 30.0 l. In all cases, three
cartridges connected in series were used. The air
flow rate was controlled in the same way as
described above. The cartridges were then eluted
with 3 ml of water to a volumetric flask. The
volume of water used for elution was set at this
time at 3 ml in order to exceed the hold-up
volumes of cartridges (between 1.6 and 1.8 ml),
and give a maximum sensitivity to detector re-
sponses. The efficiency of recovery for the com-
pounds was checked by a second elution (3 ml)
over 10% of each sample lot. A 1.0-ml aliquot of
the solution was injected and analyzed by GC.
The interior of the laboratory and urban sites
which were studied, are briefly described below.
2
.
5
.
1
. Laboratory
The facilities of our research group, a set of
three rooms with a total area of around 120 m
2
,
consist of an instrumental lab, a sample treatment
lab and a third room for offices and computers.
2
.
5
.
2
. Garibaldi A6.
(
Sal6ador
)
This avenue, close to a car park of the univer-
sity, has six traffic lanes (three in each direction)
and near the sampling site is heavily occupied by
commercial buildings and medical facilities. The
sea is about 1 km away. Samples were collected
1.0 m above the ground.
2
.
5
.
3
. Muniz Barreto St.
(
Rio de Janeiro
)
This is a secondary way that connects Praia de
Botafogo and S. Clemente St. It has two traffic
lanes in a single direction and near the sampling
site has many residential and commercial build-
ings, as well as schools and clinical offices. The
Botafogo beach—inside Guanabara’s bay—is
nearly 200 m away. Samples were collected 1.0
m above the ground.
P.A. de Paula Pereira et al.
/
Talanta
49 (1999) 245 – 252
249
2
.
5
.
4
. Rebouc¸as A6.
(
Sa˜o Paulo
)
Located at Pinheiros, this avenue has six
traffic lanes (three in each direction) and near
the sampling site has residential, and commercial
buildings and restaurants. The samples were
taken from the 9th floor (: 30 m above ground
level) of a residential flat.
3. Results and discussion
For a given compound, the breakthrough vol-
ume is defined as the volume of air or carrier
gas, by unit mass of the sorbent, for which the
compound retained into the sorbent cartridge
begins to migrate away from it. This migration
is a consequence of its partition equilibrium, be-
tween solid and gas phases, and is a function of
sorbent and compound type, the compound con-
centration in the sample, the sampling tempera-
ture, the humidity of air, the air flow rate and
flow velocity and the presence of other contami-
nants that can interfere with sampling. Volatile
compounds, in general, have low breakthrough
volumes [6,10].
The breakthrough tests with water, silica, basic
alumina and florisil short columns were con-
ducted in accordance with the experimental proce-
dures previously described. The choice of the
sorbents was based on their polarity, high activity
grade and basic surface (basic alumina and
florisil), which could enhance the interaction with
alcohol molecules through the H atom in the OH
group. The tests results are shown in Figs. 3 and
4, where a lack of data means that the experiment
was not performed for that sampling media in
that volume. For methanol (Fig. 4), neither of the
three sorbents could retain its total mass for air
volumes near to 15 l. At this volume, the relative
mass of methanol that still remained in the florisil
column (the sorbent showing the best results) was
only 80% of the original. Silica and alumina pre-
sented lower performances than florisil. With 30 l
of air passing through the column, mass still
retained on these sorbents dropped drastically to
a fraction equal to or below 20%. Water, on the
other hand, still retained 52% of the original mass
of methanol for an air volume of 60 l, while for
florisil no methanol was detected at this volume.
For ethanol (Fig. 3), florisil short columns showed
Fig. 4. Methanol fraction still retained, as function of the sampling system and zero air volume through it.
P.A. de Paula Pereira et al.
/
Talanta
49 (1999) 245 – 252
250
Fig. 5. Number of experiments as function of methanol migration through the columns (total experiments=10).
the best results, being capable of retaining the
totality of the alcohol for air volumes up to 60 l,
and even 80% for 75 l. Florisil columns were then
selected for the subsequent studies described
below.
In order to evaluate the previously chosen sor-
bent, according to conditions closely related to
real atmosphere samplings, the next test was to
sample methanol or ethanol from larger air vol-
umes (30 –60 l) and concentrations near to the
ones expected in the air, collected from Teflon
bags (80 l) or Teflon chamber (3500 l), as de-
scribed in Section 2. During these tests (ten),
ethanol sampled was always observed in the first
column or, at worst, in the second (one case),
while for methanol, a significant number of exper-
iments (five) showed migration up to the third
column. These results are summarized in Figs. 5
and 6. Of the five experiments for which methanol
migrated up to the third column, three were done
with 60-l samplings at1lmin
−1
, one with 40 l at
1.4 l min
−1
and the other with 30 l at 1.8 l min
−1
.
In this way, the breakthrough values for methanol
in florisil cartridges seemed to be determined by
the flow velocity, once higher air volumes corre-
spond to lower flow rates and higher flow rates to
lower air volumes. Ethanol, on the other way,
seems to be indifferent to the flow rate and flow
velocity, at least at the range studied, which was
chosen to give shorter sampling periods. In this
way, to address a quantitative sampling for
methanol, it was necessary to collect lower air
volumes at lower flow rates, or to use more than
three columns, although the last alternative would
produce a high backpressure in the vacuum
pump.
Finally, the florisil cartridges were used in real
atmospheric samplings, as a mean to evaluate
possible interference from other air contaminants,
over retention of methanol and ethanol by the
sorbent. Results for concentrations of methanol
and ethanol, measured inside and outside the lab
and at urban sites, are given in Table 2.
In all samples collected, the mass of methanol
determined was predominantly at the third
column, showing a strong migration. As conse-
quence, results reported for this alcohol are only
estimates of concentrations.
For ethanol, although migration had also oc-
curred for 13% of the samples —probably due to
competition for active sites with water and other
organic compounds— the mass of this alcohol at
P.A. de Paula Pereira et al.
/
Talanta
49 (1999) 245 – 252
251
the third column, when present, was much lower
than at first and second columns, showing a
profile that makes it possible to predict that a
fourth column should have ethanol at blank levels
(: 0.3 mg). From the total of 53 samples, 52—or
98%— presented a quantitative retention for
ethanol in the three cartridges, thus making
florisil a good choice as a sorbent for its sampling
in atmospheric air, especially if one takes it into
account that common solid sorbents have very
low breakthrough volumes for these compounds.
Breakthrough volumes at 20°C, reported for 11
sorbents used to collect organic compounds in
atmospheric air [6,10,19] are in the range of
0.013– 3.30 l g
−1
for ethanol and 0.006–0.950 l
g
−1
for methanol. A unique exception was a
carbon based sorbent, named Carbosieve SIII
®
,
with reported values of 7.50 and 55.0 l g
−1
at
20°C for methanol and ethanol, respectively [6].
Nevertheless, no information was available about
water coadsorption interferences, a type of prob-
lem commonly associated with carbon based sor-
bents, as well as the efficiency of recovery of
alcohols by elution with water. At present, our
group have ordered this product and, as soon as
we get it, these tests will be carried out.
4. Conclusions
Among the collection media evaluated, florisil
showed, when sampling atmospheric methanol
and ethanol, the best results besides presenting
advantages including easy handling and field
transportation. The breakthrough volumes pre-
sented, mainly for ethanol, are at least one order
of magnitude higher than those for other common
sorbents used for atmospheric air sampling. This
is specially important if one considers the low
atmospheric concentrations of methanol and
ethanol.
The collection system chosen was then used for
sampling indoor and outdoor sites at the Institute
of Chemistry and urban sites in the three largest
cities of Brazil: Rio de Janeiro, Sa˜o Paulo and
Salvador. At these urban sites, methanol and
ethanol concentrations ranged, respectively, from
72 ppbV to below the detection limit, and from
355 to 12 ppbV. The largest mean concentration
was detected for ethanol in Rio de Janeiro,
namely 66.4 ppbV.
Samplings with florisil cartridges, followed by
quantitation with GC-FID, were quantitative for
ethanol in 52 of 53 collected samples. Meanwhile,
Fig. 6. Number of experiments as function of ethanol migration through the columns (total experiments=10).
P.A. de Paula Pereira et al.
/
Talanta
49 (1999) 245 – 252
252
Table 2
Concentration of methanol and ethanol at the indoor, outdoor and urban sites
Locale EtOH (ppbV)MeOH (ppbV)Number of
collected sam-
ples
Mean valueMaximum MinimumMinimumMaximum Mean value
valuevalue valuevalue
10.6768.6 271.2Inside the lab- 41.38.906 99.2
oratory
B7.6 B7.6 35.5 B5.3Outside the 17.905 B7.6
laboratory
21.3354.6 65.4Garibaldi Av. 9.8B7.621 25.4
(Salvador)
66.4154.2Muniz Barreto 12.512 25.4 B7.6 14.0
St. (Rio)
36.216.063.8Rebouc¸as Av. B7.6 19.609 72.5
(SP)
for methanol, the results are only an estimation of
the real concentrations. For this alcohol, quanti-
tative measurements should involve short volumes
and lower flow rates to avoid its strong migration
up to the third column.
Acknowledgements
The authors would like to thank Professor
J.O.N. Reis for reviewing this paper as well
as CAPES, CNPq and FINEP for financial sup-
port.
References
[1] A.H. Miguel, Environ. Sci. Technol. 25 (4) (1991)
590.
[2] A.H. Miguel, M.F. Andrade, J.B. de Andrade, Air pollu-
tion in large urban Brazilian centers, in: Proceedings of the
World Congress on Air Pollution in Developing Coun-
tries, San Jose, Costa Rica, 21–26 October, 1996.
[3] R.L. Tanner, A.H. Miguel, J.B. de Andrade, J.S. Gaf-
fney, G.E. Streit, Environ. Sci. Technol. 22 (9) (1988)
1026.
[4] S.M. Japar, T.J. Wallington, S.J. Rudy, T.Y. Chang,
Environ. Sci. Technol. 25 (1991) 415.
[5] D. Grosjean, J. Braz. Chem. Soc. 8 (4) (1997) 433.
[6] Scientific Instrument Services, Selection and Use of Ad-
sorbent Resins for Purge and Trap Thermal Desorption
Applications, March, 1995 Application Note No 32.
[7] F. Lipari, J. Chromatogr. 503 (1990) 51.
[8] J.W. Butler, P.D. Maker, T.J. Korniski, L.P. Haack, F.E.
McKelvy, A.D. Colvin, A System for On-Line Measure-
ment of Multicomponent Emissions and Engine Operating
Parameters, Society of Automotive Engineering, USA,
1985 Technical Paper Series No. 851657.
[9] C.A. Gierczak, J.M. Andino, J.W. Butler, G.A. Heiser, G.
Jesion, T.J. Korniski, FTIR: fundamentals and applica-
tions in the analysis of dilute vehicle exhaust, in: Proceed-
ings of the 1991 Society of Photo-Optical Instrumentation
Engineers Symposium on Laser Spectroscopy, 1991.
[10] V.G. Berezkin, Y.S. Drugov, Gas Chromatography in Air
Pollution Analysis. In: Journal of Chromatography Li-
brary, vol. 49, Elsevier, Germany, 1991, p. 46.
[11] P.J. Worsfold, J. Ruzicka, E.H. Hansen, Analyst 106
(1981) 1309.
[12] J. Mohns, W. Ku¨ nnecke, Anal. Chim. Acta 305 (1995)
241.
[13] F. La´zaro, M.D.L. de Castro, M. Valca´rcel, Anal. Chem.
59 (1987) 1859.
[14] M.J. Dennison, J.M. Hall, A.P.F. Turner, Analyst 121
(12) (1996) 1769.
[15] W.R. LaCourse, D.C. Johnson, M.A. Rey, W. Slingsby,
Anal. Chem. 63 (2) (1991) 134.
[16] I.G. Casella, Anal. Chim. Acta 311 (1995) 37.
[17] S.I. Montalvo, J.D. Ingle Jr., Talanta 40 (2) (1993) 167.
[18] A. Pe´rez-Ponce, S. Garrigues, M. de la Guardia, Analyst
121 (7) (1996) 923.
[19] A.R. Mastrogiacomo, E. Pierini, L. Sampaolo, Chro-
matographia 41 (9/10) (1995) 599.