An EQ‑5D‑5L Value Set for Vietnam
Bạn đang xem bản rút gọn của tài liệu. Xem và tải ngay bản đầy đủ của tài liệu tại đây (868.53 KB, 11 trang )
Quality of Life Research (2020) 29:1923–1933
/>
An EQ‑5D‑5L Value Set for Vietnam
Vu Quynh Mai1 · Sun Sun2,3 · Hoang Van Minh4 · Nan Luo5 · Kim Bao Giang6 · Lars Lindholm2 ·
Klas Goran Sahlen2
Accepted: 17 February 2020 / Published online: 27 March 2020
© The Author(s) 2020
Abstract
Purpose The objective of this study was to develop an EQ-5D-5L value set based on the health preferences of the general
adult population of Vietnam.
Methods The EQ-VT protocol version 2.1 was applied. Multi-stage stratified cluster sampling was employed to recruit a
nationally representative sample. Both composite time trade-off (C-TTO) and discrete choice experiment (DCE) methods were
used. Several modelling approaches were considered including hybrid; tobit; panel and heteroscedastic models. First, models
using C-TTO or DCE data were tested separately. Then possibility of combining the C-TTO and DCE data was examined.
Hybrid models were tested if it was sensible to combine both types of data. The best-performing model was selected based
on both the consistency of the results produced and the degree to which models used all the available data.
Results Data from 1200 respondents representing the general Vietnamese adult population were included in the analyses.
Only the DCE Logit model and the regular Hybrid model that uses all available data produced consistent results. As the
priority was to use all available data if possible, the hybrid model was selected to generate the Vietnamese value set. Mobility
had the largest effect on health state values, followed by pain/discomfort, usual activities, anxiety/depression and self-care.
The Vietnam values ranged from − 0.5115 to 1.
Conclusion This is the first value set for EQ-5D-5L based on social preferences obtained from a nationally representative
sample in Vietnam. The value set will likely play a key role in economic evaluations and health technology assessments in
Vietnam.
Keywords Value set · Utility · Generic measures · EQ-5D-5L
Introduction
Electronic supplementary material The online version of this
article (https://doi.org/10.1007/s11136-020-02469-7) contains
supplementary material, which is available to authorized users.
* Vu Quynh Mai
1
Center for Population Health Sciences, Hanoi University
of Public Health, Hanoi, Vietnam
2
Department of Epidemiology and Global Health, Umeå
University, Umeå, Sweden
3
Research group Health Outcomes and Economic Evaluation,
Department of Learning, Informatics, Management
and Ethics, Karolinska Institutet, 171 77, Stockholm, Sweden
4
Hanoi University of Public Health, Hanoi, Vietnam
5
Saw Swee Hock School of Public Health, National University
of Singapore, Singapore, Singapore
6
Hanoi Medical University, Hanoi, Vietnam
Thanks in part to advances in medicine and public health,
Vietnamese people live longer, though clearly not all years
are spent in full health [1]. In such situations, a summary
measure, such as quality-adjusted life years (QALYs), which
combines both the quality (health status) and quantity (life
years) of health, can be a useful tool for decision-makers
involved in health technology assessment (HTA) [2, 3].
HTA guidelines are currently being developed for Vietnam
and, since 2018, the Ministry of Health has required HTA
to be performed for any new drugs intended for inclusion in
health insurance packages [4]. QALYs will be considered
an important HTA outcome in Vietnam, in line with HTA
guidelines in other countries [5].
To operationalize the QALY concept, a means of
assigning quality weights to the health states of interest is
required [6]. Two important issues need to be addressed
13
Vol.:(0123456789)
1924
when deriving such preference weights. The first is the
perspective of the valuation, i.e. whose value to use. Values can be obtained from patient groups (patient values)
or from representative samples of the general population
(social values) [7–10]. The second important issue is
which method to use. Methods commonly used to derive
preference weights for health states include time trade-off,
standard gamble and rating scales [6]. Recently, discrete
choice experiments have become an increasingly popular
means of generating such preference weights [11]. The use
of different valuation methods and perspectives will lead
to different values for health states.
Nevertheless, measuring preferences is a time-consuming and complex task. A widely used alternative is
to bypass the measurement task using pre-scored multiattribute health status classification systems [6]. The three
most commonly used systems are the Health Utility Index
(HUI), EQ-5D from the EuroQol Group and the Short
Form 6D (SF-6D) [6]. The EQ-5D instrument is a recommended method for deriving health state preference
weights in many countries, including Australia [12], the
UK [13] and several other European countries [14]. In
Vietnam, the EQ-5D and SF-6D are mostly applied relative to HUI, and it is likely that the EQ-5D instrument
will be recommended as the preferred preference-weighted
measure in the Vietnamese national HTA guidelines.
The EQ-5D instrument comprises a descriptive system
and a visual analogue scale (EQ-VAS). The descriptive
system classifies health on five dimensions: mobility,
self-care, usual activities, pain/discomfort and anxiety/
depression. Within each dimension, respondents are asked
to describe their current health using either three (no problems, some/moderate problems, extreme problems/unable
to/confined to bed) or five (no problems, slight problems,
moderate problems, severe problems and unable to/
extreme problems) levels of severity. This gives rise to
two different versions of EQ-5D labelled, respectively, the
EQ-5D-3L and the EQ-5D-5L. The EQ-VAS is common to
both versions of EQ-5D and is a hash-marked scale ranging from 0 to 100 where 0 represents the worst imaginable
health and 100 the best imaginable health. EQ-5D value
sets are sets of preference weights (or utilities) which can
be applied to all health states generated by a given version
of EQ-5D (EQ-5D-3L or EQ-5D-5L).
Though the EQ-5D-3L has been applied in economic
evaluations of healthcare services in Vietnam, i.e. people
with disability [15] and adolescent reproductive healthcare education [16], since the EQ-5D-5L was introduced
in 2012 it has been used more frequently, for example, in
studies of people living with HIV [17], the elderly [18],
people with non-communicable diseases [19, 20] and
young people suffering from internet addiction [21].
13
Quality of Life Research (2020) 29:1923–1933
Despite the increasing use of EQ-5D in Vietnam [22], no
population norm has been established, a country-specific
value set is still lacking and studies carried out to date have
had to use value sets from Korea [23], Thailand [24] or
China [25]. Although values sets from other countries can be
used in situations in which no national value set is available,
the availability and use of country-specific EQ-5D value sets
should be considered best practice in the future [26]. In light
of the development of national HTA guidelines for Vietnam,
there is a need for a country-specific EQ-5D value set. The
aim of this study is to derive a value set based on societal
preferences for EQ-5D-5L health states in Vietnam.
Methods
This study followed a standardized protocol developed by
the EuroQol Group (EQ-VT 2.1 in Vietnamese). Fieldwork
was conducted between 20 November and 25 December
2017. Trained interviewers carried out face-to-face interviews. Data upload and quality control (QC) were performed
daily.
Study population
Study participants were Vietnamese, over 18 years of age,
who were able to read and understand the study questions.
Participants were informed about the study and provided
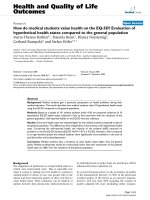
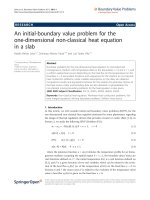
their written consent to participate. The study was conducted in six provinces, representing six different geographical regions (Northern mountains, the Red River delta, the
Highlands, Central Coast, the South-East and the Mekong
river delta). The sample size of the original study was 1200
participants, as per standardized protocol recommendations for the minimum sample size for a valuation study
[27, 28]. A multi-stage stratified cluster sampling method
was applied. Six provinces, one in each region, were purposefully selected to reflect the average socio-economic
level in the area. In the next stage, one urban and one rural
cluster were chosen randomly in each province. In the final
stage, respondents were recruited from relevant clusters
using a probabilistic quota-based method. The quota was
set for age groups (18–29 years, 30–44 years, 45–59 years
and 60 + years) and sex, based on the Vietnamese general
population structure in 2017 [29]. For details of the study
sampling frame, please refer to Table 1 in the online supplementary materials. Recruitment was at the level of households, using a door-to-door approach.
Valuation technique
Two valuation techniques were used to obtain health state
preferences: (1) composite time-trade-off (C-TTO), with
Quality of Life Research (2020) 29:1923–1933
Table 1 Study sample’s and
Vietnam general population’s
characteristics
1925
Variables
Socio-economic Regions
Central Highland
Mekong River Delta
Northern Midland and Mountainous
North Central and Central Coastal
Red River Delta
South-East
Residence
Urban
Rural
Age group
18–29
30–44
45–59
60 +
Gender
Male
Female
Marital status
Currently married
Others
Missing
Poverty
Poor and near poor**
Non-poor
Education status
Lower than primary school
Primary school
Completed secondary school
Completed high school
University and higher
Missing
EQ-5D-5L self-reported health
Perfect health
Problems at any level on Mobility
Problems at any level on Self-care
Problems at any level on Usual activities
Problems at any level on Pain/discomfort
Problems at any level on Anxiety/depression
Mean VAS (SD)
Study Sample
(n = 1200) n (%)
Vietnamese population*
(N = 92,695 Mio.) N (%)
80 (6.67)
230 (19.17)
146 (12.17)
259 (21.58)
270 (22.5)
215 (17.92)
5691 (6.14)
17,705 (19.10)
11,958 (12.89)
19,837 (21.39)
21,134 (22.79)
16,407 (17.69)
425 (35.42)
775 (64.58)
31,980 (34.50)
60,715 (65.50)
410 (34.17)
389 (32.42)
257 (21.42)
144 (12.00)
31,019 (33.46)
30,112 (32.49)
19,976 (21.55)
11,588 (12.50)
588 (49.00)
612 (51.00)
45,699 (49.30)
46,996 (50.70)
873 (72.75)
326 (27.17)
1 (0.08)
63,218 (68.20)
29,477 (31.80)
77 (6.42)
1123 (93.58)
6489 (7.00)
86,206 (93.00)
41 (3.42)
167 (13.92)
370 (30.83)
313 (26.08)
307 (25.58)
2 (0.17)
NA
NA
NA
NA
NA
652 (54.33)
116 (9.67)
21 (1.75)
57 (4.75)
412 (34.33)
235 (19.58)
81.08 (13.37)
NA
NA
NA
NA
NA
NA
NA
*Data from Vietnam General Statistic Book 2016; **Poverty level was based on Vietnam official poverty
line
an experimental design incorporating ten blocks of ten
health states each, and (2) discrete choice experiments
(DCE), in which the experimental design comprised 28
blocks of seven pairs each. Detailed descriptions of the
valuation protocol can be found elsewhere [27]. The
C-TTO is different from the traditional time trade-off
method as the traders are given a lead time of ten more
years to trade if they decide that they would prefer to be
dead at the start of the trade-off process (the case of worse
than dead). Details of the two elicitation methods have
been published elsewhere [30–32].
13
1926
Quality control
Quality Control tool version 2.5, provided by the EuroQol
Group, was employed to mitigate the effect of interviewer
bias [31]. The QC tool flags interviews in which anomalies are detected, for example, interviews that are conducted
unrealistically fast, which do not introduce the “worse than
dead” case, or which show clear logical inconsistency. Interviewers with flagged interviews were re-trained and also
invited to observe and reflect on how their colleagues conducted the interviews. Daily discussions between supervisors and interviewers were conducted to bolster the quality
control process. In parallel, the research team communicated
twice weekly with the EuroQol Group’s scientific group to
discuss the QC reports.
Interviewer training
A two-stage interviewer training procedure was followed. In
the first stage, training for research team members was provided by the EuroQol Group following an existing training
protocol [27]. In the second stage, the trained research team
members provided training to twelve candidate interviewers based on the same protocol. The twelve candidates were
recruited from students who had recently graduated from the
Hanoi University of Public Health. The candidates practiced
interviewing each other during a class-based training session
and then performed real interviews during the pilot study
in the Duc Thang ward, an urban residential area near the
university. The quality of the pilot interviews was evaluated
using the QC tool. A meeting was held between candidates
and supervisors to obtain feedback and discuss difficulties
encountered during the interviews. After the pilot study, ten
interviewers were selected to participate in the fieldwork.
Quality of Life Research (2020) 29:1923–1933
study, the sensitiveness of the topic for both interviewers
and respondents became apparent. Interviewers were therefore directed to ask respondents how they thought someone like them (e.g. same age, sex, socio-economic status,
etc.) would trade-off time in the C-TTO tasks, instead of
the respondents being asked how they would trade-off time
themselves. Secondly, our observations from the pilot study
suggested that elderly people often felt tired after spending
a long time working at a screen in the C-TTO tasks (30 min
or more) and they did not completely focus on the next tasks.
Instead of carefully comparing the two given health states
to complete the DCE tasks, elderly respondents were likely
to provide random responses. To improving their concentration, a visual aid in the form of a coloured card was given
along with the original visualization of the DCE task on
the computer screen. The visual aid included five separate
pieces of rectangular paper, printed in five different shades
of yellow from lighter to darker according to five levels of
severity. Interviewers would use these cards to compare the
difference in the colours of options A and B of the pair. For
details of the coloured card, Fig. 1 in the online supplementary materials can be consulted.
Data analysis
Both descriptive statistics and modelling were conducted
using Stata software version 15 from the Stata Corporation [33]. Means, standard deviations and 95% confidence
intervals were used for continuous variables; frequencies
and percentages were used to describe categorical variables.
Data collection
The data collection form comprised four main sections.
Respondents first provided background demographic information before completing the EQ-5D-5L to provide information on their current health status. At this point, participants
were guided through five practice examples of the C-TTO
task before being asked to value their ten randomly ordered
EQ-5D-5L health states. Finally, they completed seven DCE
tasks. After completing the ten C-TTO valuations, participants were shown the rank ordering of those states based on
their responses to the task and any states they considered to
be disordered were flagged (feedback module).
We made some adjustments to the standard EQ-VT protocol to take account of specific circumstances for this type
of survey in Vietnam. Firstly, addressing questions directly
to someone in relation to illness or being dead in Vietnam
can be considered insensitive and, in fact, during the pilot
13
Fig. 1 Map indicating regions sample was drawn from for the EQ5D-5L valuation study in Vietnam
Quality of Life Research (2020) 29:1923–1933
Data modelling was developed by employing the utility decrement (disutility) as the dependent variable for the
C-TTO data and a binary variable 0/1 representing whether
state A was chosen vs. state B for the DCE data. We used
two sets of independent variables, known as regular dummies and incremental dummies. Both sets comprised
four levels to describe health (from “slight problems” to
“extreme/unable to do”) for each of the five health dimensions (mobility, self-care, usual activities, pain/discomfort
and anxiety/depression). The difference between both is that
while regular dummies represent movements from no problems to any other specific level, the incremental dummies
represent movements between consecutive levels.
The DCE design includes 10 pairs that are manually
added to the experimental design. Oppe and van Hout
described this as follows: “We wanted to make sure that 10
very mild pairs would be included in the DC design. Therefore, we fixed these 10, and generated the remaining 186
ones using a design algorithm” [28]. The problem occurs
when the observed choice probabilities for these 10 pairs are
extreme (> 85%). It tells the model that the distance between
the two health states is infinite, causing bias in the model
estimations. For this reason, we checked whether the probabilities of these 10 pairs were extreme and we excluded
these 10 pairs from our analysis if they were extreme.
Model construction
Several models were tested to take into account different
characteristics of the existing data, i.e. (1) the use of two
different valuation methods and the desire to maximize the
use of the available data led to the testing of hybrid models;
(2) because the composite TTO task does not allow for values lower than − 1 while, theoretically, they could be lower,
Tobit models were tested to account for the censored nature
of C-TTO data; (3) panel Tobit model (random intercepts
model) was tested because of the multiple responses from
the same respondent; (4) heteroscedastic models were tested
because variance can differ across health states. To compare
the C-TTO and DCE model results, the coefficients of the
DCE model were rescaled using the rescaling parameter of
the TTO model estimations [34]. Further details of the modelling approach are available elsewhere [35, 36].
Model selection
We first estimated separately an original Tobit, a heteroscedastic Tobit and a panel Tobit model using the C-TTO
data and a Logit model using the DCE data. Then we
checked whether it was sensible to combine the C-TTO and
DCE data using scatter plots to plot predictions of C-TTO
models versus predictions of the DCE Logit model. The
correlation between the rescaled DCE Logit model and
1927
the C-TTO models was tested prior to the hybrid model
construction. Next, we estimated hybrid models in case
that the presence of C-TTO and DCE data was feasible in
a single estimation. The selection of the best-performing
model was based on both the consistency of the results
produced (i.e. the model which minimized inconsistent
orderings or results in the final algorithm) and the degree
to which models used all the available data.
Results
Data cleaning
Of the 1299 individuals invited to participate, 64 declined
(4.9%) and 35 produced incomplete interviews (2.7%).
After excluding refusals, incomplete and pilot interviews,
data from 1200 respondents were included for analysis.
A total of 363 participants in our study had inconsistent
responses. However, after removing the flagged health
states in the feedback module, this number was reduced
to 245. This means that the feedback module was helpful
in our study for improving data quality. After checking the
observed choice probabilities, we found that the ten manually added DCE pairs had extreme choice probabilities in
some of them (see Table II in the supplementary materials). Thus, we excluded the ten pairs from the analysis.
Sample characteristics
Table 1 shows the study sample’s characteristics in comparison with the general population of Vietnam. Overall,
the study sample matched the structure of the Vietnamese general population on the variables being considered. Almost two-thirds of the sample lived in rural areas
(64.58%), which is similar to the national statistics. The
proportion of males and females was equally distributed and most of the participants were of working age
(18–49 years, 88%), which also matched the national population structure. In EQ-5D-5L, 54.33% of respondents
reported no problems on any dimension (i.e. were in health
state 11111). Respondents most often reported problems
in the pain/discomfort dimension (34.33% of the sample), followed by anxiety/depression (19.58%), mobility
(9.67%), usual activities (4.75%) and self-care (1.75%). Of
all respondents who had problems in any dimension (548
people), 93.07% of them were reported having “slight”
problems for at least one dimension. Only two individuals
(0.36% of respondents who had problems in any dimension) reported “extreme” problems on any dimension. The
mean VAS score was 81.08.
13
1928
Quality of Life Research (2020) 29:1923–1933
Model selection
Table 2 presents the incremental disutility predictions
from tested C-TTO models including the Tobit, heteroscedastic Tobit (hetTobit), Panel Tobit and the rescaled
DCE Logit models. None of the tested C-TTO models
generated consistent results. The disordered parameters
were reported at a moderate level on self-care for hetTobit. The Tobit and Panel Tobit produced two inconsistent
parameters at a moderate level of mobility and self-care.
In contrast, weights estimated using the DCE Logit model
were consistent.
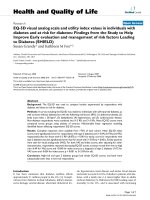
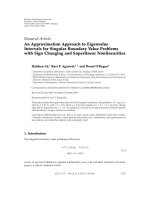
Figure 2 presents strong agreements between the
weights predicted by the DCE Logit model versus the
C-TTO regular Tobit and C-TTO hetTobit model, respectively. The high correlations thereby support the single
Table 2 Incremental disutility
predictions from the C-TTO and
DCE models
estimation [37]. Then, we constructed the regular censored
hybrid model (Hybrid model) and the censored hybrid heteroscedastic model.
The censored hybrid heteroscedastic model led to disordered parameters in some cases, whereas those parameters
produced by the Hybrid model were consistent. Thus, we
had to choose between the rescaled DCE Logit model or the
regular censored hybrid model that uses all available data.
As one of our priorities was to use all available data if possible, we selected the hybrid model as the best candidate for
generating the Vietnamese value set.
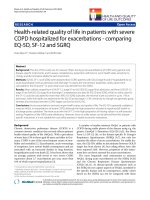
Figure 3 illustrates the matching between the observed
mean values (recorded from C-TTO tasks) and the corresponding DCE Logit model and Hybrid model for the set
of health states included in the TTO design. Both values
generated from the Hybrid and DCE model were strongly
Tobit (C-TTO)
Coeff
hetTobit (C-TTO)
P-value Coeff
Mobility (MO)
Disutility MO1–MO2
0.043 0.001
Disutility MO1–MO3 − 0.001 0.964
Disutility MO1–MO4
0.128 0.000
Disutility MO1–MO5
0.153 0.000
Self-care (SC)
Disutility SC1–SC2
0.071 0.000
Disutility SC1–SC3
− 0.001 0.958
Disutility SC1–SC4
0.093 0.000
Disutility SC1–SC5
0.096 0.000
Usual activity (UA)
Disutility UA1–UA2
0.064 0.000
Disutility UA1–UA3
0.017 0.212
Disutility UA1–UA4
0.103 0.000
Disutility UA1–UA5
0.109 0.000
Pain/Discomfort (PD)
Disutility PD1–PD2
0.066 0.000
Disutility PD1–PD3
0.066 0.000
Disutility PD1–PD4
0.149 0.000
Disutility PD1–PD5
0.117 0.000
Anxiety/depression (AD)
Disutility AD1–AD2
0.069 0.000
Disutility AD1–AD3
0.034 0.023
Disutility AD1–AD4
0.055 0.000
Disutility AD1–AD5
0.089 0.000
Utility for the worst
− 0.520
health state (55,555)
Panel Tobit
(C-TTO)
Logit (DCE)
P-value Coeff
P-value Coeff
P-value
0.052
0.004
0.130
0.132
0.000
0.779
0.000
0.000
0.035
− 0.006
0.141
0.155
0.000
0.611
0.000
0.000
0.087
0.013
0.131
0.168
0.000
0.218
0.000
0.000
0.080
− 0.010
0.092
0.091
0.000
0.403
0.000
0.000
0.062
− 0.003
0.109
0.088
0.000
0.817
0.000
0.000
0.021
0.009
0.106
0.083
0.069
0.423
0.000
0.000
0.076
0.008
0.118
0.079
0.000
0.484
0.000
0.000
0.059
0.019
0.095
0.121
0.000
0.089
0.000
0.000
0.045
0.006
0.126
0.125
0.000
0.581
0.000
0.000
0.076
0.049
0.143
0.146
0.000
0.001
0.000
0.000
0.058
0.068
0.154
0.114
0.000
0.000
0.000
0.000
0.101
0.059
0.110
0.093
0.000
0.000
0.000
0.000
0.068
0.028
0.064
0.080
− 0.509
0.000
0.028
0.000
0.000
0.063
0.029
0.062
0.087
−0.511
0.000
0.016
0.000
0.000
0.060
0.055
0.062
0.053
− 0.514
0.000
0.000
0.000
0.000
The coefficients shown in the table reported incremental dummies of each model. MO Mobility, SC
Self-care, UA Usual activities, PD Pain/discomfort, AD Anxiety/depression. MO1-AD1 = No problem;
MO2-AD2 = Slight problem; MO3-AD3 = Moderated problems; MO4-AD4 = Severe problems; MO5AD5 = Extreme problems. Bolded coefficients reported logical inconsistent. Coefficients in DCE model
were rescaled using C-TTO information to be anchor in the 0–1 scale
13
Quality of Life Research (2020) 29:1923–1933
1929
Fig. 2 Scatter plots of C-TTO vs DCE model predictions
correlated with the observed mean values. The values from
the Hybrid model, however, appeared to be slightly closer to
the observed mean values than those from the DCE model.
For details regarding the distribution and descriptive statistics of the observed mean C-TTO values, please refer to
Fig. 2 and Table 3, respectively, in the online supplementary
materials.
value of the health state 12345 is calculated as: 1—(MO1)—
(disutility SC1–SC2)—(disutility UA1–UA3)—(disutility
PD1–PD4)—(disutility AD1–AD5) = 1– (0) − (0.0428) −
(0.0587) − (0.2700) − (0.2388) = 0.3897. The value for the
second best health state (12,111) was 0.9573 and the value
for the worst health state (55,555) was − 0.5115.
Final model
Discussion
Table 3 shows the disutility coefficients from the Hybrid
model (final model). In terms of the predicted values for
3125 health states, the values ranged from 1 to − 0.5115. The
percentage of negative values in the selected value set was
8.3%. The largest disutility weights were observed for the
mobility dimension, ranging from 0.0692 for “slight problems” to 0.3761 for “unable to walk”. However, the disutility weights associated with pain/discomfort were of similar
importance (0.3666 for extreme problems). The smallest
disutility weights were in self-care (0.0428 for “slight problems” to 0.2311 for “unable to”), though disutility weights
in the anxiety/depression dimension were similar (0.2388 for
“extreme problems”). Disutility weights from this Hybrid
model were used to calculate values for all health states
in the Vietnamese EQ-5D-5L value set. For example, the
This study has provided a value set based on societal preferences for EQ-5D-5L health states in Vietnam. Values were
obtained from a nationally representative sample using
the latest version of EQ-VT. The value set can be used for
QALY calculations based on the EQ-5D-5L descriptive system and will be a useful tool for local policymakers and
HTA researchers.
As previously noted, to date, no national EQ-5D value
set was available for use in Vietnam. Previous studies using
EQ-5D in Vietnam had adopted value sets from Thailand
[24], Korea [23] or China [25]. However, such approaches
risk not reflecting actual health preference of the Vietnamese, as well as failing to have a standard EQ-5D value set
in Vietnam. In fact, the approach to modelling can vary
when developing national value sets. While Vietnam and
13
1930
Quality of Life Research (2020) 29:1923–1933
Fig. 3 Scatter plots of observed mean value vs DCE and Hybrid model predictions
Thailand used hybrid models to generate their final value
sets, in Korea and China, only TTO data were used in the
final models. Likewise, differences have been observed in
the values assigned to the worst health state (55555), ranging
from − 0.5115 in Vietnam to − 0.3910 in Thailand, − 0.4212
in China and − 0.066 in Korea [23–25].
Overall, the Vietnamese place the most weight on mobility and pain/discomfort dimension, which is in line with
other published EQ-5D-5L value sets in Asia [38]. When
dimensions are ranked according to the disutility corresponding to the level “unable to/extreme”, the Usual activities was ranked third in Vietnam, which means it is given
higher weight than in many other countries [38]. A possible explanation is that 57% of Vietnamese employees are
informal workers and have limited access to social welfare
[29]. Thus, experiencing problems performing usual activities may have a considerable impact on their ability to make
a living. Likewise, in contrast to Western countries such as
Ireland [39], the Netherlands [40], Germany [41] and the
UK [42], in which anxiety/depression was assigned the largest or second largest weight, it was only ranked fourth in
Vietnam. This is in line with studies from a number of other
Asian countries/regions such as Hong Kong [43], Indonesia
[44] and South Korea [23]. The difference could be due to
the fact that people in western countries are more aware of
13
mental health [45] and more likely to acknowledge anxiety/
depression as a health problem [46].
Differences such as these show why it is preferable for
Vietnam to have its own value set. Furthermore, the availability of a local, standardized national value set increases
the credibility of results obtained using EQ-5D-5L and of
the outcome of cost-effectiveness analysis using countryspecific data.
Due to the sensitivity of discussing “dead” in Vietnamese
culture, the “third person” approach was employed in the
C-TTO exercise. This created a comfortable environment
and helped establish a good relationship between interviewers and respondents, as well as reduce the risk of respondents abandoning the interview. On the other hand, it is not
clear how the use of the “third person” approach might affect
values and further research is necessary to explore this [47].
We decided that the most optimal method of estimating
a value set in Vietnam was via the hybrid model, which has
been adopted in many other countries [38]. An argument
for using the hybrid model is that combining the results
from the C-TTO and DCE exercises maximizes the use of
all available data. It has also been suggested that both TTO
and DCE tap into the same preference structure. Thus,
adding DCE responses could improve the ability to predict TTO responses [48]. However, the fact that they are
Quality of Life Research (2020) 29:1923–1933
Table 3 Disutility predictions
from the selected model (regular
censored Hybrid model)
1931
Incremental dummies
Mobility (MO)
Disutility MO1–MO2
Disutility MO2–MO3
Disutility MO3–MO4
Disutility MO4–MO5
Self-care (SC)
Disutility SC1–SC2
Disutility SC2–SC3
Disutility SC3–SC4
Disutility SC4–SC5
Usual activity (UA)
Disutility UA1–UA2
Disutility UA2–UA3
Disutility UA3–UA4
Disutility UA4–UA5
Pain/Discomfort (PD)
Disutility PD1–PD2
Disutility PD2–PD3
Disutility PD3–PD4
Disutility PD4–PD5
Anxiety/Depression (AD)
Disutility AD1–AD2
Disutility AD2–AD3
Disutility AD3–AD4
Disutility AD4–AD5
Utility value at health state:
11111 (full health)
12111 (second best health state)
11211
11112
21111
11121
55555 (the worst health state)
Regular dummies (Final model)
Coeff
P-values
SE
0.0692
0.0093
0.1279
0.1697
0.000
0.281
0.000
0.000
.0072
.0087
.0090
.0089
0.0428
0.0032
0.1012
0.0841
0.000
0.710
0.000
0.000
.0073
.0086
.0091
.0085
0.0464
0.0123
0.1148
0.1254
0.000
0.130
0.000
0.000
.0072
.0081
.0086
.0089
0.0839
0.0682
0.1179
0.0965
0.000
0.000
0.000
0.000
.0068
.0084
.0088
.0095
0.0638
0.0489
0.0588
0.0675
0.000
0.000
0.000
0.000
.0068
.0085
.0087
.0086
Mobility (MO)
Disutility MO1–MO2
Disutility MO1–MO3
Disutility MO1–MO4
Disutility MO1–MO5
Self-care (SC)
Disutility SC1–SC2
Disutility SC1–SC3
Disutility SC1–SC4
Disutility SC1–SC5
Usual activity (UA)
Disutility UA1–UA2
Disutility UA1–UA3
Disutility UA1–UA4
Disutility UA1–UA5
Pain/Discomfort (PD)
Disutility PD1–PD2
Disutility PD1–PD3
Disutility PD1–PD4
Disutility PD1–PD5
Anxiety/Depression (AD)
Disutility AD1–AD2
Disutility AD1–AD3
Disutility AD1–AD4
Disutility AD1–AD5
Coeff
SE
0.0692
0.0785
0.2064
0.3761
0.007
0.008
0.008
0.008
0.0428
0.0460
0.1470
0.2311
0.007
0.008
0.008
0.008
0.0464
0.0587
0.1735
0.2989
0.007
0.008
0.008
0.008
0.0839
0.1521
0.2700
0.3666
0.007
0.008
0.008
0.009
0.0638
0.1126
0.1713
0.2388
0.007
0.008
0.008
0.008
1
0.9573
0.9536
0.9362
0.9308
0.9161
− 0.5115
For instance, value of the health state 12345 is calculated as: 1 − (MO1) − (disutility SC1 − SC2) − (disutility
UA1 − UA3) − (disutility PD1 − PD4) − (disutility AD1 − AD5) = 1 − (0) − (0.0428) − (0.0587) − (0.2700) − (0
.2388) = 0.3897
very different valuation methods has led others to argue
that there is no robust theoretical justification for combining them in the same model [6]. Despite the controversy
of combining TTO and DCE data, Ramos-Goni and colleagues have supported the idea of integrating the two
types of data (hybrid approach) in developing models for
the EQ-5D-5L valuation studies in the case this approach
produces more precise estimates [37]. In the present study,
we preferred the regular censored hybrid model because
it provided consistent estimates and used both types of
available data, which were our priorities when choosing
between models.
There are some notes in the study. The first note is our
modification to the standard protocol for the EQ-5D-5L
valuation study. That may affect to any purpose of crosscountry comparison involving the Vietnam value set. Additionally, the use of DCE cards has not been systematically
recorded, which could potentially bias this study. Another
potential limitation of our study is the possibility of interviewer bias. Our efforts to reduce interviewer bias included
re-training and daily group discussions to help interviewers improve their interviewing skills. Also, the fact that the
C-TTO is a complicated exercise can lead interviewers to
focus on younger respondents because they find the task
13
1932
somewhat easier. The interviewer biases was avoided by
using the QC tool and online electronic reporting, which
provided real-time updates on participants by age, sex, and
place of residence.
Conclusion
This study presents the first value set for EQ-5D-5L based on
social preferences obtained from a nationally representative
sample in Vietnam. The results of this study will likely play
a key role in economic evaluations and health technology
assessments in Vietnam in the future and will be of great
value to local policymakers.
Acknowledgements Open access funding provided by Umea University. This study was funded and supported by the EuroQol Research
Foundation, Hanoi University of Public Health, Hanoi Medical University and Umeå University. The authors are grateful to the EQ-VT support team for facilitating and supporting the software and monitoring
quality during data collection. We are grateful for the technical support
from Juan M. Ramos-Goñi and other EuroQol Group colleagues during
the analysis. We would like to thank Michael Herdmand for proofreading the article. We would also like to thank the 24 local guides and all
staff at the 12 District Departments of Health and Community Health
Centres for their logistics support, as well as the 10 interviewers and
our colleagues in HUPH for their continuous support of the team.
Compliance with ethical standards
Conflicts of interest The authors declare no conflicts of interest regarding the publication of this article.
Ethical approval The study design was considered and approved by the
Ethical Review Board for Biomedical Research at the Hanoi University of Public Health (Identification number: 374/2017/YTCC-HD3).
Written consent forms were obtained from participants before the
interviews and the consent forms are stored at the Hanoi University
of Public Health.
Open Access This article is licensed under a Creative Commons Attribution 4.0 International License, which permits use, sharing, adaptation, distribution and reproduction in any medium or format, as long
as you give appropriate credit to the original author(s) and the source,
provide a link to the Creative Commons licence, and indicate if changes
were made. The images or other third party material in this article are
included in the article’s Creative Commons licence, unless indicated
otherwise in a credit line to the material. If material is not included in
the article’s Creative Commons licence and your intended use is not
permitted by statutory regulation or exceeds the permitted use, you will
need to obtain permission directly from the copyright holder. To view a
copy of this licence, visit http://creativecommons.org/licenses/by/4.0/.
References
1. Vietnam Ministry of Health, H. P. G. (2014). Report on Strengthening prevention and control of Non-communicabe diseases. Joint
Annual Health Review 2014.
13
Quality of Life Research (2020) 29:1923–1933
2. Drummond, M. F. (1987). Resource allocation decisions in
health care: A role for quality of life assessments? Journal of
Chronic Disease, 40(6), 605–619. https://doi.org/10.1016/00219681(87)90021-x.
3. Torrance, G. W. (1986). Measurement of health state utilities for
economic appraisal: A review. Journal of Health Economics, 5,
1–30. https://doi.org/10.1016/0167-6296(86)90020-2.
4. Decision 5315/QD-BYT on the principles and criteria for the formulation of list of new drugs under the national health insurance
scheme. (2018). 5315/QD-BYT. Vietnam: Ministry of Health.
5. Rowen, D., Azzabi Zouraq, I., Chevrou-Severac, H., & van Hout,
B. (2017). International regulations and recommendations for utility data for health technology assessment. PharmacoEconomics.
https://doi.org/10.1007/s40273-017-0544-y.
6. Drummond, M. F., Sculpher, M. J., Claxton, K., Stoddart, G. L.,
& Torrance, G. W. (2015). Measuring and valuing efects: Health
gain. Methods for the economic evaluation of health care programmes (Vol. 4, pp. 123–170). Oxford: Oxford University Press.
7. Burström, K., Sun, S., Gerdtham, U. G., Henriksson, M., Johannesson, M., Levin, L. Å., et al. (2014). Swedish experience-based
value sets for EQ-5D health states. Qality of life research. https://
doi.org/10.1007/s11136-013-0496-4.
8. De Wit, G. A., Busschbach, J. J., & De Charro, F. T. (2000). Sensitivity and perspective in the valuation of health status: whose
values count? Health Economics, 9, 109–126.
9. Gandjour, A. (2010). Theoretical foundation of patient v. population preferences in calculating QALYs. Medical Decision Making.
https://doi.org/10.1177/0272989X10370488.
10. Sun, S., Chen, J., Kind, P., Xu, L., Zhang, Y., & Burström, K.
(2015). Experience-based VAS values for EQ-5D-3L health states
in a national general population health survey in China. Quality
of Life Research. https://doi.org/10.1007/s11136-014-0793-6.
11. Stolk, E. A., Oppe, M., Scalone, L., & Krabbe, P. F. (2010).
Discrete choice modeling for the quantification of health states:
The case of the EQ-5D. Value Health. https://doi.org/10.111
1/j.1524-4733.2010.00783.x.
12. Guidelines for preparing submissions to the Pharmaceutical Benefits Advisory Committee (PBAC) (2016). Retrieved October,
2019, from. https://pbac.pbs.gov.au/.
13. Guide to the methods of technology appraisal 2013 (2013). NICE.
Retrieved October, 2019, from https://www.nice.org.uk/process/
pmg9/chapter/foreword.
14. Rencz, F., Gulacsi, L., Drummond, M., Golicki, D., Prevolnik
Rupel, V., Simon, J., et al. (2016). EQ-5D in Central and Eastern Europe: 2000–2015. Qality of Life Research. https://doi.
org/10.1007/s11136-016-1375-6.
15. Riewpaiboon, A., Van Minh, H., Huong, N. T., Dung, P., &
Wright, E. P. (2014). Burden of care for persons with disabilities
in Vietnam. Health & Social Care in the Community. https://doi.
org/10.1111/hsc.12147.
16. Nguyen, Q. A. (2014). Economic evaluation of adolescent reproductive health education interventions in Chilinh, Vietnam. Doctoral Thesis in Queensland University of Technology, Australia.
17. Tran, B. X., Nguyen, L. H., Nguyen, C. T., Phan, H. T., & Latkin, C. A. (2016). Alcohol abuse increases the risk of HIV infection and diminishes health status of clients attending HIV testing
services in Vietnam. Harm Reduction Journal, 13, 6. https://doi.
org/10.1186/s12954-016-0096-z.
18. Hoi Le, V., Chuc, N. T., & Lindholm, L. (2010). Health-related
quality of life, and its determinants, among older people in rural
Vietnam. BMC Public Health, 10, 549.
19. Tran, P. L., Leigh Blizzard, C., Srikanth, V., Hanh, V. T., Lien, N.
T., Thang, N. H., et al. (2015). Health-related quality of life after
stroke: Reliability and validity of the Duke Health Profile for use
in Vietnam. Quality of Life Research, 24(11), 2807–2814. https
://doi.org/10.1007/s11136-015-1016-5.
Quality of Life Research (2020) 29:1923–1933
20. Kimman, M., Jan, S., Kingston, D., Monaghan, H., Sokha, E.,
Thabrany, H., et al. (2017). Health-related quality of life and psychological distress among cancer survivors in Southeast Asia:
Results from a longitudinal study in eight low- and middle-income
countries. BMC Medicine, 15(1), 10. https://doi.org/10.1186/
s12916-016-0768-2.
21. Tran, B. X., Huong, L. T., Hinh, N. D., Nguyen, L. H., Le, B. N.,
Nong, V. M., et al. (2017). A study on the influence of internet
addiction and online interpersonal influences on health-related
quality of life in young Vietnamese. BMC Public Health, 17(1),
138.
22. Vo, N. X., & Van Ha, T. (2017). The quality of life—A systematic
review orientation to establish utility score in Vietnam. Systematic
Reviews in Pharmacy, 8, 92.
23. Kim, S. H., Ahn, J., Ock, M., Shin, S., Park, J., Luo, N., et al.
(2016). The EQ-5D-5L valuation study in Korea. Qality of Life
Research. https://doi.org/10.1007/s11136-015-1205-2.
24. Pattanaphesaj, J., Thavorncharoensap, M., Ramos-Goñi, J. M.,
Tongsiri, S., Ingsrisawang, L., & Teerawattananon, Y. (2018).
The EQ-5D-5L valuation study in Thailand. PharmacoEconomics. https://doi.org/10.1080/14737167.2018.1494574.
25. Luo, N., Liu, G., Li, M., Guan, H., Jin, X., & Rand-Hendriksen,
K. (2017). Estimating an EQ-5D-5L Value Set for China. Value
in Health. https://doi.org/10.1016/j.jval.2016.11.016.
26. Wang, P., Liu, G. G., Jo, M. W., Purba, F. D., Yang, Z., Gandhi,
M., et al. (2019). Valuation of EQ-5D-5L health states: A comparison of seven Asian populations. PharmacoEconomics. https
://doi.org/10.1080/14737167.2019.1557048.
27. Oppe, M., Devlin, N. J., van Hout, B., Krabbe, P. F. M., & de
Charro, F. (2014). A Program of methodological research to
arrive at the new international EQ-5D-5L valuation protocol.
Value in Health, 17(4), 445–453. https: //doi.org/10.1016/j.
jval.2014.04.002.
28. Oppe, M., & Hout, B. V. (2017). The “power” of eliciting EQ5D-5L values: The experimental design of the EQ-VT. In EuroQol
Research Foundation (Ed.), Working paper series (pp. 6).
29. Vietnam General Statistic Office. (2017). Statistic yearbook of
Vietnam 2017. Vietnam: GSO.
30. Krabbe, P. F., Devlin, N. J., Stolk, E. A., Shah, K. K., Oppe, M.,
van Hout, B., et al. (2014). Multinational evidence of the applicability and robustness of discrete choice modeling for deriving
EQ-5D-5L health-state values. Medical Care, 52, 935. https: //doi.
org/10.1097/MLR.0000000000000178.
31. Oppe, M., Rand-Hendriksen, K., Shah, K., Ramos-Goñi, J. M., &
Luo, N. (2016). EuroQol protocols for time trade-off valuation of
health outcomes. PharmacoEconomics, 34(10), 993–1004. https
://doi.org/10.1007/s40273-016-0404-1.
32. Stolk, E., Ludwig, K., Rand, K., van Hout, B., & Ramos-Goñi,
J. M. (2019). Overview, Update, and lessons learned from the
international EQ-5D-5L valuation work: Version 2 of the EQ5D-5L valuation protocol. Value in Health, 22(1), 23–30. https://
doi.org/10.1016/j.jval.2018.05.010.
33. StataCorp LLC. (2017). STATA program (Vol. 15). College Station: StataCorp LLC.
34. Ramos-Goni, J. M., Craig, B. M., Oppe, M., Ramallo-Farina, Y.,
Pinto-Prades, J. L., Luo, N., et al. (2018). Handling data quality issues to estimate the spanish EQ-5D-5L value set using a
hybrid interval regression approach. Value in Health. https://doi.
org/10.1016/j.jval.2017.10.023.
1933
35. Oppe M, R.-G. J., van Hout B. . Modeling EQ-5D-5L valuation
data. In 29th Scientific Plenary Meeting of the EuroQol Group,
Netherlands, 2012 (pp. 61–91, Vol. Proceedings from the 29th
Scientific Plenary Meeting of the EuroQol Group.)
36. Ramos-Goñi J, Craig B, Oppe M, Hout B (2016) Combining
continuous and dichotomous responses in a hybrid model. In:
EuroQol Research Foundation (Editors) Working paper series.
EuroQol Research Foundation, Rotterdam
37. Ramos-Goñi, J. M., Pinto-Prades, J. L., Oppe, M., Cabasés, J. M.,
Serrano-Aguilar, P., & Rivero-Arias, O. (2017). Valuation and
modeling of EQ-5D-5L health states using a hybrid approach.
Medical Care. https://doi.org/10.1097/MLR.0000000000000283.
38. EuroQol Research Foundation EQ-5D 5L | Valuation: Standard
value sets. Retrieved August 23, 2019, from https://euroqol.org/
eq-5d-instruments/eq-5d-5l-about/valuation-standard-value-sets/.
39. Hobbins, A., Barry, L., Kelleher, D., Shah, K., Devlin, N., Goni,
J. M. R., et al. (2018). Utility values for health states in Ireland:
A value set for the EQ-5D-5L. PharmacoEconomics. https://doi.
org/10.1007/s40273-018-0690-x.
40. Versteegh, M. M., Vermeulen, K. M., Evers, S. M., de Wit, G.
A., Prenger, R., & Stolk, E. A. (2016). Dutch tariff for the fivelevel version of EQ-5D. Value Health, 19(4), 343–352. https: //doi.
org/10.1016/j.jval.2016.01.003.
41. Ludwig, K., Graf von der Schulenburg, J. M., & Greiner, W.
(2018). German value set for the EQ-5D-5L. PharmacoEconomics, 36(6), 663–674. https://doi.org/10.1007/s40273-018-0615-8.
42. Devlin, N. A.-O., Shah, K. A.-O., Feng, Y. A.-O., Mulhern, B.
A.-O., & van Hout, B. (2017). Valuing health-related quality of
life: An EQ-5D-5L value set for England. Health Economics. https
://doi.org/10.1002/hec.3564.
43. Wong, E. L. Y., Ramos-Goni, J. M., Cheung, A. W. L., Wong, A.
Y. K., & Rivero-Arias, O. A.-O. (2018). Assessing the use of a
feedback module to model EQ-5D-5L health states values in Hong
Kong. The Patient. https://doi.org/10.1007/s40271-017-0278-0.
44. Purba, F. D., Hunfeld, J. A., Iskandarsyah, A., Fitriana, T. S.,
Sadarjoen, S. S., Ramos-Goñi, J. M., et al. (2017). The Indonesian EQ-5D-5L Value Set. PharmacoEconomics. https://doi.
org/10.1007/s40273-017-0538-9.
45. Sashidharan, S. P., White, R., Mezzina, R., Jansen, S., & Gishoma,
D. (2016). Global mental health in high-income countries. The
Bristish Journal of psychiatry. https: //doi.org/10.1192/bjp.
bp.115.179556.
46. World Health Organization. (2018). Mental Health Atlas
2017 Licence: CC BY-NC-SA 3.0 IGO. Geneva: World Health
Organization.
47. Perloff, R. M. (1999). The third person effect: A critical review
and synthesis. Media Psychology, 1(4), 353–378. https://doi.
org/10.1207/s1532785xmep0104_4.
48. Agt, H., & Bonsel, G. (2006). EQ-5D concepts and methods:
A developmental history medical decision making (pp. 29–33).
Dordrecht: Springer.
Publisher’s Note Springer Nature remains neutral with regard to
jurisdictional claims in published maps and institutional affiliations.
13