Data analysis _a data visualization guide for business professionals
Bạn đang xem bản rút gọn của tài liệu. Xem và tải ngay bản đầy đủ của tài liệu tại đây (317.28 KB, 65 trang )
storytelling with data
storytelling
with data
a data visualization guide
for business professionals
cole nussbaumer knaflic
Cover image: Cole Nussbaumer Knaflic
Cover design: Wiley
Copyright © 2015 by Cole Nussbaumer Knaflic. All rights
reserved. Published by John Wiley & Sons, Inc., Hoboken, New
Jersey.
Published simultaneously in Canada.
No part of this publication may be reproduced, stored in a retrieval system, or
transmitted in any form or by any means, electronic, mechanical, photocopying,
recording, scanning, or otherwise, except as permitted under Section 107 or 108 of
the 1976 United States Copyright Act, without either the prior written permission of
the Publisher, or authorization through payment of the appropriate per-copy fee to
the Copyright Clearance Center, Inc., 222 Rosewood Drive, Danvers, MA 01923,
(978) 750-8400, fax (978) 646-8600, or on the Web at www.copyright.com.
Requests to the Publisher for permission should be addressed to the Permissions
Department, John Wiley & Sons, Inc., 111 River Street, Hoboken, NJ 07030, (201)
748-6011, fax (201) 748- 6008, or online at www.wiley.com/go/permissions.
Limit of Liability/Disclaimer of Warranty: While the publisher and author have used
their best efforts in preparing this book, they make no representations or warranties
with respect to the accuracy or completeness of the contents of this book and
specifically disclaim any implied warranties of merchantability or fitness for a particular
purpose. No warranty may be created or extended by sales representatives or written
sales materials. The advice and strategies contained herein may not be suitable for
your situation. You should consult with a professional where appropriate. Neither the
publisher nor author shall be liable for any loss of profit or any other commercial
damages, including but not limited to special, incidental, consequential, or other
damages.
For general information on our other products and services or for technical support,
please contact our Customer Care Department within the United States at (800)
762- 2974, outside the United States at (317) 572-3993 or fax (317) 572-4002.
Wiley publishes in a variety of print and electronic formats and by print-on-demand.
Some material included with standard print versions of this book may not be included
in e-books or in print-on-demand. If this book refers to media such as a CD or DVD
that is not included in the version you purchased, you may download this material at
. For more information about Wiley products, visit
www.wiley.com.
Library of Congress Cataloging-in-Publication Data:
ISBN 9781119002253 (Paperback)
ISBN 9781119002260 (ePDF)
ISBN 9781119002062 (ePub)
Printed in the United States of America
10 9 8 7 6 5 4 3 2 1
To Randolph
contents
foreword ix acknowledgments xi about the
author xiii
introduction 1 chapter 1 the importance of context 19 chapter
2 choosing an effective visual 35 chapter 3 clutter is your
enemy! 71 chapter 4 focus your audience’s attention 99
chapter 5 think like a designer 127 chapter 6 dissecting
model visuals 151 chapter 7 lessons in storytelling 165
chapter 8 pulling it all together 187 chapter 9 case studies
207 chapter 10 final thoughts 241
bibliography 257 index 261
vii
foreword
“Power Corrupts. PowerPoint Corrupts Absolutely.” —
Edward Tufte, Yale Professor Emeritus1
We’ve all been victims of bad slideware. Hit‐and‐run
presentations that leave us staggering from a maelstrom of fonts,
colors, bullets,
and highlights. Infographics that fail to be
informative and are only graphic in the same sense that violence
can be graphic. Charts and tables in the press that mislead and
confuse.
It’s too easy today to generate tables, charts, graphs. I can
imagine some old‐timer (maybe it’s me?) harrumphing over my
shoulder that in his day they’d do illustrations by hand, which
meant you had to think before committing pen to paper.
Having all the information in the world at our fingertips doesn’t
make it easier to communicate: it makes it harder. The more
information you’re dealing with, the more difficult it is to filter down
to the most important bits.
Enter Cole Nussbaumer Knaflic.
I met Cole in late 2007. I’d been recruited by Google the year
before to create the “People Operations” team, responsible for
finding, keep ing, and delighting the folks at Google. Shortly after
joining I decided
Tufte, Edward R. ‘PowerPoint Is Evil.’ Wired Magazine, www.wired.com/wired/
archive/11.09/ppt2.html, September 2003.
1
ix
x foreword
we needed a People Analytics team, with a mandate to make sure
we innovated as much on the people side as we did on the product
side. Cole became an early and critical member of that team,
acting as a conduit between the Analytics team and other parts of
Google.
Cole always had a knack for clarity.
She was given some of our messiest messages—such as what
exactly makes one manager great and another crummy—and
distilled them into crisp, pleasing imagery that told an irrefutable
story. Her messages of “don’t be a data fashion victim” (i.e., lose
the fancy clipart, graphics and fonts—focus on the message) and
“simple beats sexy” (i.e., the point is to clearly tell a story, not to
make a pretty chart) were powerful guides.
We put Cole on the road, teaching her own data visualization
course over 50 times in the ensuing six years, before she decided
to strike out on her own on a self‐proclaimed mission to “rid the
world of bad PowerPoint slides.” And if you think that’s not a big
issue, a Google search of “powerpoint kills” returns almost half a
million hits!
In Storytelling with Data, Cole has created an of‐the‐moment
complement to the work of data visualization pioneers like Edward
Tufte. She’s worked at and with some of the most data‐driven
organizations on the planet as well as some of the most mission‐
driven, data‐free institutions. In both cases, she’s helped sharpen
their messages, and their thinking.
She’s written a fun, accessible, and eminently practical guide to
extracting the signal from the noise, and for making all of us better
at getting our voices heard.
And that’s kind of the whole point, isn’t it?
Laszlo Bock
SVP of People Operations, Google, Inc.
and author of Work Rules!
May 2015
acknowledgments
My timeline of thanks Thank you to…
2015
2010−CURRENT My family, for your love and support. To my love,
my husband, Randy, for being my #1 cheerleader through it all;
I love you, darling. To my beautiful sons, Avery and Dorian, for
reprioritizing my life and bringing much joy to my world.
2010−CURRENT My clients, for taking part in my effort to rid the world of ineffective
graphs and inviting me to share my work with their teams and organizations through
workshops and other projects.
2007−2012 The Google Years. Laszlo Bock, Prasad Setty, Brian Ong, Neal Patel,
Tina Malm, Jennifer Kurkoski, David Hoffman, Danny Cohen, and Natalie Johnson,
for giving me the opportunity and autonomy to research, build, and teach content
on effective data visualization, for subjecting your work to my often critical eye,
and for general support and inspiration.
2002−2007 The Banking Years. Mark Hillis and Alan Newstead, for recognizing and
encouraging excellence in visual design as I first started to discover and hone my data
viz skills (in sometimes painful ways, like the fraud management spider graph!).
1987−CURRENT My brother, for reminding me of the importance of balance in life.
1980−CURRENT My dad, for your design eye and attention to detail.
1980−2011 My mother, the single biggest influence on my life; I miss you, Mom.
1980
Thank you also to everyone who helped make this book possible. I value every bit of input and help along the way. In
addition to the people listed above, thanks to Bill Falloon, Meg Freeborn, Vincent Nordhaus, Robin Factor, Mark
Bergeron, Mike Henton, Chris Wallace, Nick Wehrkamp, Mike Freeland, Melissa Connors, Heather Dunphy, Sharon
Polese, Andrea Price, Laura Gachko, David Pugh, Marika Rohn, Robert Kosara, Andy Kriebel, John Kania, Eleanor
Bell, Alberto Cairo, Nancy Duarte, Michael Eskin, Kathrin Stengel, and Zaira Basanez.
xi
about the author
Cole Nussbaumer Knaflic tells stories with data. She specializes in
the effective display of quantitative information and writes the pop
ular blog storytellingwithdata.com. Her well‐regarded workshops
and presentations are highly sought after by data‐minded individu
als, companies, and philanthropic organizations all over the world.
Her unique talent was honed over the past decade through analyti
cal roles in banking, private equity, and most recently as a
manager on the Google People Analytics team. At Google, she
used a data‐ driven approach to inform innovative people
programs and man agement practices, ensuring that Google
attracted, developed, and retained great talent and that the
organization was best aligned to meet business needs. Cole
traveled to Google offices throughout the United States and
Europe to teach the course she developed on data visualization.
She has also acted as an adjunct faculty member at the Maryland
Institute College of Art (MICA), where she taught Introduction to
Information Visualization.
Cole has a BS in Applied Math and an MBA, both from the
University of Washington. When she isn’t ridding the world of
ineffective graphs one pie at a time, she is baking them, traveling,
and embarking on adventures with her husband and two young
sons in San Francisco.
xiii
introduction
Bad graphs are everywhere
I encounter a lot of less‐than‐stellar visuals in my work (and in
my life—once you get a discerning eye for this stuff, it’s hard to
turn it off). Nobody sets out to make a bad graph. But it happens.
Again and again. At every company throughout all industries and
by all types of people. It happens in the media. It happens in
places where you would expect people to know better. Why is
that?
Survey Results
11%
Bored
19%
User Satisfaction
5%
Not great
Have not used Not satisfied at all Not very satisfied Somewhat satisfied
Very satisfied Completely satisfied
OK
Featur…
11%
Kind of interested
40%
47%
25%
Featur…
40%
13%
36%
Excited
47%
Featur…
5%
24%
34%
33%
Featur…
4%
21%
37%
29%
Featur…
6%
Ticket Trend
23%
36%
300.00
28%
7
Feature F
1
250.00
5%
4
20%
3
35%
2
2
2
25%
Featur…
0
0
200.00
5%
4
15%
4
1
26%
7
2
33%
0
8
1
Featur…
8
0
8
6%
8
7
6
0
8
23%
0
32%
9
9
1
25%
1
1
1
Feature I
1
9
6
5%
0
6
17%
6
5
6
27%
2
150.00
27%
4
Feature J
5
4
8%
4
1
1
14%
6
1
4
3
24%
1
1
27%
3
4
25%
1
1
1
Featur…
1
3
4%
17%
1
1
2
2
2
4
1
1
28%
21%
1
1
Feature L
100.00
4%
23%
0
1
27%
16%
50.00
Featur…
3%
8%
0.00
25%
18%
13%
Featur…
9%
Ticket Volume Received Ticket Volume Processed
14%
24%
17%
10%
Featur…
6%
15%
16%
11%
Our Customers
15% 11%
Segment 7
20%
Weighted Performance Index
Segment 6
1.50
32%
17%
1.00
10% 18% 10%
0.50
Segment 5
Segment 4
0.00
10%
15%
(0.50)
Segment 3
7%
(1.00)
10%
Segment 2
16%
(1.50)
9%
Our Business Competitor A Competitor B
Competitor C Competitor D Competitor E
Segment 1
US Population Our Customers
Non Profit Support
100%
90%
Arts & culture
80%
Education
70%
60%
Health
50%
Human services
40%
Other
30%
20%
10%
0%
2010 2011 2012 2013 2014 2015
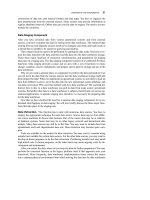
Figure 0.1 A sampling of ineffective graphs
1
2 introduction
We aren’t naturally good at storytelling with data
In school, we learn a lot about language and math. On the
language side, we learn how to put words together into sentences
and into stories. With math, we learn to make sense of numbers.
But it’s rare that these two sides are paired: no one teaches us
how to tell stories with numbers. Adding to the challenge, very few
people feel natu
rally adept in this space.
This leaves us poorly prepared for an important task that is increas
ingly in demand. Technology has enabled us to amass greater and
greater amounts of data and there is an accompanying growing
desire to make sense out of all of this data. Being able to visualize
data and tell stories with it is key to turning it into information that
can be used to drive better decision making.
In the absence of natural skills or training in this space, we often
end up relying on our tools to understand best practices.
Advances in technology, in addition to increasing the amount of
and access to data, have also made tools to work with data
pervasive. Pretty much anyone can put some data into a graphing
application (for exam
ple, Excel) and create a graph. This is important to consider, so I
will repeat myself: anyone can put some data into a graphing appli
cation and create a graph. This is remarkable, considering that the
process of creating a graph was historically reserved for scientists
or those in other highly technical roles. And scary, because
without a clear path to follow, our best intentions and efforts
(combined with oft‐questionable tool defaults) can lead us in
some really bad direc tions: 3D, meaningless color, pie charts.
We aren’t naturally good at storytelling with data 3
Skilled in Microsoft Office? So is everyone else!
B
eing adept with word processing applications, spreadsheets
, and presentation
software—things that used
to set one apart on a resume and in the workplace—has
become a minimum expectation for most employers. A
recruiter told me that, today, having “proficiency in Microsoft
Office” on a resume isn’t enough: a basic level of knowledge
here is assumed and it’s what you can do above and beyond
that will set you apart from others. Being able to effectively
tell stories with data is one area that will give you that edge
and position you for success in nearly any role.
While technology has increased access to and proficiency in tools
to work with data, there remain gaps in capabilities. You can put
some data in Excel and create a graph. For many, the process of
data visualization ends there. This can render the most interesting
story completely underwhelming, or worse—difficult or impossible
to understand. Tool defaults and general practices tend to leave
our data and the stories we want to tell with that data sorely
lacking.
There is a story in your data. But your tools don’t know what that
story is. That’s where it takes you—the analyst or communicator of
the information—to bring that story visually and contextually to life.
That process is the focus of this book. The following are a few
exam
ple before‐and‐afters to give you a visual sense of what you’ll
learn; we’ll cover each of these in detail at various points in the
book.
The lessons we will cover will enable you to shift from simply show
ing data to storytelling with data.
4 introduction
300.00
184
241
237
250.00
Ticket Trend
202
180
200.00
150.00
100.00
50.00 0.00 160
184
160
y
y
h
l y
e y
Januar Februar Marc Apri Ma Jun Jul August
149
148
181
161
150
132
123
November
156
160
126
139 149
104 124
177
140
r
Septembe October
Ticket Volume Received Ticket Volume Processed
Figure 0.2
Example 1 (before): showing data
Please approve the hire of 2
FTEs to backfill those who quit in the past year
Ticket volume over time
December
bm
st
202
300 250 200
e
k
c
it
2 employees quit in May. We nearly kept
up with incoming volume in the following
two months, but fell behind with the
increase in Aug and haven't been able to
177
catch up since.
156
160
f
o
r
e
u
N
150
50
124140
126
104
139 149
0
Received Processed
100
Jan Feb Mar Apr May Jun Jul Aug Sep Oct Nov Dec 2014
Data source: XYZ Dashboard, as of 12/31/2014 | A detailed analysis on tickets processed per person
and time to resolve issues was undertaken to inform this request and can be provided if needed.
Figure 0.3 Example 1 (after): storytelling with data
We aren’t naturally good at storytelling with data 5
Survey
Results
PRE: How do you feel
about doing science?
POST: How do you feel
about doing science?
Bored Not great OK Kind of interested Excited
19%
25%
11% 5% 40%
Bored Not great OK Kind of interested Excited
38%
12% 6% 14%
30%
Figure 0.4 Example 2 (before): showing data
Pilot program was a success
How do you feel about science?
BEFORE program, the
majority of children felt
just OK about science.
11%
5%
12%
AFTER
6%
40%
25%
19%
14%
38%
program,
more children were
Kind of interested &
Excited about science.
30%
Bored Not great OK Kind of interested
Excited
Based on survey of 100 students conducted before and after pilot program (100% response rate on both surveys).
Figure 0.5 Example 2 (after): storytelling with data
6 introduction
$200
$100
$0
$500
$400
$300
Average Retail Product Price per Year
Product A Product B Product C Product D Product E 2008 2009 2010
2011 2012 2013 2014Figure 0.6 Example 3 (before): showing data
To be competitive, we recommend introducing our product below
the $223 average price point in the $150−$200 range
Retail price over time by product
e
$200 $150
c
B
ir
AVG
p
e
g
D
a
r
C
e
$0
v
A
$500 $400 $300
A
E
Recommended range
2008 2009 2010 2011 2012 2013 2014 Year
Figure 0.7 Example 3 (after): storytelling with data
Who this book is written for 7
Who this book is written for
This book is written for anyone who needs to communicate some
thing to someone using data. This includes (but is certainly not lim
ited to): analysts sharing the results of their work, students
visualizing thesis data, managers needing to communicate in a
data‐driven way, philanthropists proving their impact, and leaders
informing their board. I believe that anyone can improve their
ability to communi cate effectively with data. This is an intimidating
space for many, but it does not need to be.
When you are asked to “show data,” what sort of feelings does that
evoke?
Perhaps you feel uncomfortable because you are unsure where to
start. Or maybe it feels like an overwhelming task because you
assume that what you are creating needs to be complicated and
show enough detail to answer every possible question. Or perhaps
you already have a solid foundation here, but are looking for that
something that will help take your graphs and the stories you want
to tell with them to the next level. In all of these cases, this book is
written with you in mind.
“When I’m asked to show the data, I feel…”
A
n informal Twitter poll I conducted revealed the follow
ing mix of emotions
when people are asked to “show
the data.”
Frustrated because I don’t think I’ll be able to tell the
whole story.
Pressure to make it clear to whomever needs the data.
Inadequate. Boss: Can you drill down into that? Give me
the split by x, y, and z.
8 introduction
Being able to tell stories with data is a skill that’s becoming ever
more important in our world of increasing data and desire for
data‐ driven decision making. An effective data visualization can
mean the difference between success and failure when it comes
to com municating the findings of your study, raising money for
your non profit, presenting to your board, or simply getting your
point across to your audience.
My experience has taught me that most people face a similar chal
lenge: they may recognize the need to be able to communicate
effectively with data but feel like they lack expertise in this space.
People skilled in data visualization are hard to come by. Part of the
challenge is that data visualization is a single step in the analytical
process. Those hired into analytical roles typically have quantita
tive backgrounds that suit them well for the other steps (finding the
data, pulling it together, analyzing it, building models), but not nec
essarily any formal training in design to help them when it comes
to the communication of the analysis—which, by the way, is
typically the only part of the analytical process that your audience
ever sees. And increasingly, in our ever more data‐driven world,
those without technical backgrounds are being asked to put on
analytical hats and communicate using data.
The feelings of discomfort you may experience in this space aren’t
surprising, given that being able to communicate effectively with
data isn’t something that has been traditionally taught. Those who
excel have typically learned what works and what doesn’t through
trial and error. This can be a long and tedious process. Through
this book, I hope to help expedite it for you.
How I learned to tell stories with data
I have always been drawn to the space where mathematics and
business intersect. My educational background is mathematics and
business, which enables me to communicate effectively with both
sides—given that they don’t always speak the same language—
and help them better understand one another. I love being able to
take
How I learned to tell stories with data 9
the science of data and use it to inform better business decisions.
Over time, I’ve found that one key to success is being able to com
municate effectively visually with data.
I initially recognized the importance of being skilled in this area dur
ing my first job out of college. I was working as an analyst in credit
risk management (before the subprime crisis and hence before any
one really knew what credit risk management was). My job was to
build and assess statistical models to forecast delinquency and
loss. This meant taking complicated stuff and ultimately turning it
into a simple communication of whether we had adequate money
in the reserves for expected losses, in what scenarios we’d be at
risk, and so forth. I quickly learned that spending time on the
aesthetic piece— something my colleagues didn’t typically do—
meant my work gar nered more attention from my boss and my
boss’s boss. For me, that was the beginning of seeing value in
spending time on the visual communication of data.
After progressing through various roles in credit risk, fraud, and
oper ations management, followed by some time in the private
equity world, I decided I wanted to continue my career outside of
bank ing and finance. I paused to reflect on the skills I possessed
that I wanted to be utilizing on a daily basis: at the core, it was
using data to influence business decisions.
I landed at Google, on the People Analytics team. Google is a
data‐ driven company—so much so that they even use data and
analytics in a space not frequently seen: human resources.
People Analytics is an analytics team embedded in Google’s HR
organization (referred to at Google as “People Operations”). The
mantra of this team is to help ensure that people decisions at
Google—decisions about employees or future employees—are
data driven. This was an amaz ing place to continue to hone my
storytelling with data skills, using data and analytics to better
understand and inform decision mak ing in spaces like targeted
hiring, engaging and motivating employ ees, building effective
teams, and retaining talent. Google People Analytics is cutting
edge, helping to forge a path that many other
10 introduction
companies have started to follow. Being involved in building and
growing this team was an incredible experience.
Storytelling with data on what makes a great
manager via Project Oxygen
O
ne particular project that has been highlighted in
the public sphere is the Project Oxygen research at
Google on what makes a great manager. This work has been
described in the New York Times and is the basis of a pop
ular Harvard Business Review case study. One challenge
faced was communicating the findings to various audiences,
from engineers who were sometimes skeptical on meth
odology and wanted to dig into the details, to managers
wanting to understand the big‐picture findings and how to
put them to use. My involvement in the project was on the
communication piece, helping to determine how to best
show sometimes very complicated stuff in a way that would
appease the engineers and their desire for detail while still
being understandable and straightforward for managers and
various levels of leadership. To do this, I leveraged many of
the concepts we will discuss in this book.
The big turning point for me happened when we were building an
internal training program within People Operations at Google and I
was asked to develop content on data visualization. This gave me
the opportunity to research and start to learn the principles behind
effective data visualization, helping me understand why some of
the things I’d arrived at through trial and error over the years had
been effective. With this research, I developed a course on data
visualiza
tion that was eventually rolled out to all of Google.
The course created some buzz, both inside and outside of Google.
Through a series of fortuitous events, I received invitations to
speak at a couple of philanthropic organizations and events on the
topic of data visualization. Word spread. More and more people
were reach
ing out to me—initially in the philanthropic world, but increasingly in
How you’ll learn to tell stories with data: 6 lessons 11
the corporate sector as well—looking for guidance on how to com
municate effectively with data. It was becoming increasingly clear
that the need in this space was not unique to Google. Rather,
pretty much anyone in an organization or business setting could
increase their impact by being able to communicate effectively
with data. After acting as a speaker at conferences and
organizations in my spare time, eventually I left Google to pursue
my emerging goal of teaching the world how to tell stories with
data.
Over the past few years, I’ve taught workshops for more than a
hun dred organizations in the United States and Europe. It’s been
interest ing to see that the need for skills in this space spans many
industries and roles. I’ve had audiences in consulting, consumer
products, edu cation, financial services, government, health care,
nonprofit, retail, startups, and technology. My audiences have
been a mix of roles and levels: from analysts who work with data
on a daily basis to those in non‐analytical roles who occasionally
have to incorporate data into their work, to managers needing to
provide guidance and feedback, to the executive team delivering
quarterly results to the board.
Through this work, I’ve been exposed to many diverse data
visualiza tion challenges. I have come to realize that the skills that
are needed in this area are fundamental. They are not specific to
any industry or role, and they can be effectively taught and
learned—as demon strated by the consistent positive feedback
and follow‐ups I receive from workshop attendees. Over time, I’ve
codified the lessons that I teach in my workshops. These are the
lessons I will share with you.
How you’ll learn to tell stories with data: 6 lessons
In my workshops, I typically focus on five key lessons. The big
oppor tunity with this book is that there isn’t a time limit (in the way
there is in a workshop setting). I’ve included a sixth bonus lesson
that I’ve always wanted to share (“think like a designer”) and also
a lot more by way of before‐and‐after examples, step‐by‐step
instruction, and insight into my thought process when it comes to
the visual design of information.
12 introduction
I will give you practical guidance that you can begin using immedi
ately to better communicate visually with data. We’ll cover content
to help you learn and be comfortable employing six key lessons:
1. Understand the context
2. Choose an appropriate visual display
3. Eliminate clutter
4. Focus attention where you want it
5. Think like a designer
6. Tell a story
Illustrative examples span many industries
Throughout the book, I use a number of case studies to illustrate
the concepts discussed. The lessons we cover will not be industry
—or role—specific, but rather will focus on fundamental concepts
and best practices for effective communication with data. Because
my work spans many industries, so do the examples upon which I
draw. You will see case studies from technology, education,
consumer products, the nonprofit sector, and more.
Each example used is based on a lesson I have taught in my work
shops, but in many cases I’ve slightly changed the data or general
ized the situation to protect confidential information.
For any example that doesn’t initially seem relevant to you, I
encour age you to pause and think about what data visualization or
commu nication challenges you encounter where a similar
approach could be effective. There is something to be learned
from every exam ple, even if the example itself isn’t obviously
related to the world in which you work.
Lessons are not tool specific 13
Lessons are not tool specific
The lessons we will cover in this book focus on best practices that
can be applied in any graphing application or presentation
software. There are a vast number of tools that can be leveraged
to tell effec tive stories with data. No matter how great the tool,
however, it will never know your data and your story like you do.
Take the time to learn your tool well so that it does not become a
limiting factor when it comes to applying the lessons we’ll cover
throughout this book.
How do you do that in Excel?
W
hile I will not focus the discussion on specific tools,
the examples in this book were created using
Microsoft Excel. For those interested in a closer look at how
similar visuals can be built in Excel, please visit my blog at
storytellingwithdata.com, where you can download the Excel
files that accompany my posts.
How this book is organized
This book is organized into a series of big‐picture lessons, with
each chapter focusing on a single core lesson and related
concepts. We will discuss a bit of theory when it will aid in
understanding, but I will emphasize the practical application of the
theory, often through specific, real‐world examples. You will leave
each chapter ready to apply the given lesson.
The lessons in the book are organized chronologically in the same
way that I think about the storytelling with data process. Because
of this and because later chapters do build on and in some cases
refer back to earlier content, I recommend reading from beginning
to end. After you’ve done this, you’ll likely find yourself referring
back to specific points of interest or examples that are relevant to
the cur
rent data visualization challenges you face.
14 introduction
To give you a more specific idea of the path we’ll take, chapter
sum maries can be found below.
Chapter 1: the importance of context
Before you start down the path of data visualization, there are a
couple of questions that you should be able to concisely answer:
Who is your audience? What do you need them to know or do?
This chapter describes the importance of understanding the
situational
context, including the audience, communication
mechanism, and
desired tone. A number of concepts are
introduced and illustrated via example to help ensure that context
is fully understood. Creating a robust understanding of the
situational context reduces iterations down the road and sets you
on the path to success when it comes to creating visual content.
Chapter 2: choosing an effective visual
What is the best way to show the data you want to communicate?
I’ve analyzed the visual displays I use most in my work. In this
chap ter, I introduce the most common types of visuals used to
commu nicate data in a business setting, discuss appropriate use
cases for each, and illustrate each through real‐world examples.
Specific types of visuals covered include simple text, table,
heatmap, line graph, slopegraph, vertical bar chart, vertical
stacked bar chart, waterfall chart, horizontal bar chart, horizontal
stacked bar chart, and square area graph. We also cover visuals
to be avoided, including pie and donut charts, and discuss
reasons for avoiding 3D.
Chapter 3: clutter is your enemy!
Picture a blank page or a blank screen: every single element you
add to that page or screen takes up cognitive load on the part of
your audience. That means we should take a discerning eye to the
elements we allow on our page or screen and work to identify
those things that are taking up brain power unnecessarily and
remove
How this book is organized 15
them. Identifying and eliminating clutter is the focus of this chap
ter. As part of this conversation, I introduce and discuss the Gestalt
Principles of Visual Perception and how we can apply them to
visual displays of information such as tables and graphs. We also
discuss alignment, strategic use of white space, and contrast as
important components of thoughtful design. Several examples are
used to illustrate the lessons.
Chapter 4: focus your audience’s attention
In this chapter, we continue to examine how people see and how
you can use that to your advantage when crafting visuals. This
includes a brief discussion on sight and memory that will act to
frame up the importance of preattentive attributes like size, color,
and position on page. We explore how preattentive attributes can
be used stra
tegically to help direct your audience’s attention to where you want
them to focus and to create a visual hierarchy of components to
help direct your audience through the information you want to
commu nicate in the way you want them to process it. Color as a
strategic tool is covered in depth. Concepts are illustrated through
a num ber of examples.
Chapter 5: think like a designer
Form follows function. This adage of product design has clear appli
cation to communicating with data. When it comes to the form and
function of our data visualizations, we first want to think about what
it is we want our audience to be able to do with the data (function)
and create a visualization (form) that will allow for this with ease.
In this chapter, we discuss how traditional design concepts can be
applied to communicating with data. We explore affordances,
accessibility, and aesthetics, drawing upon a number of concepts
introduced pre viously, but looking at them through a slightly
different lens. We also discuss strategies for gaining audience
acceptance of your visual designs.
16 introduction
Chapter 6: dissecting model visuals
Much can be learned from a thorough examination of effective
visual displays. In this chapter, we look at five exemplary visuals
and dis cuss the specific thought process and design choices that