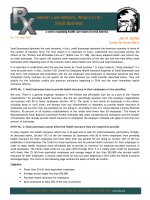
What’s in my baby’s food?
Bạn đang xem bản rút gọn của tài liệu. Xem và tải ngay bản đầy đủ của tài liệu tại đây (3 MB, 49 trang )
What’s in my
baby’s food?
A national investigation finds
95 percent of baby foods tested
contain toxic chemicals that lower
babies’ IQ, including arsenic and lead
Report includes safer choices for parents, manufacturers
and retailers seeking healthy foods for infants
I N PA RT N E R S H I P W IT H
Healthy Babies Bright Futures | Jane Houlihan, Research Director and Charlotte Brody, National Director | October 2019
ACKNOWLEDGEMENTS
Authors: Jane Houlihan, MSCE, Research Director,
and Charlotte Brody, RN, National Director, Healthy
Babies Bright Futures
Healthy Babies Bright Futures (HBBF) would like to thank
the following people and organizations for their support:
A network of groups and individuals around the
country made this study possible by purchasing
cereals at their local stores: Alaska Community Action
on Toxics, Campaign for Healthier Solutions, Coming
Clean, Ecology Center, Environmental Justice Health
Alliance, Getting Ready for Baby, Learning Disabilities
Association of America, Organizacion en California de
Lideres Campesinas, Inc., and Texas Environmental
Justice Advocacy Services (T.E.J.A.S.).
We are grateful for the guidance and review provided
by Tom Neltner, Environmental Defense Fund; Maricel
Maffini, independent consultant; Dr. Margaret Karagas,
Dartmouth; and Dr. Bruce Lanphear, Simon Fraser
University.
Special thanks to Sam Schlesinger for providing the
Spanish translations of this study and accompanying
materials.
The study was made possible by grants from The Leon
Lowenstein Foundation and The John Merck Fund.
The opinions expressed in this report are those of
HBBF and do not necessarily reflect the views of
the supporters and reviewers listed above. HBBF is
responsible for any errors of fact or interpretation
contained in this report.
Report design: Winking Fish
© October 2019 by Healthy Babies Bright Futures
and Virginia Organizing. All rights reserved.
TABLE OF CONTENTS
EXECUTIVE SUMMARY.................................................................................... 1
Promising signs of progress must accelerate to protect babies........................................................................1
Parents can make six safer baby food choices for 80 percent less toxic metal residue...................................2
Fifteen foods account for more than half of the risk .Rice-based foods top the list. ........................................3
Parents, baby food companies, farmers, and FDA all have a role
in measurably reducing babies’ exposures.........................................................................................................3
Recommendations..............................................................................................................................................4
SUMMARY: EIGHT FINDINGS FROM NEW BABY FOOD TESTS. . ................................ 6
1. Toxic heavy metals were found in nearly every baby food tested. ................................................................6
2. Babies are exposed daily, with impacts to health...........................................................................................6
3. Few safety standards exist.............................................................................................................................6
4. Recommended limits are often exceeded......................................................................................................7
5. Popular baby foods estimated to pose the greatest risk are among the many foods
that lack specific limits for heavy metals. .....................................................................................................7
6. Additional baby food tests by HBBF detected another neurotoxic contaminant—perchlorate. ....................8
7. Exposures and impacts add up, increasing urgency for action. ....................................................................8
8. Actions needed by FDA and baby food companies go beyond heavy metals................................................8
WHAT PARENTS CAN DO................................................................................ 10
HEALTH RISKS: THE SCIENTIFIC EVIDENCE...................................................... 13
Arsenic..............................................................................................................................................................13
Lead..................................................................................................................................................................13
Cadmium...........................................................................................................................................................14
Mercury.............................................................................................................................................................14
W h a t 's i n m y B a b y 's Fo o d ? | h e a l t h y b a b y f o o d . o r g | I I
SAFETY STANDARDS .. ................................................................................... 15
FDA’s proposed guidance for arsenic in infant rice cereal remains unfinalized
despite promises to complete in 2018. ...........................................................................................................15
FDA’s proposed guidance for arsenic in apple juice remains unfinalized
despite promises to complete in 2018. ...........................................................................................................16
Promising progress at FDA...............................................................................................................................16
REFERENCES............................................................................................... 17
APPENDIX A: LABORATORY TEST RESULTS FOR HEAVY METALS......................... 19
APPENDIX B: RECENT SCIENCE ON THE IMPACT OF HEAVY METALS
TO CHILDREN’S BRAIN DEVELOPMENT.. ........................................................... 29
APPENDIX C: LABORATORY ANALYSIS – SUMMARY OF METHODS
FOR HEAVY METALS TESTING........................................................................ 32
APPENDIX D: LABORATORY TEST RESULTS FOR PERCHLORATE........................... 34
APPENDIX E: RESULTS OF IQ ANALYSIS: 15 FOODS ACCOUNT
FOR OVER HALF OF TOTAL IQ LOSS FROM CHILDREN’S EXPOSURES
TO ARSENIC AND LEAD IN BABY FOOD . . ........................................................... 36
APPENDIX F: DATA AND CALCULATIONS—AVERAGE HEAVY METALS LEVELS
FOR HIGHER-RISK FOODS AND SAFER ALTERNATIVES....................................... 42
W h a t 's i n m y B a b y 's Fo o d ? | h e a l t h y b a b y f o o d . o r g | I I I
What’s in my Baby’s Food?
Our findings show what parents, baby food companies and FDA should do
to get toxic heavy metals out of babies’ diets
EXECUTIVE SUMMARY
Parents shop for baby food
expecting the nutrition, convenience
and baby-tested flavors of storebought brands. But nearly every
jar, pouch and canister also offers
something unexpected for a baby’s
mealtime—traces of heavy metals,
including arsenic and lead.
The problem, uncovered nearly a decade ago, is far from
solved. New tests of 168 baby foods commissioned by
Healthy Babies Bright Futures (HBBF) found toxic heavy
metals in 95 percent of containers tested. One in four baby
foods contained all four metals assessed by our testing
lab—arsenic, lead, cadmium, and mercury. Even in the
trace amounts found in food, these contaminants can alter
the developing brain and erode a child’s IQ. The impacts
add up with each meal or snack a baby eats.
Fresh research continues to confirm widespread exposures
and troubling risks for babies, including cancer and lifelong
deficits in intelligence from exposures to these common
food contaminants. Despite the risks, with few exceptions
there are no specific limits for toxic heavy metals in baby
food.
PROMISING SIGNS OF PROGRESS MUST
ACCELERATE TO PROTECT BABIES.
The government, parents and baby food companies are paying
attention. In 2017 the U.S. Food and Drug Administration
charged a team of top agency scientists with “reducing
exposures… to the greatest extent possible” by prioritizing
and modernizing FDA’s approaches (FDA 2018a,b). In early
2019 leading baby food companies supported by non-profit
organizations, including HBBF, formed a new Baby Food
Council that is “seeking to reduce heavy metals in the
companies’ products to as low as reasonably achievable
using best-in-class management practices” (BFC 2019). And
since 2011 public health advocates have regularly tested
baby foods and educated parents on issues ranging from
arsenic and lead in fruit juice (CR 2011,2019a) to arsenic in
infant rice cereal (HBBF 2017a, CR 2012) and heavy metals in
a range of baby foods (CR 2018, EDF 2017a, Gardener 2018).
Children are better off for the efforts: Current arsenic
contamination levels in rice cereal and juice are 37 and 63
percent lower, respectively, than amounts measured a decade
ago because of companies’ success in reducing metals levels
in their food ingredients to comply with draft FDA guidance.
They have shifted growing and processing methods, switched
plant varieties, and sourced from cleaner fields.
Despite the gains, 19 of every 20 baby foods tested had
detectable levels of one or more heavy metals, according
to new tests detailed in this study. Only a dramatically
accelerated pace at FDA and the fruition of the new Baby
Food Council’s pursuit of industry-wide change will be
enough to finally solve the problem.
W h a t 's i n m y B a b y 's Fo o d ? | h e a l t h y b a b y f o o d . o r g | 1
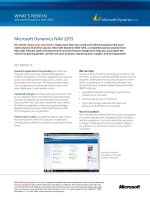
TEST RESULTS: 168 BABY FOODS
95 percent of baby foods tested
contained one or more
toxic heavy metals
1 in 4 baby foods contained all 4 toxic heavy
metals assessed by our testing lab,
including arsenic and lead.
How many baby foods had multiple
heavy metals in a single container?
4 metals
26% of baby foods
3 metals
40%
2 metals
21%
1 metal
8%
0 metals
5% (9 foods)
In how many baby foods was each
heavy metal found?
Arsenic
73% of baby foods
Lead
94%
Cadmium
75%
Mercury
32%
WHAT’S NEW
ABOUT THIS STUDY?
Reports of heavy metals in baby food
span nearly a decade. HBBF’s study
advances this work in 4 ways:
Many brands tested: We report on tests of a
wider variety of brands than past studies - 61
brands, from big names to niche brands.
First-ever look at IQ loss for babies: We include
a new study HBBF commissioned from Abt
Associates to quantify for the first time the health
impacts posed by heavy metals in baby food. This
work gives first-ever estimates of the populationwide decline in IQ from children’s exposures to
lead and arsenic in food, from birth to 24 months
of age. It also gives food-by-food rankings to
show the 15 foods commonly consumed by
babies and young children that drive more
than half of the risk (see Findings section of this
report).
Optimized actions for parents: We streamline
advice for parents to cover foods posing the
greatest risk to babies, based on the newly
released IQ loss findings (Abt 2019b). This allows
parents to focus on six actions estimated to
provide the greatest benefit for babies’ brains.
New data on industrial pollutants and additive
risks: We also include new data for the industrial
chemical perchlorate in baby food. It adds to the
risk of IQ loss posed by heavy metals, increasing
the urgency for actions to lower the levels of
neurotoxic contaminants in baby food.
PARENTS CAN MAKE SIX SAFER
BABY FOOD CHOICES FOR 80 PERCENT LESS
TOXIC METAL RESIDUE.
In the meantime, HBBF’s new tests help parents navigate
the baby food aisle. We found that simple changes can
significantly lower a baby’s exposures to heavy metal
contamination. Parents shopping for baby food can choose
five types of safer items, all readily available, over more
contaminated foods (see table below). The safer choices
contain 80 percent less arsenic, lead and other toxic heavy
metals, on average, than the riskier picks.
Notably, parents can’t shop their way out of these
exposures by choosing organic foods or by switching from
store-bought brands to homemade purees. Heavy metals
are naturally occurring in soil and water and are found
at elevated levels
in fields polluted
by pesticides,
contaminated
fertilizer, airborne
contaminants
and industrial
operations. Food
crops uptake these
metals naturally.
Leafy greens and
root crops like
carrots and sweet potatoes retain more than most other
types of fruits and vegetables. How the food is processed
may also affect the levels. Organic standards do not
address these contaminants, and foods beyond the baby
food aisle are equally affected.
Our tests show that simple actions for 5 foods can help lower your babies’ exposures
to arsenic, lead and other toxic heavy metals
Higher risk foods for heavy
metal exposure
Safer alternative
Toxic heavy
metal level
Snacks
Puff snacks (rice)
Rice-free snacks
93% less
Teething
Foods
Teething biscuits and rice rusks
Other soothing foods for teething—
frozen banana or chilled cucumber
91% less
Cereal
Infant rice cereal
Other infant cereals like multi-grain
and oatmeal
84% less
Drinks
Fruit juice
Tap water
68% less
Fruits &
Veggies
Carrots and sweet potatoes
Variety: A variety of fruits and veggies
that includes carrots, sweet potatoes,
and other choices
Up to 73% less
Source: HBBF analysis of tests of 168 baby foods by Brooks Applied Labs, Bothell Washington and FDA market basket data, 2014-2017. Exposures reductions consider
average total heavy metal levels in each food (inorganic arsenic, lead, cadmium, mercury) except for cereal, which considers inorganic arsenic only.
W h a t 's i n m y B a b y 's Fo o d ? | h e a l t h y b a b y f o o d . o r g | 2
Our research substantiates the widespread presence of
toxic heavy metals in baby foods found in prior studies,
almost no enforceable limits or guidelines on what’s
allowed, and the common occurrence of arsenic and lead
in excess of recommended levels to protect children’s
health (Table 1, page 12).
Although many foods are contaminated, a few stand out: 15
foods consumed by children under 2 years of age account for
55 percent of the risk to babies’ brains, according to a new
study commissioned by HBBF and detailed in this report
(see Findings section and Appendix E). These include apple
and grape juice, oat ring cereal, macaroni and cheese, puff
snacks and 10 other foods.
But topping the list are rice-based foods—infant rice cereal,
rice dishes and rice-based snacks. These popular baby
foods are not only high in inorganic arsenic, the most toxic
form of arsenic, but also are nearly always contaminated
with all four toxic metals. The new study, completed by the
nationally recognized toxicology and economic research
firm Abt Associates, estimates that lead and arsenic in
rice-based foods account for one-fifth of the more than
11 million IQ points children lose from birth to 24 months
of age from all dietary sources. This concentrated risk
underscores the need for swift action from FDA and baby
food companies to reduce arsenic levels in rice-based
foods.
PARENTS, BABY FOOD COMPANIES, FARMERS, AND
FDA ALL HAVE A ROLE IN MEASURABLY REDUCING
BABIES’ EXPOSURES.
A number of baby food companies are setting their own
standards in the absence of enforceable federal limits or
guidance. As these initiatives advance, packaged baby
foods may be increasingly likely to have lower amounts of
heavy metals than homemade varieties.
Our findings raise concerns, but on the spectrum from
worry to action, parents can choose to act. While no
amount of heavy metals is considered safe, less is better,
and parents can lower their babies’ exposures by serving a
variety of foods and by following the five safer choices for
baby foods provided above.
Many factors can influence a child’s IQ, from nutrition and
genetics to environmental toxins like heavy metals (e.g.,
Makharia 2016). And many sources ratchet up children’s
exposures to heavy metals, from drinking water and old
plastic toys to lead in dust from chipping paint and soil
tracked into the house. But among these factors and
sources, heavy metals in food constitute both a significant
and a solvable problem. The government, companies
and parents can all act — and are, in many cases, already
acting — to measurably lower levels in food and to lessen
exposures for babies.
W h a t 's i n m y B a b y 's Fo o d ? | h e a l t h y b a b y f o o d . o r g | 3
88 percent of baby foods we tested have
no enforceable federal safety limit for arsenic, lead
and other heavy metals
Number of baby foods tested for heavy metals by HBBF
FIFTEEN FOODS ACCOUNT FOR MORE THAN HALF
OF THE RISK. RICE-BASED FOODS TOP THE LIST.
160
148 baby foods
120
80
No federal
standard
for heavy metals
exist for these
HBBF-tested
baby foods
20 baby foods
Tested baby foods
with federal standard
or guidance for
heavy metals
40
0
Includes 10 different types
of baby food, including
fruits & veggies, meats and
meals, snacks, and others
Includes apple juice and
other fruit juices, Infant
rice cereals
RECOMMENDATIONS
Baby food companies
Our research shows that baby food companies need to
take additional steps to reduce heavy metals in their
products. This action is especially important for foods
posing the greatest risk to baby’s development, with
arsenic in rice topping the list, based on a new analysis
of children’s IQ loss from lead and arsenic in baby food
detailed in this study.
To reduce arsenic levels, solutions suggested by FDA and
other experts include sourcing rice from fields with lower
arsenic levels in soil, growing it with natural soil additives
that reduce arsenic uptake by the roots, growing rice
strains less prone to arsenic uptake, altering irrigation
practices, preparing rice with excess water that is poured
off, and blending it with lower arsenic grains in multi-grain
products.
We found no evidence to suggest that any brand has
reduced heavy metals levels in rice to amounts comparable
to those found in other types of grains, despite at least 10
years of significant public attention to the issue that has
included widespread consumer alerts and a proposed
federal action level (Consumer Reports 2012 and 2014,
HBBF 2017, FDA 2016). Four of seven infant rice cereals
tested in this study contained inorganic arsenic in excess of
FDA’s action level.
FDA
FDA should establish and finalize health-protective
standards for heavy metals, prioritizing foods that offer
the greatest opportunity to reduce exposure, considering
additive effects of the multiple metals detected in foods,
and explicitly protecting against neurodevelopmental
impacts.
FDA should implement a proactive testing program for
heavy metals in foods consumed by babies and toddlers,
similar to the Consumer Product Safety Commission’s
program for children’s toys (CPSC 2019).
Because inorganic arsenic in rice is a top source of
neurodevelopmental risk for children, FDA should act
immediately to establish a health-based limit for this
chemical in infant rice cereal and other rice-based foods.
In setting its 2016 proposed action level, the agency did
not consider IQ loss or other forms of neurological impact,
allowed cancer risks far outside of protective limits, and
failed to account for children who have unusually high
exposures to arsenic in rice (HBBF 2016). Rapid action by
FDA to set a protective level will protect children from high
levels of arsenic in rice.
W h a t 's i n m y B a b y 's Fo o d ? | h e a l t h y b a b y f o o d . o r g | 4
Parents
HBBF encourages parents to follow our simple actions
for five foods to lower children’s exposures to toxic heavy
metals, shown in the Executive Summary and in the report
section entitled “What parents can do.” The safer choices
we list contain 80 percent less arsenic, lead and other toxic
heavy metals, on average, than the riskier foods.
BABY FOOD PURCHASED FOR THE STUDY: STORES, BRANDS, AND FOOD TYPES
We shipped to the testing lab 168 baby food containers, including 61
We selected 168 individual containers of 13 different food types under 61 baby food brand names. Testing for 4 toxic heavy metals—arsenic, lead, cadmium, and mercury—
was performed at
Brooks Appliedand
Labs in Bothell,
Washington. Only 9 of
168 samples
had no detected toxic metals.
brands
13 different
food
types.
4
13
toxic heavy
metals tested
types of baby food
Puffs and other snacks
Teething biscuits,
including rice rusks
Infant rice cereal
Infant cereal: multiand non-rice grains
Fruit
Vegetables
Mixed fruits & veggies
Meat (jars)
Meals (veggies,
grains, pasta, meat
combos)
168
containers
61
baby food
brands
and 50 other brands
14 metropolitan areas and 15 retail chains where food were purchased:
formula
Apple juice
100% fruit juice
Supermarkets, dollarInfant
stores,
baby stores, superstores
Gambell AK
Shopper: Alaska Community
Action on Toxics
13
types of
metropolitan areas
baby14food
and 17 retailers from whom
the foods were purchased:
• supermarkets
• dollar stores
• baby stores
ANICA
Native Store
Minneapolis
Shopper: Healthy Babies
Bright Futures
Detroit
Shopper:
Ecology Center
Cincinnati
Portland ME
Shopper: Healthy Babies
Bright Futures
Shopper: Learning Disabilities
Association of America
Albany
Shopper: Clean and
Healthy New York
Portland
Shopper: Healthy Babies
Bright Futures
Washington DC
San Diego
Shopper: Healthy Babies
Bright Futures
Shopper: Campaign for
Healthier Solutions and
Organizacion en California
de Lideres Campesinas, Inc.
• superstores
Charlottesville VA
Boulder
Shopper: Healthy Babies
Bright Futures
Shopper: Healthy Babies Bright Futures
Online retailers
Dallas
Shopper: Texas Environmental Justice
Advocacy Services (T.E.J.A.S.)
Houston
Shopper: T.E.J.A.S
W h a t 's i n m y B a b y 's Fo o d ? | h e a l t h y b a b y f o o d . o r g | 5
Columbia SC
Shopper: Learning Disabilities
Association of America:
DRAFT | Healthy Babies Bright Futures | Houlihan 2019
Other drinks for
toddlers/babies
SUMMARY: EIGHT FINDINGS FROM NEW BABY FOOD TESTS
HBBF and a national, volunteer network of seven other nonprofit organizations purchased baby food from stores in 14
metropolitan areas across the country. We purchased foods
from 15 retail chains - supermarkets, dollar stores, baby
stores, superstores - and two online-only retailers.
We commissioned a nationally recognized laboratory with
expertise in heavy metal analysis, Brooks Applied Labs
(BAL) near Seattle Washington, to test for four toxic heavy
metals—arsenic, lead, cadmium and mercury—in the
168 baby food containers included in this study. We also
commissioned this lab to test 25 of those foods, those with
the highest arsenic levels, for the specific form of arsenic
most toxic to people, inorganic arsenic.
We commissioned a second laboratory, Southwest Research
Institute, to test 25 of those foods for an additional
neurotoxic contaminant called perchlorate, to further
illustrate the need for standards that consider the wide
range of neurotoxins in food. Test results, analytical
methods and quality control procedures are in Appendices
A, C and D. HBBF’s analysis of test results shows:
1. TOXIC HEAVY METALS WERE FOUND IN NEARLY
EVERY BABY FOOD TESTED.
Ninety-five percent of baby foods tested were contaminated
with one or more of four toxic heavy metals—arsenic, lead,
cadmium and mercury. All but nine of 168 baby foods
contained at least one metal; most contained more than
one. One in four foods had detectable levels of all four
metals, in the same baby food container. We tested a wider
range of foods than FDA includes in their annual market
basket studies, but our results are consistent with the
agencies’ findings. In 2017 FDA detected one or more of
these four metals in 33 of 39 types of baby food tested (FDA
2019c).
2. BABIES ARE EXPOSED DAILY, WITH IMPACTS
TO HEALTH.
The four heavy metals we found in baby food have a
unique significance: All are developmental neurotoxins
(e.g., Grandjean and Landrigan 2006, Sanders 2015). They
can harm a baby’s developing brain and nervous system,
both in utero and after birth, for impacts that include the
permanent loss of intellectual capacity and behavioral
problems like attention-deficit hyperactivity disorder
(ADHD). All four metals are linked to IQ loss from exposures
early in life. The scientific evidence spans decades and
continues to build: at least 23 studies published in the past
seven years confirm these four heavy metals’ impacts to a
child’s healthy development (Appendix B). These metals
are so prevalent in foods eaten by babies and toddlers that
every child could be exposed daily to all three of the most
common heavy metals detected in food - lead, arsenic,
and cadmium - based on an analysis of federal surveys of
children’s dietary patterns and heavy metals levels in food
(Abt 2019b).
Baby food:
Cases of excessive heavy
metal contamination,
but few safety standards
Four of seven rice cereals tested:
Contain inorganic arsenic in excess of FDA’s
proposed limit of 100 ppb.
3. FEW SAFETY STANDARDS EXIST.
For 88 percent of baby foods tested by HBBF—148 of 168
baby foods—FDA has failed to set enforceable limits or issue
guidance on maximum safe amounts. In 2016 FDA proposed
limiting inorganic arsenic in infant rice cereal to 100 ppb
(FDA 2016). Inorganic arsenic exceeded this amount in four
of the seven infant rice cereals tested by HBBF (Appendix A).
FDA has also proposed limiting inorganic arsenic in apple
juice and has issued guidance for limiting lead in fruit juice,
but has failed to set specific limits for metals in any other
type of baby food (FDA 2013,2014).
W h a t 's i n m y B a b y 's Fo o d ? | h e a l t h y b a b y f o o d . o r g | 6
88 percent of foods tested:
Lack any federal standards or guidance on
maximum safe levels of toxic heavy metals like
arsenic and lead.
4. RECOMMENDED LIMITS ARE OFTEN EXCEEDED.
Arsenic exceeded FDA’s guidance level in four of seven
infant rice cereals tested. In the absence of protective
federal standards for other baby foods, public health
organizations have recommended limits and urged their
adoption by companies and FDA. Eighty-three percent
of baby foods tested had more lead than the 1-ppb limit
endorsed by public health advocates (EDF 2017). Recent
FDA tests also found heavy metals in baby food above
safe limits, including maximum allowable amounts for
children established by the European Food Safety Authority
and the U.S. Agency for Toxic Substances and Disease
Registry (Spungen 2019). Table 1 (page 12) shows other
exceedances.
5. POPULAR BABY FOODS ESTIMATED TO POSE
THE GREATEST RISK ARE AMONG THE MANY FOODS
THAT LACK SPECIFIC LIMITS FOR HEAVY METALS.
HBBF commissioned a new analysis from Abt Associates,
a nationally recognized toxicology and economic research
group, to accompany our laboratory tests. The work
included an assessment of IQ loss attributed to lead and
arsenic in baby food and provided food-by-food rankings
to show which foods are driving the bulk of the risk. Abt’s
analysis estimates that children age 0 to 24 months lose
more than 11 million IQ points from exposure to arsenic
and lead in food. Just 15 foods consumed by these children
account for 55 percent of the total estimated IQ loss. Heavy
metals in 10 of these foods are unregulated, lacking any FDA
guidance or regulation to limit the levels. Abt’s analysis is
described in Appendix E. The analysis considers all foods
consumed by children under 2, from store-bought and
homemade foods for babies to the wider range of packaged
and homemade foods that toddlers eat.
Milk and infant formula appear on the list of 15 foods
not because of high metals levels—arsenic and lead
concentrations are relatively low in both compared to some
other types of baby food, according to HBBF and FDA tests—
but because American children drink so much of them.
These are nutritious foods, and there is no action needed
Results of IQ analysis: 15 foods account for 55% of total IQ loss from children’s dietary exposures
to arsenic and lead in baby food
Food consumed by child age 0 - 24 months
Percent of total harm (fraction of
total IQ points lost for children under
2, from lead and arsenic in food)
Primary toxic metal
of concern
Rice dishes, including with beans & veggies
10.0%
Arsenic
Milk, whole*
8.4%
Arsenic
Rice, white and brown
7.0%
Arsenic
Apple juice
6.1%
Arsenic
Infant formula*
5.3%
Lead
Fruit juice blend (100% juice)
4.1%
Arsenic
Infant rice cereal
2.7%
Arsenic
Grape juice
2.0%
Lead and arsenic
Cheerios and other oat ring cereals
1.6%
Arsenic
Sweet potato (baby food)
1.6%
Lead and arsenic
Soft cereal bars and oatmeal cookies
1.4%
Arsenic
Macaroni and cheese
1.4%
Lead and arsenic
Puffs and teething biscuits
1.3%
Lead and arsenic
Bottled drinking water
1.2%
Arsenic
Fruit yogurt
1.2%
Lead
*Note: Milk and infant formula appear on the list not because of high metals levels — arsenic and lead concentrations are relatively low in both compared to some other
types of baby food, according to HBBF and FDA tests — but because American children drink so much of them. These are nutritious foods, and there is no action needed
by parents to change what they serve their children.
Source: HBBF-commissioned analysis of federal data in national surveys of food contamination and consumption (see Appendix E and Abt 2019b for details).
by parents to change what they serve their children. But
FDA action to set limits in milk and formula for arsenic and
lead—and cadmium as well, which is often detected—would
create benefits extending to millions of children.
Similarly, bottled water appears on the list not because high
metals levels are common, but because so many children
drink it. Bottled water is no safer than filtered tap water and
generates plastic waste that is easily avoided by choosing
tap water.
W h a t 's i n m y B a b y 's Fo o d ? | h e a l t h y b a b y f o o d . o r g | 7
Two results stand out from the IQ analysis. First, during
the first two years of life, American children lose four times
more IQ points from arsenic contamination in food than
from lead contamination. Second, rice-based foods—
including infant rice cereal, rice dishes and rice-based
snacks—contribute nearly one-fifth of the total estimated
IQ loss. These results show a crucial need for swift action
from FDA and baby food companies to dramatically reduce
arsenic levels in rice-based foods.
6. ADDITIONAL BABY FOOD TESTS BY
HBBF DETECTED ANOTHER NEUROTOXIC
CONTAMINANT—PERCHLORATE.
HBBF’s tests uncovered one additional neurotoxin in food. We
sent new containers of 25 of the foods tested for heavy metals
to a separate laboratory, to be analyzed for a neurotoxic
pollutant called perchlorate. The lab detected it in 19 of 25
foods tested (Appendix D and SWRI 2019). All 19 foods with
detectable perchlorate also contained heavy metals, and 12
contained all four heavy metals included in our tests.
Perchlorate disrupts thyroid functions crucial to brain
development and has been linked to IQ loss among
children born to mothers with thyroid dysfunction, who
are more vulnerable to perchlorate toxicity (Taylor 2014).
It is a rocket fuel component used since the Cold War. In
2005 FDA approved its use as an antistatic in plastic food
packaging, and in 2016 expanded the approval to cover dry
food handling equipment. Perchlorate is also a degradation
product of hypochlorite used to disinfect food processing
equipment. Levels in children’s food increased dramatically
from 2005 to 2012 (Abt 2016, EDF 2017b).
Our tests did not find the high spikes seen previously (EDF
2017b), but our results suggest a prevalence that could pose
risks during pregnancy and infancy. The results support
the need for FDA to ban all food uses, especially given that
perchlorate adds to neurodevelopmental risks already
imposed by the heavy metal contamination in baby food.
7. EXPOSURES AND IMPACTS ADD UP,
INCREASING URGENCY FOR ACTION.
Heavy metals and perchlorate are not the only food
contaminants raising the specter of IQ loss and other
neurodevelopmental deficits for babies. Among recent
examples, apples and spinach are often tainted with
organophosphate pesticides, cheeses including mac
‘n’ cheese powder contain phthalate plasticizers, and
New tests by HBBF find
perchlorate contamination
in 19 of 25 baby foods
Number of baby foods with perchlorate, of total
tested (and maximum level found):
Infant rice cereal:
2 of 5 - 7.1 ppb
Other infant cereals:
9 of 9 - 7.8 ppb
Infant formula:
2 of 3 - 11.4 ppb
Fruits & vegetables:
4 of 4 - 19.8 ppb
Snacks:
2 of 4 - 4.6 ppb
See Appendix D for details. “ppb” = parts per billion, or micrograms
per kilogram.
a wide range of breakfast cereals, grains and beans are
contaminated with the pesticide glyphosate (Roundup).
All of these pollutants and pesticides are neurotoxic
or linked to babies being born small (from mothers’
exposures), with resulting risks for lower IQ and other
neurological or behavioral impacts (e.g., FlensborgMadsen 2017, Parvez 2018, Gillam 2017, FOE 2019, EWG
2019 and 2020, CSFPP 2017).
8. ACTIONS NEEDED BY FDA AND BABY FOOD
COMPANIES GO BEYOND HEAVY METALS.
Exposures and impacts add up. The new analysis of
children’s IQ loss (Abt 2019b) provides a starting point
for understanding these combined impacts. It considers
one health impact—IQ loss—associated with 2 metals in
food, arsenic and lead. Mercury in baby food would also
contribute to IQ loss, and preliminary data suggests that
cadmium would as well; for these metals, data were not
W h a t 's i n m y B a b y 's Fo o d ? | h e a l t h y b a b y f o o d . o r g | 8
yet available to assess the IQ drop expected with each
successive exposure for a child. Those data are urgently
needed. And other neurotoxic pollutants in food would add
to the cumulative impacts, each time a child eats.
For parents, the answer is not switching to homemade
purees instead of store-bought baby foods. Federal data
shows that baby food sometimes has higher levels and
sometimes lower levels of heavy metals, compared to
comparable fresh or processed foods purchased outside
the baby food aisle. For example, peaches and green
beans from the baby food aisle are less likely to contain
detectable levels of lead than canned versions of these
foods, while carrot and sweet potato baby foods have
higher lead detection rates than their peeled, fresh
counterparts (EDF 2019b).
In most cases it’s not the amount of a particular
contaminant in baby food that causes concern. Our tests
show that most metals are at low levels and by themselves
in any given food raise little concern. It’s babies’ daily
exposures to the many neurotoxins in baby foods that
drive the urgency for action. When FDA and baby food
companies address one contaminant in one type of food,
children benefit. But truly protecting children necessitates
addressing the many contaminants that collectively harm a
child’s healthy development. HBBF supports the FDA’s and
baby food companies’ efforts to continually lower the levels
of heavy metals and other neurotoxic contaminants in all
baby foods. Specific recommendations include:
FDA:
HBBF agrees with the mission of FDA’s Toxic Elements
Working Group to reduce exposures to the greatest extent
possible. We urge the agency to:
• Set health-protective standards for heavy metals,
prioritizing foods that offer FDA the greatest opportunity
to reduce exposure, considering additive effects of
the multiple metals detected in foods, and explicitly
protecting against neurodevelopmental impacts.
• Strengthen and finalize standards for arsenic in apple
juice and infant rice cereal, and expand the range of
foods covered. HBBF supports recommendations for
a 3-ppb inorganic arsenic standard and 1-ppb lead
standard that apply to all fruit juice, and a healthprotective standard for arsenic in infant rice cereal and
all other rice-based foods.
• Implement a proactive testing program for heavy metals
in foods consumed by babies and toddlers, similar to
the Consumer Product Safety Commission’s program for
children’s toys (CPSC 2019).
Baby food companies:
HBBF is a member of the Baby Food Council and supports its
goal to reduce heavy metals in baby food to levels as low as
reasonably achievable. Other companies can join this effort,
as described below from the organization’s charter:
The Baby Food Council is a group of infant and toddler
food companies, supported by key stakeholders, seeking
to reduce heavy metals in the companies’ products to
as low as reasonably achievable usage best-in-class
management practices. The Council was created in
January 2019 in partnership with Cornell University and
the Environmental Defense Fund. All companies that
source ingredients, manage the upstream supply chain,
and nationally market foods for children six to 24 months
of age in the United States are welcome to participate
in the Council. Since its creation, Healthy Babies Bright
Futures has joined the Council as a member and the
American Academy of Pediatrics and the Food and Drug
Administration have agreed to serve as technical advisors
to the effort. For more information, contact Randy Worobo
of Cornell University at
– The Baby Food Council, 2019
• Ensure lead is not present in food contact materials
where it could get into food.
• Establish a goal of no measurable amounts of cadmium,
lead, mercury, and inorganic arsenic in baby and
children’s food, in recognition of the absence of a known
safe level of exposure, and work with manufacturers to
achieve steady progress.
HBBF urges all baby food companies to establish
a goal of no measurable amounts of cadmium,
lead, mercury, and inorganic arsenic in baby and
children’s food, in recognition of the absence of a
known safe level of exposure, and to achieve steady
progress toward that goal.
W h a t 's i n m y B a b y 's Fo o d ? | h e a l t h y b a b y f o o d . o r g | 9
0
WHAT PARENTS CAN DO
An abundance of online advice instructs parents on ways to reduce children’s exposures to heavy metals in foods. HBBF has
streamlined those tips down to simple actions that cover five foods posing high risks to babies’ neurological development,
based on Abt’s new analysis (Abt 2019b). This allows parents to focus on changes that are estimated to provide the greatest
benefit for babies’ brains.
Note: For each pair of foods shown, concentrations shown and the comparative term “less toxic metals” is based on the average
of the sum of four metals (inorganic arsenic, lead, cadmium and mercury) for the available samples of each food, unless noted
otherwise. Averages were computed using data from the current study combined with data from FDA’s market basket study (the
Total Diet Study, FDA 2014-2017). The abbreviation “ppb” refers to parts per billion.
➊
40
60
80
100
Puff snacks (rice)
98 ppb Rice cereal
Infant
85 ppb
THE SAFER FOOD CHOICES OUTLINED HERE HAVE 80 PERCENT LOWER HEAVY METAL LEVELS,
ON AVERAGE, THAN THE HIGHER RISK FOODS.
Puffs and other snacks made with rice flour
contain arsenic, lead and cadmium at relatively high
levels compared to other baby foods. Parents can reduce
children’s exposures by choosing rice-free packaged snacks
instead, which have 93 percent less toxic metal residues,
on average. Multi-grain snacks that include rice would also
have lower levels than snacks containing rice as the only
grain. Other alternatives come from Consumer Reports,
which recommends snacks that are rich in nutrients and
low in metals, and that can be prepared and served to be
appropriate for young children (such as soft-cooked, diced
or mashed): apples, applesauce (unsweetened), bananas,
barley with diced vegetables, beans, cheese, grapes (cut
lengthwise), hard-boiled eggs, peaches, and yogurt (CR
2018). A caveat for non-rice snacks—HBBF tests showed
lower metals levels in non-rice snacks, including crackers,
bars and yogurt snacks, but federal data shows relatively
high arsenic in a popular snack we did not test: oat ring
cereals like Cheerios (FDA 2019c). We recommend avoiding
this choice for snacks.
20
➊ SNACKS
➋
Teething biscuits and rice rusks often contain
arsenic, lead, and cadmium. They also lack
nutrients and can cause tooth decay. Doctors and
dentists recommend other solutions for baby teething
pain (Colgate 2020, AAP 2020). Options include a frozen
banana, a peeled and chilled cucumber, a clean, cold
wet washcloth or spoon. Healthcare professionals advise
parents to stay with their baby to watch for any choking.
Rice-free
baby
snacks
Other
Infant
7.1 ppb
Cereals
14 ppb
0
20
40
60
80
100
0
20
40
60
80
100
➋ TEETHING FOODS
Infant Rice
cereal
Teething
biscuits
85rice
ppbrusks
&
Puff snacks (rice)
64
98 ppb
ppb
Other
soothing
Other
Infant
foods
for
Cereals
Rice-free
teething
14snacks
ppb
baby
6.0
ppb
7.1 ppb
➌
Infant rice cereal is the top source of arsenic in
infant’s diets. HBBF’s 2017 study of infant cereals
found that non-rice and multi-grain varieties on grocery
shelves nationwide—including oatmeal, corn, barley,
quinoa, and others—contain 84 percent less inorganic
arsenic than leading brands of infant rice cereal, on average.
Federal data shows 64 percent less total heavy metals,
on average, in infant non-rice cereals compared to rice
varieties. The alternates include reliable and affordable
choices for parents seeking to reduce infants’ exposures to
arsenic (HBBF 2017a).
Rice is a leading source of arsenic exposure for young children. Parents can serve other grains like oats, wheat and
barley instead of rice to help cut their family’s exposures. Cooking rice in extra water that is poured off before serving
can cut the arsenic levels by up to 60 percent, according to FDA studies (FDA 2016). The lowest arsenic levels are found
in basmati rice grown in California, India, and Pakistan. White rice has less arsenic than brown rice. Rice from Arkansas,
Louisiana, Texas, or simply “U.S.” has the highest levels, according to testing by Consumer Reports (CR 2014).
0
0
0
20
20
20
40
40
40
84% less
less
91%
(inorganic)
Arsenic
93%
toxic less
heavy
metals
toxic heavy metals
60
60
60
80
80
80
100
100
100
➌ CEREAL
Carr
28 p
Teething biscuits
Fruit
& riceJuice
rusks
8.2
ppb
64 ppb
Infant Rice cereal
85 ppb
0
0
W h a t 's i n m y B a b y 's Fo o d ? | h e a l t h y b a b y f o o d . o r g | 1 0
93% less
toxicless
heavy metals
84%
Arsenic (inorganic)
Other soothing
Tapfoods
Water
for
2.6teething
ppb
(typical)
Other Infant
6.0 ppb
Cereals
14 ppb
Swe
19 p
91% less
68%
toxic heavy metals
84% less
Arsenic (inorganic)
20
2
40
4
60
6
80
8
100
10
20
40
60
80
100
Fruit Juice
8.2 ppb
Othe
Vegg
7.4 pp
0
Carr
28 p
6.0 ppb
)
0
100
20
40
60
80
100
➍
➍ DRINKS
Fruit Juice
8.2 ppb
Tap Water
2.6 ppb
(typical)
68% less
toxic heavy metals
etals
0
2
4
6
8
10
100
Sweet Potato (Baby Food)
19 ppb
5
10
15
20
25
30
Up to 73% less
toxic heavy metals
Other Fruits &
Veggies (Baby Food)
7.4 ppb
0
10
Carrots and sweet potatoes are a great source of
Vitamin A and other nutrients your baby needs. But
they also contain higher levels of lead and cadmium than
other fruits and vegetables, on average. Yet they are an
important part of a child’s diet, and a common baby food
ingredient. Variety is the solution: parents can serve these
vegetables along with other fruits and vegetables during the
week, for benefits without the excess risk.
Carrot (Baby Food)
28 ppb
10
5
➎
➎ FRUITS & VEGGIES
etals
0
Apple, pear, grape and other fruit juices contain
traces of lead and arsenic. Levels aren’t as high as in
some other
Carrot
(Babyfoods,
Food)but toddlers drink juice often, so it’s a
exposure source. Tap water is a better drink for thirsty
28top
ppb
toddlers. Another alternative is whole or pureed fruits
(like applesauce), which offer more fiber and nutrients than
Sweet
(BabyAcademy
Food) of Pediatrics warns parents
juice. Potato
The American
19ofppb
juice’s high caloric and sugar content. It advises no fruit
juice for children under 1 year of age, and half a cup or less
daily for children under 3. AAP recommends that if fruit
Other Fruits &
Up to 73% less
juice is(Baby
given, Food)
it should be offered as part of a meal, not
Veggies
toxic heavy metals
7.4diluted
ppb with water and sipped over time, because of tooth
decay risks (AAP 2017b, Heyman 2017).
15
20
25
30
W h a t 's i n m y B a b y 's Fo o d ? | h e a l t h y b a b y f o o d . o r g | 1 1
Table 1: Three take-aways:
Our research substantiated the widespread presence of four toxic heavy metals in baby foods, almost no enforceable federal standards to limit what’s
allowed, and the common occurrence of arsenic and lead in excess of recommended levels to protect children’s health.
What did
our tests of 168
baby foods find?
1. Widespread detections of toxic heavy metals
2. Few enforceable limits for baby food
For 10 of 13 baby food types tested, there is no FDA guidance
on safe limits for toxic heavy metals.
83% of baby foods tested had more lead than the 1-ppb limit endorsed by public health advocates.
Arsenic exceeded FDA’s guidance level in 4 of 7 infant rice cereals tested.
Our tests found four toxic heavy metals in baby food
( = detected)
Has FDA issued a safe limit for toxic heavy metals in the baby foods we tested?
Limits endorsed by health organizations are also shown.
Did our test results exceed recommended safe limits for baby food?
( = safe level exceeded in HBBF tests)
95 percent of baby foods tested were contaminated with one or more toxic heavy metals,
including arsenic and lead. No food type was free of contamination.
Arsenic
Lead
Cadmium
Mercury
Puffs and other snacks
Teething biscuits,
including rice rusks
19 of 21 foods
21 of 21 foods
19 of 21 foods
14 of 21 foods
10 of 10 foods
10 of 10 foods
10 of 10 foods
10 of 10 foods
Meals (veggies, grains,
pasta, meat combos)
8 of 13 containers
13 of 13 containers
8 of 13 containers
1 of 13 containers
7 of 7 cereals
7 of 7 cereals
7 of 7 cereals
7 of 7 cereals
11 of 11 cereals
10 of 11 cereals
11 of 11 cereals
2 of 11 cereals
Cadmium
Mercury
No
No
No
1 ppb (EDF)
10 of 10 foods
10 of 10 foods
38 of 38 containers
34 of 38 containers
Yes - limits:
No
1 ppb (EDF)
5 of 16 containers
3 of 16 containers
10 of 14 containers
14 of 14 containers
12 of 14 containers
3 of 14 containers
1 of 6 jars
5 of 6 jars
3 of 4 juices
4 of 4 juices
4 of 5 juices
4 of 5 juices
2 of 5 juices
3 of 5 drinks
4 of 5 drinks
2 of 5 drinks
Apple juice
No
No
No
No
No
No
No
No
No
1 of 6 jars
1 of 6 jars
None found
None found
Yes - limits:
Yes - limits:
No
0 of 4 juices
0 of 4 juices
10 ppb (FDA)
3 ppb (CR)
50 ppb (FDA)
1 ppb (AAP)
1 ppb (CR)
Juice - 100% fruit, non-apple
No
Yes - limits:
No
0 of 5 juices
3 ppb (CR)
50 ppb (FDA)
1 ppb (AAP)
1 ppb (CR)
None found
0 of 5 drinks
No
No
No
W h a t 's i n m y B a b y 's Fo o d ?1 ppb
| h(EDF)
ealthybabyfood.org | 12
No limit exists
No limit exists
All 10 foods exceed 1
ppb limit.
No limit exists
No limit exists
12 of 13 containers
exceed 1 ppb limit.
No limit exists
7 cereals tested. 4
exceed FDA limit. 7
exceed HBBF limit.
All 7 cereals exceed 1
ppb limit.
No limit exists
No limit exists
9 of 11 cereals exceed 1
ppb limit.
No limit exists
No limit exists
All 10 meals exceed 1
ppb limit.
No limit exists
No limit exists
33 of 38 containers
exceed 1 ppb limit.
No limit exists
No limit exists
8 of 16 containers
exceed 1 ppb limit.
No limit exists
No limit exists
11 of 14 containers
exceed 1 ppb limit.
No limit exists
No limit exists
2 of 6 jars exceed 1 ppb
limit.
No limit exists
4 juices tested. 0 exceed
FDA’s 10 ppb limit. 2
exceed a 3 ppb limit.
4 juices tested. 0 exceed
FDA’s 50 ppb limit. 1
exceeds 1 ppb limit.
4 juices tested. 0 exceed
1 ppb limit.
5 juices tested. 2 exceed
3 ppb limit.
5 juices tested. 0 exceed
FDA’s 50 ppb limit. 3
exceed AAP limit.
5 juices tested. 0 exceed
1 ppb limit.
No limit exists
2 of 5 drinks exceed 1
ppb limit.
No limit exists
No
No
No
No
1 ppb (EDF)
None found
All 21 foods exceed 1
ppb limit.
No
1 ppb (EDF)
No
Meat (jars)
No
No limit exists
«
No
«
No
No
Information on safety standards and recommended limits can be found in these references: FDA – 100 ppb arsenic in infant rice cereal (FDA 2016); HBBF (Healthy Babies Bright Futures) – 25 ppb arsenic in infant rice cereal (HBBF 2017a,b); FDA – 10 ppb arsenic in apple juice (FDA 2013); CR (Consumer Reports) – 3 ppb arsenic in apple and other fruit juice (CR 2019a,b);
FDA – 50 ppb limit for lead in fruit juice (FDA 2004); CR and EDF (Environmental Defense Fund) – endorsement of AAP (American Academy of Pediatrics) 1-ppb lead-in-water limit to apply to fruit juice (CR 2019a,b; AAP 2017a); EDF – goal of 1 ppb for lead in baby food (EDF 2017a).
W h a t 's i n m y B a b y 's Fo o d ? | h e a l t h y b a b y f o o d . o r g | 1 2
Mercury
No
1 ppb (EDF)
No
Mixed fruits and veggies
No
Cadmium
No
1 ppb (EDF)
No
10 of 16 containers
No
No
Lead
No
1 ppb (EDF)
9 of 38 containers
8 of 16 containers
No
Arsenic
No
1 ppb (EDF)
2 of 10 foods
Fruits
No
100 ppb (FDA)
25 ppb (HBBF)
No
25 of 38 containers
No
1 ppb (EDF)
No
7 of 10 foods
No
1 ppb (EDF)
No
Veggies
Other drinks for
babies and toddlers
Lead
No
No
Infant rice cereal
Infant cereal - multi &
single non-rice grains
Arsenic (inorganic)
No
Infant formula
3. Gaps in protecting babies’ health
No limit has been set
for mercury in baby
food, but levels are
low compared to
amounts in canned
tuna and other
seafood.
HEALTH RISKS: THE SCIENTIFIC EVIDENCE
Fresh research continues to confirm widespread exposures
and troubling risks for babies exposed to the four heavy
metals included in this study, including at least 23 peerreviewed studies published in the past seven years
revealing IQ loss, attention deficits, and other learning
and behavioral impacts among children who are exposed
through food and other sources (Appendix B). Three of the
metals, arsenic, lead and cadmium, are also potent human
carcinogens.
Widespread exposure to toxic heavy metals shifts the
population-wide IQ curve down. It nudges more children
into special education, and ratchets down the IQ of the
most creative and intellectually gifted children. For an
individual child, the harm appears to be permanent (e.g.,
Grandjean and Landrigan 2014, Wasserman 2007 and 2016,
Hamadani 2011).
Instead of overt poisoning, the low, daily exposures
children face from heavy metals in food and other sources
create “subclinical decrements in brain function” with
impacts on a global scale. Scientists write that the
exposures “diminish quality of life, reduce academic
achievement, and disturb behaviour, with profound
consequences for the welfare and productivity of entire
societies” (Grandjean and Landrigan 2014).
ARSENIC
Arsenic widely contaminates food and drinking water from
its long-time use as a pesticide and an additive in animal
feed, from its release at mining and industrial operations,
and from natural sources. Arsenic causes bladder, lung
and skin cancer and also harms the developing brain and
nervous system. But arsenic also targets the developing
brain. In the peer-reviewed scientific literature, at least 13
studies link arsenic to IQ loss for children exposed in utero or
during the first few years of life (Rodriguez-Barranco 2013).
Among evidence supporting arsenic’s ability to harm the
brain is a 2014 assessment of nearly 300 third to fifth graders
in Maine, finding an average loss of 5-6 IQ points among
those who drank well water contaminated with arsenic at or
above 5 parts per billion. This level is common in some parts
of the U.S. and is lower than the legal limit in public water
supplies (10 parts per billion) (Wasserman 2014). Studies
find lasting impacts when children are exposed to arsenic
early in life, including persistent IQ deficits in children two
years after their polluted drinking water was replaced,
cognitive deficits among school-age children exposed
early in life, and neurological problems in adults who were
exposed to arsenic-poisoned milk as infants (Wasserman
2007 and 2016, Hamadani 2011, Tanaka 2010). There is no
evidence that the harm caused by arsenic is reversible.
LEAD
Over the past 40 years lead has been restricted in children’s
toys and phased out of gasoline, pesticides, paint, and food
contact surfaces, including lead solder from cans. But lead
that lingers in homes, soil, and water remains a festering
problem. The toxic metal continues to contaminate the
blood of nearly every child tested. Although exposures are
lower now than in the past, lead-induced brain damage still
accounts for an estimated 23 million IQ points lost among
children under five (Bellinger 2012). Even very low exposure
W h a t 's i n m y B a b y 's Fo o d ? | h e a l t h y b a b y f o o d . o r g | 1 3
levels cause lower academic achievement, attention
deficits and behavior problems. No safe level of exposure
has been identified.
Evidence of lead’s toxicity spans decades. Among recent
studies are two that included 80,000 Detroit and Chicago
school children, 3rd grade through middle school, whose
standardized math and reading tests were correlated to
their blood lead levels measured at birth or early childhood.
“Early childhood lead exposure is associated with poorer
achievement… even at very low blood lead levels,” concluded
one of the research teams (Zhang 2013, Evens 2015).
Lead widely contaminates food from its long-time use as
a pesticide, its presence in food processing equipment (in
older brass, bronze, plastic, and coated materials), and
its presence at elevated levels in soil, either natural or
accumulated from industrial pollution. In October 2018
FDA cut in half its maximum daily intake limit for lead in
children’s food. An estimated 2.2 million children six years
or younger exceed the new intake limit (EDF 2019a).
Beyond Food:
Other sources of lead exposure
For many children the biggest source of lead
exposure is not food, but lead paint in homes built
before 1978. Lead from chipping and peeling paint
builds up in house dust and sticks to children’s
hands. It also flakes off of a home’s exterior to
contaminate soil in the yard.
To learn if you have lead paint, have your home
inspected by a licensed lead inspector. You can also
use a simple test kit sold at many hardware stores.
Learn more: />
CADMIUM
MERCURY
Cadmium is a heavy metal linked to neurotoxicity and
cancer, and to kidney, bone and heart damage. It has many
industrial uses and is a common contaminant in food and
the environment. It lacks the name recognition of arsenic
and lead, but may deserve an equal share of attention from
parents, companies, and regulators, since it also displays a
troubling ability to cause harm at low levels of exposure.
Mercury is a global pollutant released from coal-fired
power plants, mining operations and other sources. It
contaminates the biosphere and the food chain. Seafood
is the dominant source of mercury exposure for children
and adults. It contains a particularly toxic form of mercury
called methylmercury that increases risk for cardiovascular
disease for adults and poor performance on tests of vision,
intelligence, and memory for children exposed in utero.
A 2015 review of recent scientific literature identified 16
studies on the neurotoxic impacts of cadmium on children.
Among these is research by Harvard scientists reporting a
tripling of risk for learning disabilities and special education
among children with higher cadmium exposures, at levels
common among U.S. children and previously thought to be
safe (Ciesielski 2012).
A 2019 study by FDA found that cadmium in food exceeds
amounts safe for children: In its 2014-2016 market basket
tests, FDA detected cadmium in 65 percent of nearly 3000
food samples tested, and estimated that children’s average
exposures exceed safe limits established by both the
European Food Safety Authority and the U.S. Agency for Toxic
Substances and Disease Registry (Spungen 2019).
Evidence that the developing brain is particularly sensitive
to mercury extends back decades, covering two mass
poisonings and major longitudinal studies of lower
exposures from seafood, among other research (NAS
2000). Recently, scientists found a four-fold higher risk
for IQ scores under 80, the clinical cut-off for borderline
intellectual disability, among school-age children exposed
to high levels of mercury in utero (Jacobsen 2015).
Although mercury was detected in 32 percent of the 168
baby foods tested in this study, levels were far lower than
typical amounts in tuna and other seafood. FDA and EPA’s
joint advisory gives safer seafood choices for pregnant
women and young children (EPA and FDA 2019). A number
of NGOs have published more conservative advice to
protect women who eat seafood frequently (EWG 2014,
MBASW 2020). Mercury levels in canned tuna exceed
the legal limit under California’s Proposition 65, but an
attempt to require the law’s mandated warnings on canned
tuna failed in 2006 when an appeals court found that the
California law was preempted by the FDA/EPA seafood
advisory (Kone 2006).
W h a t 's i n m y B a b y 's Fo o d ? | h e a l t h y b a b y f o o d . o r g | 1 4
SAFETY STANDARDS
The four toxic metals covered in this study—
arsenic, lead, cadmium and mercury—were
regulated decades ago in sources as wideranging as drinking water, gasoline and
children’s toys.
Regulations have also eliminated lead from food contact
surfaces, including lead solder from food cans (Bolger
1996). But they remain without an enforceable limit or
guideline in nearly every type of baby food, despite being
widely acknowledged as toxic during a child’s development
and prevalent in popular baby and toddler foods.
All four metals are neurotoxic. Three—arsenic, lead and
mercury—have been shown to permanently reduce
children’s IQ. Three are also human carcinogens, arsenic,
cadmium and lead.
FDA can use its testing programs, recall authority, and
guidance to industry, among other tools, to characterize
and control heavy metal levels in food. The agency tests
a fraction of imported food in their Import Program,
prioritizing food likely to pose risks to consumers, including
those with high heavy metals levels. Federal law gives
FDA the authority to require a recall of food it deems to
be adulterated, that “bears or contains any poisonous or
deleterious substance which may render it injurious to
health,” including heavy metals. In the past three years
FDA has issued recalls for eight foods with excessive lead
or arsenic, none of which were baby foods (FDA 2019d). In
September 2019 the agency issued an import alert for lead
and arsenic in grape and pear juice concentrates, advising
their inspectors to target these products for testing (FDA
2019e).
FDA also tests a variety of foods on store shelves in their
Total Diet Study market basket program, focusing on foods
that are commonly eaten or likely to have high levels of
metals (FDA 2019c). FDA’s compliance program conducts
occasional testing programs that target select, high-risk
foods. These data have helped FDA prioritize its work to
reduce heavy metals levels in baby food.
In 2016 FDA proposed limiting inorganic arsenic in infant
rice cereal to 100 ppb (FDA 2016). Inorganic arsenic
exceeded this amount in four of the seven infant rice cereals
tested by HBBF.
FDA has also proposed limiting inorganic arsenic in apple
juice and has issued guidance for limiting lead in fruit juice
(FDA 2004, 2013), but has failed to set limits for metals in
any other type of baby food.
Despite FDA’s many areas of authority and its recent
emphasis on reducing exposures to heavy metals, for 88
percent of baby foods tested by HBBF—148 of 168 baby
foods—FDA has failed to set enforceable limits or issue
guidance on maximum safe amounts.
And none of the agency’s existing guidance considers the
additive neurological impacts of multiple metals in baby
food.
W h a t 's i n m y B a b y 's Fo o d ? | h e a l t h y b a b y f o o d . o r g | 1 5
FDA’S PROPOSED GUIDANCE FOR ARSENIC
IN INFANT RICE CEREAL REMAINS UNFINALIZED
DESPITE PROMISES TO COMPLETE IN 2018.
FDA’s 2016 proposed limit for inorganic arsenic in infant rice
cereal—its 100 parts-per-billion “action level”—falls short of
what is needed to protect children. In proposing the level,
FDA did not consider IQ loss or other forms of neurological
impact, allowed cancer risks far outside of protective limits,
and failed to account for children who have unusually high
exposures to arsenic in rice (HBBF 2016, HBBF 2017a).
And if the agency finalizes the action level, it will serve only as
guidance to the infant cereal industry, not as a standard that
FDA is required to enforce. Instead, FDA can choose whether
or not to enforce an action level, at its own discretion.
HBBF has advocated that FDA finalize a more protective
standard that protects against neurological harm during
development and that applies to all rice-based foods eaten
by babies and pregnant women. HBBF has also called on
cereal companies to reduce levels to 25 ppb, an amount
typical of levels in multi-grain cereals (HBBF 2017a,b).
Altogether, six of 30 rice-based baby foods tested by HBBF
contained inorganic arsenic above the 100-ppb limit
proposed for infant rice cereal—four infant rice cereals and
two puff snacks (Appendix A).
FDA’S PROPOSED GUIDANCE FOR ARSENIC
IN APPLE JUICE REMAINS UNFINALIZED DESPITE
PROMISES TO COMPLETE IN 2018.
In 2013 FDA proposed limiting inorganic arsenic in apple
juice to 10 ppb, the federal government’s standard for
arsenic in drinking water (FDA 2013). This limit still has not
been finalized. Consumer Reports, a long-time advocate
for reducing toxic metals in food, has argued for a more
protective limit of 3 ppb, and for inclusion of other higharsenic juices, like grape and pear juice (CR 2019a,b).
Arsenic in juice exceeded CR’s recommended limit of 3 ppb
in two of nine juices tested by HBBF, a white grape juice and
an apple juice.
FDA has also issued guidance to limit lead in fruit juice
(FDA 2004). This level, 50 ppb, is 3.3 times higher than the
federal drinking-water action level, 10 times more than the
FDA’s bottled-water standard, and 50 times higher than the
American Academy of Pediatrics’ recommended lead-inwater limit for school drinking fountains.
Experts at Consumer Reports and the Environmental
Defense Fund back a far lower limit, arguing for a 1-ppb
cap to match the American Academy of Pediatrics’
recommended maximum for lead in school drinking
fountains (CR 2019a,b; AAP 2017).
While none of the fruit juices tested by HBBF topped FDA’s
50-ppb limit, four of nine juices contained more lead than
the recommended 1 ppb cap, with a maximum of over 11
ppb in a white grape juice marketed for toddlers. At these
levels, the many children who regularly drink juice are
getting too much lead. Eighty percent of American families
with toddlers and babies serve juice to children. Threequarters of those families serve it daily; their children face
the highest risks (CR 2019b).
PROMISING PROGRESS AT FDA
In April 2017 FDA’s Center for Food Safety and Applied
Nutrition (CFSAN) announced it had established a Toxic
Elements Working Group to modernize safety standards
for the toxic metal mixtures Americans are exposed to,
including in food. The working group is charged with
charged with “achiev[ing] the public health goal of reducing
exposure… to the greatest extent possible” (FDA 2017,
2018a,b).
Although FDA has not yet introduced new standards as a
result of the initiative, it has made progress. It has lowered
the maximum allowed daily lead intake for children from
6 to 3 micrograms per day (ug/day) and set a cap of 12.5
ug/day for women who are pregnant or nursing. These
new “Interim Reference Levels” are a critical first step for
lowering allowable lead levels in food (FDA 2019b). FDA
has also launched new research to understand children’s
exposures to combinations of metals, and the impacts of
these mixtures on the developing brain and nervous system
(e.g., Spungen 2019). The agency missed its commitment
to finalize the arsenic guidelines for infant rice cereal and
apple juice by the end of 2018.
Heavy metal mixtures like those found in baby food
pose risks to the developing brain. Setting protective,
health-based limits for these contaminants presents an
opportunity to make a significant difference in children’s
health.
W h a t 's i n m y B a b y 's Fo o d ? | h e a l t h y b a b y f o o d . o r g | 1 6
REFERENCES
Abt E, Spungen J, Pouillot R, Gamalo-Siebers M, Wirtz M. 2016. Update
on dietary intake of perchlorate and iodine from U.S. food and drug
administration’s total diet study: 2008-2012. J Expo Sci Environ Epidemiol.
2018 Jan;28(1):21-30. doi: 10.1038/jes.2016.78. Epub 2016 Dec 14.
Abt 2019a (Abt Associates). Results of NHANES/TDS Lead Analysis using
Xue et al. (2010) Method (revised). Study commissioned by Environmental
Defense Fund (EDF). EDF summary: />fda-reduces-limit-lead-childrens-food/. Abt summary: />health/files/2019/01/Abt-Lead-in-Food-Exposure-Analysis-FDA-TDS-20142016-Xue-LOD-revised-1-7-19.pdf/.
Abt 2019b (Abt Associates). Results of NHANES/TDS Analysis of IQ loss
analysis from children’s exposures to lead and arsenic in baby food. Study
commissioned by Healthy Babies Bright Futures.
AAP 2020 (American Academy of Pediatrics). A pediatric guide to children’s
oral health. Flip chart. />
CR 2019b (Consumer Reports). Letter from Jean Halloran, CR’s Director
of Food Policy Initiatives and James E. Rogers, Ph.D., CR’s Director of
Food Safety Research and Testing, to The Honorable Scott Gottlieb, M.D.,
Commissioner, U.S. Food and Drug Administration. January 30 2019. http://
article.images.consumerreports.org/prod/content/dam/CRO%20Images%20
2019/Health/01January/Consumer%20Reports%20Letter%20to%20FDA%20
on%20Heavy%20Metals%20in%20Juices%201-30-19.
CR 2018 (Consumer Reports). Heavy Metals in Baby Food: What You Need
to Know. Consumer Reports’ testing shows concerning levels of arsenic,
cadmium, and lead in many popular baby and toddler foods. https://www.
consumerreports.org/food-safety/heavy-metals-in-baby-food/.
CR 2014 (Consumer Reports). How much arsenic is in your rice? Consumer
Reports’ new data and guidelines are important for everyone but especially
for gluten avoiders. Consumer Reports Magazine, Nov 2014. https://www.
consumerreports.org/cro/magazine/2015/01/how-much-arsenic-is-inyourrice/index.htm.
EWG 2020 (Environmental Working Group). Glyphosate: The cancer-causing
chemical found in children’s cereal. />glyphosate.AAP 2020 (American Academy of Pediatrics). A Pediatric Guide
to Children’s Oral Health. />aap-health-initiatives/Oral-Health/Documents/OralHealthFCpagesF2_2_1.
pdf.
EWG 2019 (Environmental Working Group). Glyphosate Contamination
in Food Goes Far Beyond Oat Products. />EWG 2014 (Environmental Working Group). EWG’s Consumer Guide to
Seafood. />FDA 2019a (U.S. Food and Drug Administration). Arsenic in Food and Dietary
Supplements. />
AAP 2017a (American Academy of Pediatrics). Council on Environmental
Health. Prevention of Childhood Lead Toxicity. Pediatrics. 2017 Aug;140(2).
/>
CR 2012 (Consumer Reports). Arsenic in your food: Our findings show a real
need for federal standards for this toxin. Consumer Reports Magazine, Nov
2012. />
FDA 2019b (U.S. Food and Drug Administration). Lead in Food, Foodwares,
and Dietary Supplements. FDA Monitoring and Testing of Lead in Food,
including Dietary Supplements and Foodwares. />metals/lead-food-foodwares-and-dietary-supplements.
AAP 2017b (American Academy of Pediatrics). Bright Futures: Promoting
Healthy Nutrition. Hagan JF, Shaw JS, Duncan PM, eds. https://brightfutures.
aap.org/Bright%20Futures%20Documents/BF4_HealthyNutrition.pdf.
CR 2011 (Consumer Reports). Consumer Reports tests juices for arsenic and
lead. Nov 30 2011. />consumer-reports-tests-juices-for-arsenic-and-lead/index.htm.
FDA 2019c (U.S. Food and Drug Administration). Total Diet Study. Center for
Food Safety and Nutrition. />total-diet-study.
Bellinger DC 2012. A strategy for comparing the contributions of
environmental chemicals and other risk factors to neurodevelopment of
children. Environ Health Perspect 2012; 120: 501–07.
CSFPP 2017 (Coalition for Safer Food Processing and Packaging). Testing
Finds Industrial Chemical Phthalates in Cheese. />data-summary.pdf.
FDA 2019d (U.S. Food and Drug Administration). Recalls, Market Withdrawals,
& Safety Alerts. />
BFC 2019 (Baby Food Council). Baby Food Council website. www.
babyfoodcouncil.org.
EDF 2019a (Environmental Defense Fund). Too much cadmium and lead in
kids’ food according to estimates by FDA. May 7 2019. />health/2019/05/07/cadmium-and-lead-kids-food-fda-study/.
FDA 2019e (U.S. Food and Drug Administration). Import Alert 20-05. Detention
Without Physical Examination and Surveillance of Fruit Juices and Fruit Juice
Concentrates Due to Heavy Metal Contamination. essdata.
fda.gov/cms_ia/importalert_56.html.
Bolger PM, Yess NJ, Gunderson EL, Troxell TC, Carrington CD.
1996. Identification and reduction of sources of dietary lead in the
United States. Food Additives & Contaminants. 13:1, 53-60, DOI:
10.1080/02652039609374380.
Ciesielski T, Weuve J, Bellinger DC, Schwartz J, Lanphear B, Wright RO.
Cadmium exposure and neurodevelopmental outcomes in U.S. children.
Environ Health Perspect. 2012 May;120(5):758-63. doi: 10.1289/ehp.1104152.
Colgate 2020. Teething biscuits to soothe your baby? gate.
com/en-us/oral-health/life-stages/infant-kids/teething-biscuits-to-sootheyour-baby-1116.
CPSC 2019 (Consumer Product Safety Commission). Testing and certification.
What requirements apply to my product? />CR 2019a (Consumer Reports). Arsenic and Lead Are in Your Fruit Juice: What
You Need to Know. CR finds concerning levels of heavy metals in almost half
of tested juices. Here’s how to protect yourself and your family. January 2019.
/>
EDF 2019b (Environmental Defense Fund). Latest federal data on lead in food
suggests progress made in 2016 was fleeting. Author: Tom Neltner. http://
blogs.edf.org/health/2019/10/03/latest-federal-data-lead-food-progressfleeting/.
EDF 2017a (Environmental Defense Fund). Lead in food: A hidden health
threat. FDA and industry can and must do better. June 15, 2017. https://www.
edf.org/health/lead-food-hidden-health-threat.
EDF 2017b (Environmental Defense Fund). FDA finds more perchlorate in
more food, especially bologna, salami and rice cereal. />health/2017/01/09/fda-finds-more-perchlorate-in-more-food/.
EPA and FDA 2019 (U.S. Environmental Protection Agency and U.S. Food and
Drug Administration). EPA-FDA Advice about Eating Fish and Shellfish. July
2019. />Evens A, Hryhorczuk D, Lanphear BP, Rankin KM, Lewis DA, Forst L, Rosenberg
D. 2015. The impact of low-level lead toxicity on school performance among
children in the Chicago Public Schools: a population-based retrospective
cohort study. Environ Health. 2015 Apr 7;14:21. doi: 10.1186/s12940-0150008-9.
W h a t 's i n m y B a b y 's Fo o d ? | h e a l t h y b a b y f o o d . o r g | 1 7
FDA 2018a (U.S. Food and Drug Administration). Statement by Dr. Susan
Mayne on FDA efforts to reduce consumer exposure to arsenic in rice. April 17
2018. />FDA 2018b (U.S. Food and Drug Administration). What FDA is Doing to
Protect Consumers from Toxic Metals in Foods. />conversations-experts-food-topics/what-fda-doing-protect-consumers-toxicmetals-foods.
FDA 2018c (U.S. Food and Drug Administration). International Cooperation
on Food Safety. />FDA 2017 (U.S. Food and Drug Administration). Constituent Update: FDA
Working to Protect Consumers from Toxic Metals in Foods. .
gov/food/cfsan-constituent-updates/fda-working-protect-consumers-toxicmetals-foods.
FDA 2016 (U.S. Food and Drug Administration). FDA proposes limit for
inorganic arsenic in infant rice cereal. FDA news release. April 1, 2016. https://
www.fda.gov/news-events/press-announcements/fda-proposes-limitinorganic-arsenic-infant-rice-cereal.
FDA 2013 (U.S. Food and Drug Administration). Draft Guidance for Industry:
Action Level for Arsenic in Apple Juice. Docket Number: FDA-2012-D-0322.
July 2013. />FDA 2004 (U.S. Food and Drug Administration). Guidance for Industry: Juice
Hazard Analysis Critical Control Point Hazards and Controls Guidance, First
Edition. Docket Number: FDA-2013-S-0610. March 2004. />regulatory-information/search-fda-guidance-documents/guidance-industryjuice-hazard-analysis-critical-control-point-hazards-and-controls-guidancefirst.
Flensborg-Madsen T, Mortensen EL. 2017. Birth Weight and Intelligence in
Young Adulthood and Midlife. Pediatrics. June 2017, Vol 139 / Issue 6.
HBBF et al. 2016 (Healthy Babies Bright Futures). Comments on the FDA’s
Proposed Action Level for Arsenic in Infant Rice Cereal. Docket: Inorganic
Arsenic in Rice Cereals for Infants: Action Level; Draft Guidance for Industry;
Supporting Document for Action Level for Inorganic Arsenic in Rice Cereals
for Infants; Arsenic in Rice and Rice Products Risk Assessment: Report;
Availability. Docket No. FDA-2016-D-1099. July 19 2016.
Spungen JH 2019. Children’s exposures to lead and cadmium: FDA total diet
study 2014-16, Food Additives & Contaminants: Part A, 36:6, 893-903, DOI:
10.1080/19440049.2019.1595170.
Heyman MB, Abrams SA. 2017. Fruit Juice in Infants, Children, and
Adolescents: Current Recommendations. American Academy of Pediatrics.
Section on Gastroenterology, Hepatology, and Nutrition, Committee
on Nutrition. Pediatrics. 2017 Jun;139(6). pii: e20170967. doi: 10.1542/
peds.2017-0967.
Tanaka H, Tsukuma H, Oshima A. Long-term prospective study of 6104
survivors of arsenic poisoning during infancy due to contaminated milk
powder in 1955. J Epidemiol 2010; 20: 439–4.
FOE 2019 (Friends of the Earth). Toxic Secret. Pesticides Uncovered In Store
Brand Cereal, Beans, Produce. />
Jacobson JL, Muckle G, Ayotte P, Dewailly É, Jacobson SW. 2015. Relation of
prenatal methylmercury exposure from environmental sources to childhood
IQ. Environ Health Perspect 123:827–833; />ehp.1408554.
Gardener H, Bowen J, Callan SP. Lead and cadmium contamination in a large
sample of United States infant formulas and baby foods. Sci Total Environ.
2019 Feb 15;651(Pt 1):822-827. doi: 10.1016/j.scitotenv.2018.09.026.
Kone M 2006. Warning on tuna cans is rejected. Los Angeles Times. May 13
2006. />
Gillam C. 2017. Moms Exposed To Monsanto Weed Killer Means Bad
Outcomes For Babies. Huffington Post. April 4 2017. fpost.
com/entry/moms-exposed-to-monsanto-weed-killer-means-badoutcomes_b_58e3f715e4b02ef7e0e6e172.
Makharia A, Nagarajan A, Mishra A, Peddisetty S, Chahal D, and Singh Y. Effect
of environmental factors on intelligence quotient of children. Ind Psychiatry
J. 2016 Jul-Dec; 25(2): 189–194.
Grandjean P, Landrigan PJ. 2014. Neurobehavioural effects of developmental
toxicity. Lancet Neurol. 2014 Mar;13(3):330-8.
Grandjean P and Landrigan PJ. 2006. Developmental neurotoxicity of
industrial chemicals. Lancet. 2006 Dec 16;368(9553):2167-78.
Hamadani JD, Tofail F, Nermell B, et al. 2011. Critical windows of exposure for
arsenic-associated impairment of cognitive function in pre-school girls and
boys: a population-based cohort study. Int J Epidemiol 2011; 40: 1593–604.
HBBF 2017a (Healthy Babies Bright Futures). Arsenic in 9 Brands of
Infant Cereal. A national survey of arsenic contamination in 105 cereals
from leading brands. Including best choices for parents, manufacturers
and retailers seeking healthy options for infants. December 2017. www.
healthybabycereal.org.
HBBF 2017b (Healthy Babies Bright Futures). Change.org petition: Tell
Gerber: Get the Arsenic Out of Babies’ Cereal!. />tell-gerber-get-the-arsenic-out-of-babies-cereal.
MBASW 2020 (Monterey Bay Aquarium Seafood Watch). Seafood
Recommendations. />NAS 2000 (National Academy of Sciences). Toxicological Effects of
Methylmercury. National Research Council. National Academy Press,
Washington DC.
Parvez S, Gerona RR, Proctor C, Friesen M, Ashby JL, Reiter JL, Lui Z,
Winchester PD. 2018. Glyphosate exposure in pregnancy and shortened
gestational length: a prospective Indiana birth cohort study. Environ Health.
2018; 17: 23.
Rodríguez-Barranco M, Lacasaña M, Aguilar-Garduño C, Alguacil J, Gil F,
González-Alzaga B, Rojas-García A. 2013. Association of arsenic, cadmium
and manganese exposure with neurodevelopment and behavioural disorders
in children: a systematic review and meta-analysis. Sci Total Environ. 2013
Jun 1;454-455:562-77.
Sanders AP, Henn BC, Wright RO. 2015. Perinatal and Childhood Exposure
to Cadmium, Manganese, and Metal Mixtures and Effects on Cognition and
Behavior: A Review of Recent Literature. Curr Environ Health Rep. 2015 Sep;
2(3): 284–294. doi: 10.1007/s40572-015-0058-8.
W h a t 's i n m y B a b y 's Fo o d ? | h e a l t h y b a b y f o o d . o r g | 1 8
SWRI 2019 (Southwest Research Institute). LC/MS/MS Analysis for
Perchlorate. Available at www.healthybabyfood.org.
Taylor, PN et al. 2014. Maternal perchlorate levels in women with borderline
thyroid function during pregnancy and the cognitive development of
their offspring: data from the Controlled Antenatal Thyroid Study. J Clin
Endocrinol Metab. ( 99, no.
11 (Nov 2014): 4291-8.
Wasserman GA, Liu X, Parvez F, Factor-Litvak P, Kline J, Siddique AB,
Shahriar H, Uddin MN, van Geen A, Mey JL, Balac O, Graziano JH. 2016.
Child Intelligence and Reductions in Water Arsenic and Manganese: A
Two-Year Follow-up Study in Bangladesh. Environ Health Perspect. 2016
Jul;124(7):1114-20.
Wasserman GA, Liu X, Loiacono NJ, Kline J, Factor-Litvak P, van Geen A, Mey
JL, Levy D, Abramson R, Schwartz A, Graziano JH. 2014. A cross-sectional
study of well water arsenic and child IQ in Maine schoolchildren. Environ
Health. 2014 Apr 1;13(1):23.
Wasserman GA, Liu X, Parvez F, et al. 2007. Water arsenic exposure and
intellectual function in 6-year-old children in Araihazar, Bangladesh. Environ
Health Perspect 2007; 115: 285–89.
Wasserman GA, Liu X, Parvez F, Ahsan H, Factor-Litvak P, van Geen A,
Slavkovich V, LoIacono NJ, Cheng Z, Hussain I, Momotaj H, Graziano JH.2004.
Water arsenic exposure and children’s intellectual function in Araihazar,
Bangladesh. Environmental Health Perspectives, 2004 Sep;112(13):1329-33.
Zhang N, Baker WH, Tufts M, Raymond RE, Salihu H, Elliott MR. 2013. Early
Childhood Lead Exposure and Academic Achievement: Evidence From Detroit
Public Schools, 2008–2010. Am J Public Health. 2013 Mar; 103(3): e72–e77.
APPENDIX A: LABORATORY TEST RESULTS FOR HEAVY METALS
Results for analysis of heavy metals in a variety of baby foods are listed below. Foods were tested for total recoverable arsenic; speciated arsenic (total inorganic arsenic is shown below); and
total recoverable lead, cadmium, and mercury. Testing was commissioned by HBBF and performed by Brooks Applied Labs in Bothell, Washington in 2019. Appendix C provides a summary of
analytical methods.
The qualifier “<” indicates that the concentration was below the method detection limit, while The symbol “*” indicates test results that are estimated, that fall between the limit of detection
and the limit of quantification. The qualifier “--” indicates that the analysis was not performed.
About estimated values: The table below shows results for all target analytes detected by the lab’s instruments. Estimated values shown with the qualifier “*” have greater uncertainty than
other results. The starred (*) values are the lab’s best estimates of concentration, but the actual amounts may be higher or lower than these best estimates. These estimated test results are near
the test’s detection limit. They are higher than the detection limit but lower than the test’s quantitation limit. In contrast, test results above the quantification limit don’t carry the J qualifier they have lower uncertainty and are not considered to be estimates. The laboratory’s detailed reports that accompany this study give detection and quantification limits for each individual test
result shown below.
Arsenic
(inorganic,
ppb)
Lead (ppb)
Cadmium
(ppb)
Mercury
(total,
ppb)
Metro area where
purchased
Retailer
Food
Food type
Arsenic
(total, ppb)
Beech-Nut
Rice Single Grain Baby Cereal - Stage 1, from about
4 months
Cereal - rice
117
86
3.5
5.4
0.582
Charlottesville, VA
Wegmans
BioKinetics
BioKinetics Brown Rice Organic Sprouted Whole
Grain Baby Cereal
Cereal - rice
353
144
3.1 *
31.7
2.32
Washington, DC
amazon.com
Earth’s Best
Whole Grain Rice Cereal
Cereal - rice
138
113
22.5
14.7
2.41
San Diego, CA
99 Cents Only Stores
Earth’s Best
Whole Grain Rice Cereal
Cereal - rice
126
107
17.8
13.4
2.19
Portland, ME
Hannaford
Gerber
Rice Single Grain Cereal
Cereal - rice
106
74
3.9
11.1
1.79
Gambell, AK
ANICA Native Store
Healthy Times
Organic Brown Rice Cereal - 4+ months
Cereal - rice
153
133
67.4
12.1
1.53
Washington, DC
amazon.com
Kitchdee Organic
Baby Cereal Rice and Lentil - 6+ months
Cereal - rice
79.3
78
10.9
13.1
4.06
Washington, DC
amazon.com
Brand
Infant cereal: rice
Infant cereal: multi- and single non-rice grain
Gerber
MultiGrain Cereal - Sitter 2nd Foods
Cereal - mixed and
multi-grain
37
31
5.3
26.2
0.367 *
Detroit, MI
Meijer
HappyBABY
Oats & Quinoa Baby Cereal Organic Whole Grains
with Iron - Sitting baby
Cereal - mixed and
multi-grain
10.2
--
0.9 *
12.4
< 0.14
Minneapolis, MN
Target
Beech-Nut
Oatmeal Whole Grain Baby Cereal - Stage 1, from
about 4 months
Cereal - oatmeal
23.8
--
2.2
13
< 0.139
Portland, OR
Fred Meyer
Earth’s Best
Whole Grain Oatmeal Cereal
Cereal - oatmeal
29.5
27
2*
20.1
< 0.277
Portland, ME
Hannaford
Gerber
Oatmeal Single Grain Cereal
Cereal - oatmeal
26.9
--
3*
13
< 0.281
Washington, DC
Safeway
HappyBABY
Oatmeal Baby Cereal, Clearly Crafted - Organic
Whole Grains - for sitting baby
Cereal - oatmeal
6.3 *
--
< 0.5
10
< 0.14
Albany, NY
buybuyBABY
Harvest Hill
Instant Oatmeal, Maple & Brown Sugar
Cereal - oatmeal
13.5
--
8.1
5.8
< 0.14
Houston, TX
Dollar Tree
Cream of Wheat
Cream of Wheat Instant Original Flavor
Cereal - other
single-grain
19.5
--
21.8
36.7
< 0.14
San Diego, CA
99 Cents Only Stores
W h a t 's i n m y B a b y 's Fo o d ? | h e a l t h y b a b y f o o d . o r g | 1 9
APPENDIX A: Laboratory Test Results for Heavy Metals (continued)
Arsenic
(total, ppb)
Arsenic
(inorganic,
ppb)
Lead (ppb)
Cadmium
(ppb)
Mercury
(total,
ppb)
Metro area where
purchased
Retailer
Brand
Food
Food type
Gerber
Barley Single Grain Cereal- Supported Sitter 1st
Foods
Cereal - other
single-grain
10.6 *
--
3*
13.7
< 0.279
Detroit, MI
Meijer
Gerber
Whole Wheat Whole Grain Cereal - Sitter 2nd Foods
Cereal - other
single-grain
40.6
39
5.5
50.8
< 0.14
Cincinnati, OH
Kroger
NurturMe
Organic Quinoa Cereals - Quinoa + Sweet Potato +
Raisin
Cereal - other
single-grain
35.9
26
39.8
20.3
0.389 *
San Diego, CA
99 Cents Only Stores
365 organic (Whole
Foods)
Organic Milk Based Powder Infant Formula with
Iron
Formula
4.1 *
--
2.7
0.7 *
< 0.139
Boulder, CO
Whole Foods Market
Baby’s Only Organic
Organic Non-GMO Dairy Toddler Formula
Formula
3.8 *
--
1.6 *
< 0.5
< 0.139
Boulder, CO
Whole Foods Market
Earth’s Best
Organic Sensitivity - DHR/ARA Infant Formula with
Iron Organic Milk-Based Powder
Formula
< 4.4
--
1.6 *
1.4 *
< 0.278
Portland, ME
Hannaford
Enfamil
ProSobee Soy Infant Formula, Milk-Free LactoseFree Powder with Iron
Formula
6.2 *
--
7.8
6.9
< 0.14
Columbia, SC
Publix
Enfamil
Infant - Infant Formula Milk-Based with Iron - 0-12
months
Formula
< 2.2
--
2
0.7 *
< 0.138
Charlottesville, VA
Wegmans
Gerber
Good Start Gentle HM-O and Probiotics Infant
Formula with iron; Milk Based Powder - Stage 1,
birth to 12 months
Formula
5.2 *
--
0.9 *
< 0.5
< 0.14
Cincinnati, OH
Kroger
HappyBABY
Organic Infant Formula with Iron, Milk Based
Powder - 0-12 months
Formula
< 4.5
--
3.7
< 1.1
< 0.286
Washington, DC
amazon.com
Meijer
Meijer Baby, Infant Formula - Milk-Based Powder
with Iron - Birth - 12 months
Formula
< 4.4
--
2.3 *
3.1 *
0.417 *
Detroit, MI
Meijer
Parent’s Choice
(Walmart)
Organic Infant With Iron Milk-Based Powder - Stage
1 through 12 months
Formula
3.2 *
--
3.9
0.7 *
< 0.134
Charlottesville, VA
Walmart
Plum Organics
Gentle Organic Infant Formula with Iron, MilkBased Powder - 0-12 months †
Formula
4.6 *
--
4.7
< 1.1
< 0.278
Washington, DC
amazon.com
Similac
Similac Advance OptiGRO Powder - Milk-Based
Formula
4.6 *
--
2
< 0.5
< 0.139
Gambell, AK
ANICA Native Store
Simple Truth Organic
(Kroger)
Infant Formula with Iron, Organic Milk-Based
Powder
Formula
3.6 *
--
2.7
0.6 *
< 0.135
Portland, OR
Fred Meyer
up & up (Target)
Infant - Infant Formula with Iron, Milk-Based
Powder, DHA and Dual Prebiotics
Formula
< 2.2
--
1.5 *
3.1
< 0.138
Minneapolis, MN
Target
Infant formula
Vegetable - single, carrot
Beech-Nut
Classics Sweet Carrots - 2
Veggie - single carrot
< 2.1
--
27.2
6.8
0.15 *
Washington, DC
Safeway
Beech-Nut
Classics Sweet Carrots - Stage 2
Veggie - single carrot
< 2.2
--
23.5
8
0.212 *
Portland, ME
Hannaford
Beech-Nut
Organics Just Carrots - Stage 1
Veggie - single carrot
2.8 *
--
1.3 *
1.4 *
0.142 *
Minneapolis, MN
Target
W h a t 's i n m y B a b y 's Fo o d ? | h e a l t h y b a b y f o o d . o r g | 2 0
APPENDIX A: Laboratory Test Results for Heavy Metals (continued)
Arsenic
(total, ppb)
Arsenic
(inorganic,
ppb)
Lead (ppb)
Cadmium
(ppb)
Mercury
(total,
ppb)
Metro area where
purchased
Retailer
Brand
Food
Food type
Earth’s Best
Carrots Organic Baby Food - 2, 6 months +
Veggie - single carrot
4.1 *
--
1.1 *
< 0.5
0.224 *
Boulder, CO
Whole Foods Market
Earth’s Best
Carrots Organic Baby Food 2 - 6 months+
Veggie - single carrot
3.5 *
--
1.6 *
5.2
0.24 *
Columbia, SC
Publix
Earth’s Best
First Carrots Organic Baby Food - 1, 4 months+
Veggie - single carrot
5.2 *
--
1.6 *
4.4
0.222 *
Charlottesville, VA
Wegmans
Gerber
Diced Carrots Veggie Pick-Ups™
Veggie - single carrot
< 2.2
--
11.8
27.7
0.223 *
Washington, DC
Safeway
Gerber
Carrot - Sitter 2nd food
Veggie - single carrot
< 2.2
--
9.4
31.4
0.214 *
Minneapolis, MN
Target
Gerber
Carrot - Supported Sitter 1st Foods
Veggie - single carrot
< 2.2
--
11
42.2
0.248 *
Columbia, SC
Publix
Meijer
True Goodness Organic Carrots Baby Food
Veggie - single carrot
< 2.2
--
1.4 v
7.7
< 0.141
Detroit, MI
Meijer
O Organics
(Albertson/Safeway)
Organic Carrots Baby Food - 2
Veggie - single carrot
3.3 *
--
1.9
5.2
< 0.14
Washington, DC
Safeway
Parent’s Choice
(Walmart)
Carrot - Stage 2, 6+ months
Veggie - single carrot
<2
--
2.3
11.2
< 0.128
Charlottesville, VA
Walmart
Vegetable - single, sweet potato
Beech-Nut
Naturals Just Sweet Potatoes - Stage 1, from about
4 months
Veggie - single sweet potato
2.4 *
--
14.1
4
< 0.136
Albany, NY
buybuyBABY
Beech-Nut
Organics Just Sweet Potatoes - Stage 1, from about
4 months
Veggie - single sweet potato
3.8 *
--
7.3
2.7
< 0.142
Cincinnati, OH
Kroger
Beech-Nut
Classics Sweet Potatoes - Stage 2, from about 6
months
Veggie - single sweet potato
2.8 *
--
24.1
3.4
< 0.138
Portland, OR
Fred Meyer
Earth’s Best
Sweet Potatoes Organic Baby Food - 1, 4 months +
Veggie - single sweet potato
3.3 *
--
14.7
4.6
< 0.136
Boulder, CO
Whole Foods Market
Earth’s Best
Sweet Potatoes Organic Baby Food 2 - from about
6 months
Veggie - single sweet potato
3.1 *
--
12.9
3
< 0.136
Portland, OR
Fred Meyer
Earth’s Best
Sweet Potatoes Organic Baby Food 2 - 6 months+
Veggie - single sweet potato
4.3 *
--
6.9
1.6 *
< 0.138
Columbia, SC
Publix
Gerber
Sweet Potato Supported Sitter 1st Foods Tub
Veggie - single sweet potato
2.4 *
--
20.3
4.7
< 0.139
Washington, DC
Safeway
Gerber
Sweet Potato - Sitter 2nd Food
Veggie - single sweet potato
3.9 *
--
29.3
5.8
< 0.138
Minneapolis, MN
Target
Gerber
Sweet Potato - Supported Sitter 1st Foods
Veggie - single sweet potato
6.9
--
14.6
3.5
< 0.138
Cincinnati, OH
Kroger
HappyBABY
Organics Sweet Potatoes - Stage 1
Veggie - single sweet potato
5.8 *
--
1.5 *
1*
< 0.142
Portland, ME
Hannaford
W h a t 's i n m y B a b y 's Fo o d ? | h e a l t h y b a b y f o o d . o r g | 2 1
APPENDIX A: Laboratory Test Results for Heavy Metals (continued)
Arsenic
(total, ppb)
Arsenic
(inorganic,
ppb)
Lead (ppb)
Cadmium
(ppb)
Mercury
(total,
ppb)
Metro area where
purchased
Retailer
Brand
Food
Food type
HappyBABY
Organics Sweet Potatoes - Stage 1
Veggie - single sweet potato
6*
--
2.2
0.8 *
< 0.14
Detroit, MI
Meijer
HappyBABY
Sweet Potatoes - Stage 1
Veggie - single sweet potato
27.5
29**
2
1.6 *
< 0.141
Columbia, SC
Publix
Meijer
Meijer Baby Sweet Potatoes - 2nd Stage
Veggie - single sweet potato
11.9
--
1.3 *
0.8 *
< 0.14
Portland, ME
Hannaford
Meijer
True Goodness Organic Sweet Potatoes Baby Food
- Stage 2
Veggie - single sweet potato
2.6 *
--
0.8 *
0.6 *
< 0.14
Detroit, MI
Meijer
Parent’s Choice
(Walmart)
Sweet Potato - Stage 1, 4-6 months
Veggie - single sweet potato
4.3 *
--
4.3
1.4 *
< 0.141
Charlottesville, VA
Walmart
Plum Organics
Just Sweet Potato Organic Baby Food - 1, 4 months
& up
Veggie - single sweet potato
3.1 *
--
5.6
2.3
< 0.142
Boulder, CO
Whole Foods Market
Plum Organics
Just Sweet Potato Organic Baby Food - 1, 4 months
& up
Veggie - single sweet potato
2.3 *
--
14
2.7
< 0.14
Washington, DC
Safeway
Vegetable - single (other than carrot, sweet potato)
Beech-Nut
Classics Sweat Peas - Stage 2
Veggie - single other
6.3 *
--
1.1 *
1.6 *
< 0.138
Portland, ME
Hannaford
Beech-Nut
Beechnut Naturals Just Butternut Squash - Stage 1
Veggie - single other
< 2.2
--
1.3 *
1.2 *
< 0.139
Detroit, MI
Meijer
Beech-Nut
Organic Just Pumpkin - Stage 1, from about 4
months
Veggie - single other
2.6 *
--
4
1.1 *
< 0.139
Portland, OR
Fred Meyer
Earth’s Best
Winter Squash Organic Baby Food - 2, 6 months +
Veggie - single other
< 2.2
--
0.8 *
< 0.5
< 0.137
Cincinnati, OH
Kroger
Earth’s Best
First Peas Organic Baby Food 1 - 4 months+
Veggie - single other
5.9 *
--
3.8
< 0.5
< 0.14
Columbia, SC
Publix
Gerber
Pea - Sitter 2nd foods
Veggie - single other
< 2.2
--
0.7 *
< 0.5
< 0.14
Gambell, AK
ANICA Native Store
Gerber
Green Bean - Sitter 2nd Food
Veggie - single other
< 2.1
--
0.8 *
2.8
< 0.135
Minneapolis, MN
Target
Gerber
Green Bean - Supported Sitter 1st Foods
Veggie - single other
< 2.2
--
0.7 *
0.6 *
< 0.142
Cincinnati, OH
Kroger
Parent’s Choice
(Walmart)
Organic Butternut Squash Vegetable Puree - Stage
2, 6+ months
Veggie - single other
< 2.2
--
4.2
0.9 *
< 0.138
Charlottesville, VA
Walmart
W h a t 's i n m y B a b y 's Fo o d ? | h e a l t h y b a b y f o o d . o r g | 2 2