Roles of socio economic cultural and technical factors in on farm agro biodiversity via farmers seed choice
Bạn đang xem bản rút gọn của tài liệu. Xem và tải ngay bản đầy đủ của tài liệu tại đây (1.96 MB, 94 trang )
VIETNAM NATIONAL UNIVERSITY OF AGRICULTURE
FACULTY OF AGRONOMY
UNDERGRADUATE THESIS
TITLE:
“ROLES OF SOCIO- ECONOMIC, CULTURAL AND
TECHNICAL FACTORS IN
ON- FARM _AGRO-BIODIVERSITY VIA FARMER’S
SEED CHOICE”
Student
: Tran Thi Thanh Van
Student code
: 611747
Class
: K61KHCTT
Supervisor
: Msc. Nguyen Thi Phuong
Department
: Horticulture and Landscaping
Hanoi, 2021
CONFIRMATION
I confirm that the research on assessing roles of different socio-economic,
cultural and technical factors in on- farm _agro-biodiversity via farmer’s seed
choice is the result of my own research and has never been published in any
work of others. During the implementation process of this project, I have
seriously taken research ethics and all findings of this project are results of my
own work; all references in this project are clearly cited according to the official
regulations. I bear full responsibility for the fidelity of the numbers, data and
other contents of my research project.
Hanoi 28, February 2021
Author
Tran Thi Thanh Van
i
ACKNOWLEDGEMENT
To conduct my undergraduate thesis, the work would not have been
done without the help and support from my respectful people. Foremost, I am
deeply grateful to my supervisor, MSc. Nguyen Thi Phuong, Department of
Horticulture and Landscaping - Faculty of Agronomy, Vietnam National
University of Agriculture for her help throughout my undergraduate thesis. Her
advice, guidance, professionalism, and understanding of the scientific process
have greatly contributed to my learning experience. Without their substantial
support, it would be impossible to conduct this thesis.
My sincere thanks also go to teachers in the Faculty of Agronomy,
Vietnam National University of Agriculture, whose encouragement, guidance
and inspiration supported me during my time at the university. Besides that, I
am thankful to my dear classmates, the advanced crop science class (KHCTT,
K61), for all the time we had within these five years. Last but not least, special
thanks are given to my parents for all their help, encouragement and love over
the years.
Thank you sincerely.
Hanoi 28, February 2021
Author
Tran Thi Thanh Van
ii
CONTENTS
CONFIRMATION ................................................................................................. i
ACKNOWLEDGEMENT .................................................................................... ii
CONTENTS ......................................................................................................... iii
TABLE OF CONTENTS ..................................................................................... vi
TABLE OF FIGURE .......................................................................................... vii
ABTRACT ........................................................................................................... ix
PART 1: INTRODUCTION ................................................................................. 1
1.1. Introduction .................................................................................................... 1
1.2. Objective and requirement ............................................................................. 5
1.2.1. Objective ..................................................................................................... 5
1.2.2. Requirement ................................................................................................ 5
PART II. LITERATURE REVIEW ...................................................................... 6
2.1. The importance of vegetable production to the socio-economic development .... 6
2.1.1. Origin of vegetable crops ............................................................................ 6
2.2. The value of vegetables .................................................................................. 7
2.2.1. The economic value of vegetables .............................................................. 7
2.2.2 Nutritional value of vegetable crops ............................................................ 9
2.2.3. The Social value of vegetables .................................................................. 12
2.3. Vegetable production and consumption ....................................................... 14
2.3.1. Vegetable production and consumption in the world ............................... 14
2.3.2. Vegetable production and consumption in Vietnam ................................. 18
2.4. The role of vegetable crops in ensuring food security and nutrition ........... 21
2.4.1. Food Security Through Production of Vegetables.................................... 21
PART III. MATERIALS AND METHODS....................................................... 23
3.1. Object and Materials research ...................................................................... 23
3.2. Experiment site and research time ............................................................... 23
iii
3.3. Research Contents ........................................................................................ 23
3.4. Research methods........................................................................................ 24
3.4.1. Evaluating the importance of socio-economic and technical factors in
driving on-farm agro-biodiversity (with a focus on vegetables) via
the seed choice of farmers ....................................................................... 24
3.4.2. Farmer’s choice in seed procurement in different ethnic groups.............. 24
3.4.3.Evaluate the performance of the bush common bean varieties
(Phaseolus vulgaris) from two seed sources: local seed and
improved seed ......................................................................................... 25
3.5. Measurements............................................................................................... 26
3.6. Data analysis ................................................................................................ 27
PART IV. RESULTS AND DISCUSSION ........................................................ 28
4.1. Evaluating the importance of socio-economic, cultural and technical
factors in on-farm agro-biodiversity (with a focus on vegetables) via
the seed choice of farmers....................................................................... 28
4.1.1. Vegetables group ....................................................................................... 29
4.1.2. Soybeans.................................................................................................... 36
4.1.3. Grain crops ................................................................................................ 36
4.1.4.Other crops ................................................................................................. 46
4.2.Vegetable production and farmer’s seed choice in ethnic minority
farmers (Dao and Thai) in Sapa – Lao Cai and Mai Son – Son La ........ 54
4.3. Interview farmers in Hung Yen to determine the decision in farmer’s
seed choice .............................................................................................. 58
4.4.Evaluation of growth and development of two bush common bean
varieties (Phaseolus vulgaris) ................................................................. 64
4.4.1. Testing the germination rate of two bush common bean varieties
(Phaseolus vulgaris) in laboratory. ......................................................... 64
iv
4.4.2. Growth and development of two bush common bean varieties from
two seed sources (local and improved seed) on-field. ............................ 67
4.4.3.Ability to grow stems of local and improve varieties grown in the field
in Hanoi, in Autunm-Winter season 2020-2021 ..................................... 68
PART V. CONCLUSIONS AND RECOMMENDATIONS ............................. 71
5.1. CONCLUSIONS .......................................................................................... 71
PART IV: REFERENCE .................................................................................... 73
STATISTIC ......................................................................................................... 78
v
TABLE OF CONTENTS
Table 2.1. Chemical composition of vegetables (content per100 g)................... 11
Table 4.1. Summary of studies on vegetables seed system interventions
categorized according to their entries in the impact pathways. .............. 30
Table 4.2. Summary of studies on cereal seed system interventions
categories according to their entry in the impact pathways. ................... 37
Table 4.3. Summary of studies on the others crops seed system interventions
categories according to their entry in the impact pathways .................... 46
Table 4.4. Vegetables crops grown in the field and garden of Dao and Thai
ethnics people and the ratio of farmers planted. ..................................... 55
Table 4.5. The relation between land size, farmers age, purpose and
vegetables types of Kinh people in Hung Yen province. ....................... 62
Figure 4.4. The seed germination rate of bush common bean (Phaseolus
vulgaris) from two seed sources: local seed and improved seed that
were sourced in Gia Lam – Hanoi. ......................................................... 64
Tables 4.6. The growth and development indicators of the bush common
bean varieties sourced from two seed sources: local seed and
improved seed in Gia Lam – Hanoi in autumn -winter season, 2020 .... 67
vi
TABLE OF FIGURE
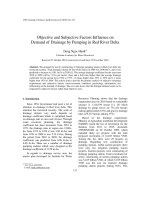
Figure. 2.1. Comparison of global production of primary vegetables in 2008
and 2018, by major regions (Source: FAO,2018). .................................... 8
Figure 2.2. The growth rate of Vietnam Fruits and Vegetable market ................ 9
Figure 2.3. Global production volume of vegetables from 2000 to 2018 ........... 15
Figure 2.4. Vegetable production for export of some nations in the world ........ 15
Figure 2.5. Vegetable production for import of some nations in the world ....... 17
Figure 2.6. The global vegetable production in 2019 ......................................... 17
Figure 2.7. The export value of fruits and vegetables in 2016-2018 .................. 18
Figure 2.8. Top 10 markets that Vietnam exports most fruit and vegetables
in July (Source: General Department of Customs,2020) ........................ 19
Figure 2.9. Vegetable, fruits and other commodities’ export turnovers in the
first quarter of 2020 (Source: General Department of Customs,
2020). ...................................................................................................... 20
Figure 4.1. The crop groups according to distribution areas .............................. 29
Figure 4.2. The relationship between seed type and land area, main purpose
and the age of farmers in Sapa. ............................................................... 58
Figure 4.3. The types of vegetables grown and percentage of household
interviewed in Hung Yen ........................................................................ 60
Figure 4.5. Seed germination of two bush common bean varieties from two
seed sources: local seed and improved seed, which were sown
without water treatment .......................................................................... 65
Figure 4.6. Seed germination of two bush common bean varieties from two
seed sources: local seed and improved seed, which were treated with
cold water prior to sowing. ..................................................................... 66
vii
Figure 4.7. Seed germination of two bush common bean varieties from two
seed sources: local seed and improved seed, which were treated with
warm water prior to sowing .................................................................... 66
Figure 4.8. The plant height (cm) of the bush common bean crop grown
from two sources of seed: local seed and improved seed in Gia Lam
– Hanoi .................................................................................................... 68
Figure 4.9. The plant width (cm) of the bush common bean crop grown from
two sources of seed: local seed and improved seed in Gia Lam –
Hanoi ....................................................................................................... 69
Figure 4.10. The length of leaf (cm) of the bush common bean crop grown
from two sources of seed: local seed and improved seed in Gia Lam
– Hanoi .................................................................................................... 70
viii
ABTRACT
A literature review of papers relating farmer seed choice. Validation of
findings by analyzing farmer survey in different Ethnic groups and ecological
regions and a controlled experiment. Clearly that the on-farm agro-biodiversity
maintained by farmers is directly influenced by farmer’s seed choice. It was
hypothesized that there would be multifaceted factors involving in this process,
including either socio-economic, cultural or technical aspects. Yet we lack a
holistic how these factors work in specific farmers’ context and how they are
interplayed. The review part was presented in three main sections: socialcultural, social-economic, and environment factors mediating the choice of
farmers in seed for use in each crop groups. It also went on to unpack the
benefits and challenges associated with the seed under these themes. A further
interview campaign with farmers in different ethnic groups (Dao, Thai and
Kinh) and ecological regions (Sa Pa – Lao Cai, Mai Son – Son La and Hung
Yen) was administered to validate and gain an evident-based findings supporting
the outputs from the previous literature review. The review results show that
socio-cultural factors play a role in preferences of culinary taste, food quality
and traditional customs of local varieties (also from local seed) while socioeconomic factors such as markets, gender, education, age of household head,
wealth, land size have different outcome effects on farmer’s choice of seeds.
This result was also proved in the further additional survey: seed quality per se
may play an essential role in mediating farmer’s seed choice as the local seed we
got from the local market does not guarantee the quality while the improved one
does better.
ix
PART 1: INTRODUCTION
1.1. Introduction
Biodiversity conservation is considered to be one of the most important
issues discussed in sustainable agriculture development. Biodiversity is a vital
part of a healthy and sustainable environment and so with loss of biodiversity in
a region or an ecosystem, would be inevitable. The global agro-biodiversity
increasingly decreases due to the loss of diversity in genetic sources (e.g.,
species and varieties) of food crops which are partially attributed to the
commercialization of crop production. The intensive spreading and worldwide
use of improved and/or modern crop varieties have led to genetic erosion,
resulting in the loss of local crops, landraces and elite allele diversity. Since the
1900’s, for example, an expense of 75% of the genetic diversity of farmers’
crops was lost in favor of genetically uniform, high-yielding varieties. At the
same time, high-yielding crop varieties may result in crop failure if they are
cultivated under sub-optimal conditions and provided with inappropriate input
requirements (e.g., fertilizers) on marginal locations, thereby increasing hunger
rate, food insecurity and downgrade in sovereign food production in countries of
the global South.
Globally, vegetables are a group of horticultural crops of great
importance which may improve the livelihoods of farmers and address the issues
of self-sufficiency, food security and economic development of remote areas.
Vegetables production may offer jobs, bring a stable income to farming
communities, positively improve socio-economic conditions and also provides
essential nutrients and minerals to ensure human’s health, nutrition security and
nutrition for humans. Jordaan et al. (2008) found that domestication of
indigenous fruit varieties was mean that ensure their contribution to income
generation in rural communities. To make certain that indigenous vegetables
contribute to the sustainable development a basket of promotional strategies and
1
marketing ought of them should be developed implemented and empowered
implemented.
Vietnam's diverse agro-ecosystems allow the production of both tropical
and temperate vegetables within the country. Beside a number of improved and
imported vegetables (e.g., cabbages, tomatoes, kohlrabi, cucumbers, peppers,
beans and leafy peas), there are also many traditional and wild vegetables which
is maintained, cultivated but under-utilized. Vietnam is known as one of
countries which are richest in vegetable diversity with a large portfolio of
vegetable crops grown countrywide. It is noted that out of 403 crop species used
as vegetables in Vietnam, 293 (of 84 families) species are indigenous, of which
41 species are used as spices. A richness in indigenous vegetables indicates a
very substantive source of crop biodiversity while they are well adapted to local
soil profiles and climatic conditions, and often can be grown with minimal
external inputs (De la Peña et al., 2011; Hughes & Ebert, 2013). Those varieties
often have high potential of good resistance to pests and diseases and external
conditions.
The Northern Uplands of Vietnam (NUV), also called Mountain Areas,
constitute one of the largest and diverse ecological regions of the country. The
region covers 29% of the national land area and has 11 million inhabitants
(GSO, 2009). It is characterized by a hilly and mountainous topography and a
settlement of diversities in ethnic communities, cultures, and farming systems
(Castella & Quang, 2002; Wezel et al., 2002; Vien, 2003). Most people there
also mainly rely on farming and forestry for foods and livelihoods, which are
highly vulnerable to natural hazards. Sa Pa is the highly mountainous township
of Lao Cai province located on the east side of the Hoang Lien Son range- an
extremity of the Himalayas, with the population of 53,580 people. There are 6
ethnic groups domesticating in this township including H’mong (53%), Dao
(25%), followed by Kinh (15%), Tay, Giay and Xa Pho (Lao Cai Statistic
2
Office, 2009). The Kinh group distribute mainly in Sa Pa town whereas other
groups spread over 17 other rural communes. The majority of the farmed area in
Sa Pa township is terraced and cropped with rice during summer months and
vegetables during winter months. Other cropping systems also exist in this area
include interchangeable temperate fruits - vegetables and vegetables vegetables. The following vegetables have been identified as the prioritized
crops by the local farmers - Cải Mèo (H’mong mustard), Su Hào (kohlrabi), Cô
ve (common bean), Cà chua (Tomato), Măng Tây (Asparagus), Ngồng Cải
(Flowering Mustard), Khoai Môn (Taro), Khoai Tây (Potato), Xà Lách
(Lettuce), Súp Lơ Xanh (Broccoli), Ớt Ngọt hay Ớt Chng (Sweet Peppers)
and Bí Ngồi (Zucchini). These local vegetables are rich in nutrients, easy to
grow, and well resistant to insects and diseases and highly adaptable to harsh
ecological conditions (e.g., hail, chilling). Therefore, they can become precious
genetic resources for the genetic improvement of cultivars to cope with
unchangeable climate change. The used seeds in many regions of the world are
not improved but sourced from the informal seed sources such as farmer-tofarmer seed exchanges, or gift (Meredia et al., 1999). The local seed production
and distribution would promote the maintenance of crop bio-diversity by
preserving locally adapted and often underutilized varieties in situ (Louette et
al., 1997; Van Dusen, 2000; Bellon et al., 2003). Local vegetable varieties are
mostly grown for home consumption, but over the past decade they have been
increasingly sold urban markets. The high diversity of ethnic groups within a
small region m ay result in an extraordinary diversity in indigenous vegetables
as different groups prefer specific but distinct culinary favors and agronomy
systems. Farmers in remote areas seem to use local seeds as the main source for
their planting materials. Hence, local seed systems are in the essence of in the
maintenance strategy of crop diversity, transferring of knowledge and species
and the sustainability of these agro-ecosystems. At the present, the diversity and
3
abundance of these vegetables are being reduced by environmental impacts, land
use changes farmers’ practices and importantly climate change. In addition,
vegetable seed quality is degenerated due to inappropriate cultural practices by
farmers as sub-optimal production and storage conditions on-farm. The quantity
of self-saved seeds normally is under the requirement of famers and seeds have
been reported to be significantly lost during harvesting and storage at the
household. The process of seed saving of local crop varieties. Deviates among
farmers and crop species, and usually comprises of distinct cares and techniques.
For example, out-crossing pollinated crops (e.g., Brassicas vegetables,
Pumpkins), requires some special care in pollination stage (e.g., bagging) to
avoid crossing among individuals or cultivars or fields. That is in contradiction
with the self-pollinated crops (e.g., beans) that needs more special care in
storage as bean seeds are very favored by insects (e.g., weevils and bruchids).
Farmers recycle seed either by saving their seed from the previous harvest
and/or obtaining it from fellow farmers by lending, selling and buying in market.
From the fact that, it raises the questions in relation to the differences in how
farmers maintain and select seed what are the factors that drive the seed choice
of farmers, and what are the mechanisms by which farmers persist to and
maintain a diversity local vegetable crops? I hypothesize that there are
multifaceted factors that could affect the farmers’ decisions in seed and crop
choices to grown on-farm, and the factors are not the technical side per se but
also need to deal with socio-economic aspects that bound the farmers’
households.
Therefore, I did a research on assessing roles of socio-economic, cultural
and technical factors in on- farm _agro-biodiversity via farmer’s seed choice.
We are more interested in vegetable crops, but not leaving out the other crop
groups (e.g., cereals and legumes) as the literature sources in vegetable seeds
4
were expected to be scared around and it is better to have a comparison among
different crop groups.
1.2. Objective and requirement
1.2.1. Objective
The overall objective of this study is to evaluate the roles of different
socio-economic, cultural and technical factors in on- farm _agro-biodiversity via
farmer’s seed choice. Besides, making recommendations to improve quality of
local varieties, maintain and enhance the local farm agro-biodiversity.
1.2.2. Requirement
- Evaluate the role of roles of different socio-economic and technical
factors of crops on farm- agrobiodiversity via farmer’s seed choice.
- Evaluate growth indicators related to varieties of local Phaseolus
vulgaris and new varieties.
- Interview farmers about their tendency to saving seed or buy seeds for
the next season.
- Interview farmers in some other regions to determine the decision in
farmer’s seed choice.
5
PART II. LITERATURE REVIEW
2.1. The importance of vegetable production to the socio-economic development
2.1.1. Origin of vegetable crops
Scientific evidences show that the currently used vegetables have not
suddenly appeared on the earth but have evolved over a very long period of time
thanks to natural selection, human selection, and more recently plant breeding
and other forms of genetic improvements. Conscious cultivation and trait
selection of plants may have occurred in what is today Syria as early as 11,050
BC, but this appears to have been a localized phenomenon rather than a
definitive step towards domestication (Hillman et al., 2001). The earliest human
attempts at plant domestication likely occurred in Southwestern Asia and the
Middle East about 10,000 years ago (Zohary & Hopf, 1988).
The Russian scientist Nikolai Ivanovich Vavilov proposed 8 centers of
origin of crop plants in the publication in 1926
Chinese center: It is considered to be one of the earliest and largest
independent center of origin of cultivated plants. This center includes mountain
regions of central and western China. A total of 136 endemic plants are listed
from this center include Soya Bean, Radish, Turnip, Pear, Peach, Plum,
Buckwheat, Opium Poppy, Brinjal, Apricots, Oranges, China Tea etc.
The Indian Center: This area has two sub centers: Main Center and
Indo-Malayan Center. 117 plants were considered to be endemic in Main
Center: Cereals and Legumes, Vegetables and Tubers, Fruits, Sugar, Oil, and
Fiber Plants, Spices, Stimulants, Dyes, and Miscellaneous. Cereals and
Legumes, Fruits, Oil, Sugar, Spice, and Fiber Plants are main crops in the other
sub-center.
Central Asiatic Center: Includes Northwest India (Punjab, Northwest
Frontier Provinces and Kashmir), Afghanistan, Tadjikistan, Uzbekistan, and
western Tian-Shan. Forty-three plants are listed for this center, including many
6
Wheats, The Others Are Peas, Lentils, Chickpeas, Mustard, Flax, Sesame,
Cotton, Hemp, Onion, Garlic, Spinach, Carrot, Pistachio, Pear, Almond, Apple.
Near-Eastern Center: Includes interior of Asia Minor, all of
Transcaucasia, Iran, and the highlands of Turkmenistan. Eighty-three species
including Many Triticum (diplo‐ and tetraploid), two‐row Barley, Rye, Lentil,
Lupine, Alfalfa, Persian Clover, Vetch, Fig, Pomegranate, Apple, Pear, Cherry.
Mediterranean Center: Includes the borders of the Mediterranean Sea.
Eighty-four plants are listed for this region including Wheats, Barleys, Forage
Plants, Vegetables and Fruits -especially also Spices and Ethereal Oil Plants.
Abyssinian Center: Includes Abyssinia, Eritrea, and part of Somaliland.
In this center were listed 38 species. Rich in Green Onions, Peas and Fruit Beans
(Vigna sinensis, Vicia faba).
South Mexican and Central American Central: include southern sections of
Mexico, Guatemala, Honduras and Costa Rica. Important for maize, Phaseolus and
Cucurbitaceous species, with spices, fruits and fiber plants.
South American Center: Three sub-centers are found: Peruvian,
Ecuadorean, Bolivian Center, Chiloe Center, Brazilian-Paraguayan Center.
Important for Potatoes, other root crops, grain crops of the Andes, vegetables,
spices and fruits.
2.2. The value of vegetables
2.2.1. The economic value of vegetables
Growing populations and increased incomes, especially in urban areas,
are already creating a rise in market demand as consumers seek to diversify their
diets. Increasing vegetable production to respond to this demand creates
important economic opportunities, especially for smallholder farmers. Data for
Cambodia, Niger, and Vietnam show that profits per hectare are 3–14 times
higher in vegetable production than in rice production while profits per labor-
7
day are double (Joosten et al., 2015). Vegetables also typically provide more
employment per hectare than cereals.
From 2007 to 2018, the most notable rate of growth in terms of imports,
amongst the main importing countries, was attained by the U.S., while the other
global
leaders
experienced
more
modest
paces
of
growth.
In value terms, the largest vegetable importing markets worldwide were the U.S.
($8.5B), Germany ($5.1B) and the UK ($3B), with a combined 40% share of
global imports. These countries were followed by Canada, France, the
Netherlands, Russia, Belgium, Italy, Spain, Malaysia and Indonesia, which
together accounted for a further 30%.
Figure. 2.1. Comparison of global production of primary vegetables in 2008
and 2018, by major regions (Source: FAO,2018).
Global primary vegetable production reached 1.09 billion tons in 2018,
about 37% of global cereal production (2.96 billion tons). Asia is by far the
largest producer of primary vegetables, responsible for three-quarters of global
production (Figure 2.1). During the past 10 years (2008–2018), there was a 24%
increase in global commercial vegetable production, mainly attributable to a
significant production increase in Africa (32%) and Asia (28.3%) (Figure 2).
The estimated farm gate value of annual global vegetable production reached
8
543 billion United States dollars (US$) in 2012–2013, about 65% of all food
cereals combined, estimated at 837 billion US$.
Figure 2.2. The growth rate of Vietnam Fruits and Vegetable market
In 2019, the export of vegetables and fruits in Viet Nam was not as
expected when it decreased by 1% compared to 2018 and only reached 3.8
billion USD. According to experts, one of the reasons for the decline in the
export of vegetables, tubers and fruits is the US-China trade war. In addition, the
failure to take advantage of the opportunities from Free Trade Agreement and
the internal shortcomings of the industry has caused fruit and vegetable exports
to miss the set target of USD 4 billion.
Figure 2.2 shows that global demand for agricultural crops is predicted to
increase until 2050 due to population growth, greater per capita purchasing
power which translates into higher meat and dairy consumption, and biofuel use.
The statistics of the Food and Agriculture Organization of the United Nations
(FAO) cover 25 primary vegetable products.
2.2.2 Nutritional value of vegetable crops
It is increasingly recognized that the global food system must shift its
focus from food quantity toward dietary quality and health and environmental
9
outcomes. Fruit, vegetables, and nuts are increasingly entering into the focus of
the nutrition community for their potential in combating the triple burden of
malnutrition. Vegetables, like fruits, are low in calories and fats but contain
good amounts of vitamins and minerals. All the Green Yellow-Orange
vegetables are rich sources of calcium, magnesium, potassium, iron, betacarotene, vitamin B-complex, vitamin C, vitamin-A, and vitamin K.
The World Health Organization (WHO) recommends a population-wide
daily intake of 400 g of edible fruit and vegetables for the prevention of NCDs,
as well as for the prevention and alleviation of several micronutrient
deficiencies.
Under consumption of vegetables and fruits is among the top ten risk
factors leading to micronutrient malnutrition and is associated with the
prevalence of chronic diseases (Ezzati et al., 2002; WHO, 2003). Vegetables
and fruits contain a range of macro- and micronutrients, including vitamin A,
iron, and zinc, which contribute to the prevention of malnutrition disorders.
Vegetables and fruits also are rich in bioactive phytochemicals that can reduce
the risk of chronic diseases such as cancer. While the nutritional importance of
vegetables has long been recognized within the nutrition and medical
communities, there is an increasing awareness among the general public of the
health advantages of increased vegetable consumption. The food and nutrition
division of FAO and WHO have published a number of papers related to
nutritional benefits of the consumption of vegetables and both organizations
promoted in 2004 a vegetable and fruit consumption initiative for health (cf.
FAO, 2003, 2011)
Vegetables have a low energy value. They generally provide between 10
Kcal and 50 Kcal (40-200 Kj) per 1 g; to obtain about 1000 Kcal, it would be
necessary to eat about kg. Their nutritional advantage is that they offer a high
concentration of micronutrients for low contents of calories and fat. Virtually
10
every national or international report on diet and health recommendations calls
for an increase in fruit and vegetable consumption to replace high-energy foods.
All vegetables have high water content, which ranges from 79% in potato to
96% in cucumber. They vary in chemical composition even within one variety,
depending on the species, conditions of growth, and method of cooking.
Vegetables are generally rich in carbohydrates but not in proteins (1-5 %) and
lipids (0.1-1%).
Table 2.1. Chemical composition of vegetables (content per100 g)
Vegetables are composed of carbohydrates, mainly simple sugars and
complex carbohydrates (starch and dietary fiber). The content ranges from 1-2%
in the leaf and stem vegetables to 27% in sweet potato. Root vegetables have the
highest carbohydrate content. Dietary fiber content ranges from 0.8% in
cucumber to 8.0% in artichoke.
Most vegetables contain substantial amounts of minerals, particularly
calcium, iron, and potassium. But mineral content is not an indicator of nutritive
value as the presence of interfering substances (e.g., oxalic or phytic acid) can
hinder bioavailability of these micronutrients (Godber, 1990). Much of the iron
in vegetables would be lost but for the presence of vitamin C which aids its
absorption.
All vegetables contain small amounts of the B-complex vitamins, but their
nutritive value is mainly derived from the supply of ß-carotene, vitamin C, and
11
folic acid. Although most vegetables contribute to the formation of vitamin A,
their ß-carotene content varies and is generally linked to color.
Fruits and vegetables contain anti‐oxidants, which have been credited
with disease fighting properties, and assist the body to reduce the risk of many
non-communicable diseases (FAO/WHO, 2004). Traditional, underutilized
crops, especially those which are locally available and culturally acceptable, are
ideally placed to play a much greater role in contributing to improved nutrition
and health. The mineral and vitamin contents of indigenous fruits and vegetables
are equivalent to, or higher than that found in some popular species such as
apples and cabbages (Abukutsa‐Onyango, 2003). Indigenous traditional food
crops have broader nutritional application and benefits, including the potential
for bioactive compounds that can contribute to antioxidant activity in the body.
Indigenous traditional food crops have been a source for traditional medicine for
many years. Even today, the seeds, leaves, bark, and roots of various plants are
used in traditional, complementary.
2.2.3. The Social value of vegetables
Commercial vegetable production is a high-input and labor-intensive
activity that requires a large labor force from cultivation to processing.
Furthermore, many vegetable crops require careful monitoring of plant health,
and careful attention to weed control, irrigation, fertilization, harvest timing, and
handling. Since many of these activities cannot be mechanized, there may be
very limited economies of scale, in production of crops that require high labor
inputs. The production of vegetables offers opportunities for poverty reduction
and for overcoming food insecurity by creating and providing employment,
because it is more labor intensive than the production of field crops. Often
vegetable production requires two to four times as much labor as the production
of cereal crops. In Kenya, the production of snow peas and French beans (the
two most widely grown export vegetables), require 600 and 500 labor days per
12
ha, respectively (Dolan, 2002). In Mexico, the vegetable sector accounts for
more than 20% of the total labor days within the agricultural sector. Shifting
from cereal production to vegetable production therefore generates additional
employment opportunities, which generates greater incomes for poor
households. Lumpkin et al. (2005) have shown that the per capita farm income
of vegetable growers was up to five fold higher than for cereal producers in
Asia. Maertens (2006) estimated that households participating in exportvegetable production in Senegal earned incomes that were 120% higher than the
average household income in the region. The relative profitability of vegetable
crops compared to cereals has been shown to be a determining factor for crop
diversification into vegetable production in India (Joshi et al., 2003).
Diversification of vegetable production can affect both the structure and the
level of employment. However, where labor is scarce, availability of hired labor
may actually be a limiting factor to vegetable production. Labor demands also
arise in the postharvest sector since transport, packing, sorting, grading and
cleaning are all labor-intensive activities (Weinberger & Genova, 2005).
Generally, the vegetable export industry also generates substantial employment.
Many work tasks, such as chopping, washing, labeling, and bar coding are
increasingly being transferred to developing countries and are providing many
new jobs, particularly among the unskilled segment of the workforce. Usually
employment increases are on farms owned by the major exporters and on
independent large farms, producing for these exporters under contract
(Maertens, 2006). Often these workers are landless women who have few other
opportunities for earning an income. The increasing feminization of vegetable
production worldwide is well documented. In a study conducted by Gill (2001)
in Punjab (India) during the mid-1990s, around three-quarters of all workers in
the vegetable production sector were hired labor, and female-hired labor
accounted for 49%. Further, female labor in vegetable production accounted for
13
58% of total labor hours. In tomato production alone, female labor accounted for
almost 60% of the total labor hours. In Africa, Asia, and Latin America, highvalue vegetable exports are female intensive industries with women dominating
most aspects of production and processing. In Chile, Ecuador, Guatemala,
Kenya, Mexico, South Africa, and Zimbabwe, evidence suggests that women
occupy at least 50% or more of the employment in these export vegetable
industries (Dolan & Sorby, 2003). Men move out of the sector more quickly
than women and women are becoming the preferred labor type for many
employers of the sector (Gill, 2001; Singh, 2003).
2.3. Vegetable production and consumption
2.3.1. Vegetable production and consumption in the world
The global vegetable market revenue amounted to $1,249.8B in 2018,
picking up by 2.4% against the previous year. The market value increased at an
average annual rate of +4.1% over the period from 2007 to 2018; the trend
pattern indicated some noticeable fluctuations being recorded in certain years.
The pace of growth appeared the most rapid in 2010, with an increase of 8.1%
against the previous year. Global vegetable consumption peaked in 2018 and is
likely to continue its growth in the immediate term.
Production 2007-2018: According to data from the United Nations Food
and Agriculture Organization (FAO), the Global production volume of
vegetables from 2000 to 2018 increase 406,47 million metric tons (from 682.43
million metric tons in 2000 to 1088.9 million metric tons in 2018). The total
output volume increased at an average annual rate of +2.8% over the period
from 2007 to 2018; the trend pattern remained consistent, with somewhat
noticeable fluctuations throughout the analyzed period.
14
Figure 2.3. Global production volume of vegetables from 2000 to 2018
Exports 2007-2018: According to the new "World - Vegetable - Market
Analysis, Forecast, Size, Trends and Insights" report in 2018, approx. 47M
tonnes of vegetables were exported worldwide; standing approx. at the previous
year. The total export volume increased at an average annual rate of +1.7% from
2007 to 2018; the trend pattern remained consistent, with only minor
fluctuations being recorded over the period under review. In value terms,
vegetable exports amounted to $42.3B (estimates) in 2018.
Exports production in 2018
6,1
5,8
5,1
4,3
3,5
2,7
2,4
Figure 2.4. Vegetable production for export of some nations in the world
15