An investigation into how business excellence can contribute to sustained organizational
Bạn đang xem bản rút gọn của tài liệu. Xem và tải ngay bản đầy đủ của tài liệu tại đây (2.23 MB, 382 trang )
AN INVESTIGATION INTO HOW BUSINESS EXCELLENCE CAN CONTRIBUTE TO
SUSTAINED ORGANIZATIONAL PERFORMANCE IN BOTH PRIVATE AND PUBLIC
SECTOR ORGANIZATIONS
A thesis submitted in partial fulfilment for the award of Doctor of Business Administration
By
Steve Tanner
Henley Management College/ Brunel University
January 2005
Dedication
To those that have inspired me over the last three years.
2
Abstract
Business Excellence, or Total Quality Management as it is also known, is a philosophy
that may be traced back to the 1950's when Deming and Juran showed the way to the
Japanese at the end of the second world war (Oakland (2003a)). Some of the principles
may even be traced back to the Egyptians (Tanner and Walker (2002)). Despite this,
Business Excellence theory is it an early stage of development (Dale, Wu et al. (2001)).
For over a decade, organizations have pursued the benefits of adopting a Business
Excellence approach and have sought external recognition through the achievement of
regional, national and even continent Quality Awards (Porter and Tanner (2003)). One
day soon, there could even be a 'World Quality Award'.
The research set out with two clear aims. Firstly, there was an objective to add to the
growing body of knowledge supporting the benefits of the adoption of Business
Excellence. Secondly, there was a desire to provide an insight into why Business
Excellence delivers such benefits. The thesis makes a contribution in both these areas.
The research was also novel in that both private and public organizations were included
in the study, and it represents one of the few studies to examine public sector
organizations at a time when the UK government is investing heavily in Business
Excellence as a way to improve public services (PriceWaterhouseCoopers (2000)). The
work also partially replicated the research of two other authors, Hall (Hall (1991); Hall
(1992); Hall (1994)) and Lindgren (2001), and not only provides support for their findings,
but also support for the current work.
The research examined how Business Excellence could lead to a source of competitive
advantage (or source of organizational advantage, as it was termed, as the sample
included both public and private organizations). Use was made of the resource-based
view of the firm as a basis for the theory underpinning the research ((Tena, Llusar et al.
(2001)) taking a scientific Structure - Conduct – Performance perspective (Barney
(1991a)). The literature review identified an initial research model that had the constructs
of Organizational Context, Environmental Dynamics, Leadership Excellence and
Strategic Capability as independent variables, and Performance across a number of
Stakeholder groups as the dependent variable. A positivist approach was taken to collect
data using a self-reporting postal questionnaire from 193 organizations. Use was made
of existing instruments following Churchill‟s 9-step process (Churchill and Iacobucci
(2002)), with some instruments being converted for use in the public sector. Although
primarily a positivist approach, the research also made use of social construction
techniques in the design of the questionnaire and to validate the findings (Jick (1979);
Easterby-Smith, Thorpe et al. (2002)).
3
The first area examined was the benefits of Business Excellence. A comprehensive
review of the literature concluded there was a strong case for its use, although the
majority of work had been conducted on the American Malcolm Baldrige National Quality
Award (MBNQA) framework and not on the more local EFQM Excellence Model
®
framework. A number of hypotheses were developed, covering areas such as the
difference in benefit reported between small and large organizations, and whether whole
organizations demonstrated more benefit than business units. There was also an interest
in whether there was a difference in the benefits achieved between public sector and
private sector organizations.
The two most frequently used methodologies for studying Business Excellence benefits
was found to be share price event studies and surveys, with the latter being used in the
current work. A Leadership Excellence instrument was used to operationalize Business
Excellence following a review of the critical success factors of Business Excellence. The
results indicated that Business Excellence had a positive relationship with overall
performance, as well as with individual performance indicators representing different
stakeholder groups. Business Excellence had a positive relationship with key
performance outcomes representing the organization, employee satisfaction representing
the employees, and customer satisfaction representing the customers. These
relationships were found for both private and public sector organizations. Societal
satisfaction, the fourth results area representing society as a stakeholder, did not appear
to be correlated with the Business Excellence approach.
Despite an acceptance that leadership is a driver of organisational performance, there is
very little empirical evidence to support this generalization (Bolden (2004); Burgoyne,
Hirsh et al. (2004)). Although not part of the original scope of the research, as a
leadership instrument has been used to operationalize Business Excellence, the research
contributes to the leadership body of knowledge, providing such empirical evidence of a
positive relationship.
The second area considered was the sources of competitive advantage, or sources of
organizational advantage, as the sample included both public and private organizations.
Partially replicating the work of Hall, employee-know how was found to be a main source
of advantage in public sector organizations, with employee know-how and reputation
being important in private sector organizations. The time to develop the advantage was
measured in terms of „Replacement periods‟, and this was found to be in the order of 2 to
3 years in most cases, with reputation having a slightly higher replacement period.
4
The third area examined the relationship between the ease with which organizations
respond to change, termed „Strategic Capability‟ in this study, and the performance
achieved. The result provided support for the concept of dynamic capabilities (Teece,
Pisano et al. (1997); Eisenhardt and Martin (2000); Zott (2003)). It was concluded that
Business Excellence and the ability of an organization to react to change exhibited a
relationship supporting the „mental buffer‟ theory of Savolainen (2000a). The dynamics of
the external environment was also considered to see if this affected the relationships
based on the theory of Eisenhardt and Martin (2000), but no such relationship could be
found. This lack of a relationship was attributed to either measurement and/ or sampling
issues.
The fourth area and final examined sought to establish a relationship between Business
Excellence, strategic capability and performance. Prahalad (2000) argued the most
st
important challenge facing managers in the 21 century was the challenge to manage
change in fast-moving environments. The current work developed a framework to aid the
understanding of dynamic capabilities and this framework represents a contribution to
theory. It is hoped the framework will be of value to both practitioners and researchers as
this exciting area of strategy is taken forward.
5
Contents
Abstract ............................................................................................................................... 3
Acknowledgements ........................................................................................................... 13
1
Introduction ............................................................................................................... 15
1.1
Introduction to Business Excellence ................................................................ 16
®
1.2
The EFQM Excellence Model ........................................................................ 19
1.3
Research supporting the models‟ structures ................................................... 21
1.4
TQM and research ........................................................................................... 22
1.5
Research focus ................................................................................................ 25
2
Literature review ....................................................................................................... 28
2.1
Business Excellence: Benefits and critical success factors ............................ 29
2.1.1
The benefits of Business Excellence ...................................................... 29
2.1.2
What are the Critical Success Factors of Business Excellence? ........... 48
2.2
Leadership and Business Excellence .............................................................. 59
2.2.1
Leadership from a Business Excellence perspective ............................. 60
2.2.2
Implications of leadership for the current research ................................. 72
2.3
Business Excellence and the resource-based view of the firm ....................... 73
2.3.1
The RBV as a theory for Business Excellence ....................................... 73
2.3.2
Background to the resource-based view of the firm ............................... 74
2.3.3
Distinctive competencies, skills, core competencies and capabilities .... 88
2.3.4
Building strategic capability ................................................................... 102
2.3.5
Dynamic capabilities ............................................................................. 116
2.3.6
Implications from the resource-based view for the current research .... 126
2.4
Research model and hypotheses .................................................................. 129
2.4.1
Research question and model .............................................................. 129
2.4.2
Construct definitions.............................................................................. 134
2.4.3
Hypotheses ........................................................................................... 137
2.5
Chapter summary .......................................................................................... 138
3
Methodology Chapter ............................................................................................. 139
3.1
Research philosophy ..................................................................................... 139
3.2
Approach to measures development ............................................................. 142
3.3
Use of qualitative techniques ......................................................................... 145
3.4
Research design ............................................................................................ 146
3.5
Questionnaire design ..................................................................................... 150
3.5.1
Step 1: Specify what information will be sought ................................... 152
3.5.2
Step 2:Type of questionnaire and method of administration ................ 152
3.5.3
Step 3: Determine content of individual questions ................................ 152
3.5.4
Step 4: Determine form of response of each question ......................... 171
3.5.5
Step 5: Determine wording of each question ........................................ 173
3.5.6
Step 6: Determine sequence of questions ............................................ 177
3.5.7
Step 7: Determine physical characteristics of the questionnaire .......... 177
3.5.8
Step 8: Revisit previous steps ............................................................... 182
3.5.9
Step 9: Pre-test questionnaire .............................................................. 186
3.5.10
Summary of questionnaire design ........................................................ 187
3.6
Sample selection ........................................................................................... 187
3.6.1
Unit and level of analysis ...................................................................... 187
3.6.2
Sampling approach ............................................................................... 188
6
3.6.3
Sources of potential respondents ......................................................... 189
3.6.4
Summary of selected sample ................................................................ 191
3.7
Data collection approach ............................................................................... 192
3.8
Data analysis plan ......................................................................................... 196
3.9
Chapter summary .......................................................................................... 199
4
Results and analysis............................................................................................... 203
4.1
Examining the data ........................................................................................ 203
4.1.1
Sample statistics ................................................................................... 203
4.1.2
Testing the means................................................................................. 205
4.1.3
Treatment of missing data .................................................................... 206
4.1.4
Graphical examination of the data ........................................................ 207
4.1.5
Summary of interval data examination.................................................. 207
4.2
Purify the instruments .................................................................................... 208
4.2.1
Outline of approach taken ..................................................................... 208
4.2.2
Part 1- Environment Dynamics ............................................................. 209
4.2.3
Part 2 – Strategic Capability ................................................................. 211
4.2.4
Part 4 – Performance ............................................................................ 213
4.2.5
Part 5 – Leadership excellence ............................................................. 219
4.2.6
Multicollinearity...................................................................................... 220
4.2.7
Cluster analysis ..................................................................................... 220
4.2.8
Test of means on final variates ............................................................. 221
4.2.9
Summary ............................................................................................... 230
4.3
Estimate the models and interpret the results ............................................... 231
4.3.1
Leadership Excellence and Performance ............................................. 231
4.3.2
Strategic Capability and Performance .................................................. 237
4.3.3
Leadership Excellence and Strategic Capability ................................... 238
4.3.4
Strategic Capability is developed over time .......................................... 241
4.3.5
Leadership Excellence developing Strategic Capability ....................... 250
4.4
Validate the models ....................................................................................... 255
4.5
Chapter summary .......................................................................................... 257
5
Discussion .............................................................................................................. 258
5.1
Summary of findings by hypothesis ............................................................... 259
5.2
The benefit of Business Excellence ............................................................... 263
5.2.1
Support for the benefit of Business Excellence .................................... 263
5.2.2
Business Excellence in the public sector .............................................. 267
5.2.3
Business Excellence and whole organizations vs. business units ....... 267
5.2.4
Business Excellence and organization size .......................................... 268
5.2.5
Appropriation of benefit to all stakeholders ........................................... 268
5.2.6
The effect of an organization‟s environment ......................................... 270
5.3
Sources of organizational advantage ............................................................ 270
5.3.1
Classification of sources of organizational advantage .......................... 271
5.4
Do dynamic capabilities exist?....................................................................... 278
5.5
Contribution to dynamic capability theory ...................................................... 279
5.6
Chapter summary .......................................................................................... 290
7
6
Conclusions ............................................................................................................ 292
6.1
Academic implications of the research .......................................................... 292
6.1.1
Contributions of the research ................................................................ 292
6.1.2
Potential publication themes ................................................................. 305
6.1.3
Limitations of the research .................................................................... 305
6.1.4
Future research ..................................................................................... 309
6.2
Practical aspects of the work ......................................................................... 311
6.2.1
Practical implications for organizations ................................................. 311
6.2.2
Role of the researcher .......................................................................... 313
6.2.3
Management by research results .......................................................... 315
6.3
The learning process ..................................................................................... 319
6.4
Final words..................................................................................................... 320
7
References ............................................................................................................. 321
8
Appendix 1: Abbreviations ...................................................................................... 361
9
Appendix 2: Original instruments from the literature .............................................. 362
9.1
Appendix 2.1: Competitive environment/turbulence instrument .................... 362
9.2
Appendix 2.2: Kanji‟s Leadership Excellence instrument .............................. 363
9.3
Appendix 2.3: List of assets and capabilities ................................................. 364
9.4
Appendix 2.4: Strategic response capability instrument................................ 365
9.5
Appendix 2.5: The performance scale ........................................................... 366
10
Appendix 3: Feedback on draft questionnaire ................................................... 368
10.1
Appendix 3.1: Practioners‟ focus group feedback summary ......................... 368
10.2
Appendix 3.2: Private and public sector focus group feedback summary ..... 369
11
Appendix 4: The final questionnaire ................................................................... 370
12
Appendix 5: Analysis of outliers by item ............................................................ 371
13
Appendix 6: Cluster analysis of variates by category ........................................ 373
14
Appendix 7: Initial SEM model ........................................................................... 374
15
Appendix 8: Feedback from focus groups on interpretation .............................. 375
8
Figures and Tables
Figure 1-1: The EFQM Excellence Model® ...................................................................... 20
Figure 2-1: Leadership Excellence Index structural equation model ................................ 63
Figure 2-2: Savolainen's 'Mental Buffer'............................................................................ 68
Figure 2-3: Strategic resource model linking leadership with assets and SCA ................ 69
Figure 2-4: The relationship between resource heterogeneity and immobility, rareness,
imperfect imitability and substitutability, and sustained competitive advantage ...... 79
Figure 2-5: Model for the relationship between Business Excellence and performance .. 90
Figure 2-6: Three dimensions of competence .................................................................. 98
Figure 2-7: RBV typology ................................................................................................ 101
Figure 2-8: A resource-based approach to strategy analysis: A practical framework .... 102
Figure 2-9: Intangible resources, capability differentials and sustainable competitive
advantage ............................................................................................................... 106
Figure 2-10: Classification system .................................................................................. 111
Figure 2-11: Strategic industry factors, resources & capabilities, and strategic assets . 115
Figure 2-12: Model overview ........................................................................................... 124
Figure 2-13: Emerging consensus regarding dynamic capabilities and the link to
performance ........................................................................................................... 125
Figure 2-14: Initial research model ................................................................................. 131
Figure 3-1: A view of research ........................................................................................ 143
Figure 3-2: Research methodology followed .................................................................. 146
Figure 3-3: Churchill‟s questionnaire design steps ......................................................... 151
Figure 3-4: Stages of refinement of dual items to final questionnaire ............................ 181
Figure 3-5: Questionnaire review cycles ......................................................................... 183
Figure 3-6: Wisconsin focus group members in a moment of relaxation ........................ 185
Figure 3-7: Main steps in the data collection stage ........................................................ 193
Figure 4-1: Data analysis approach steps 3 to 6 ............................................................ 203
Figure 4-2: Breakdown of respondents by industry type ................................................ 205
Figure 4-3: Contributors to SOA shown as % respondent (All cases) ............................ 244
Figure 4-4: Contributors to SOA shown as % respondent (Public sector) ...................... 245
Figure 4-5: Contributors to SOA shown as % respondent (Private sector) .................... 246
Figure 4-6: Basic path under investigation ...................................................................... 251
Figure 4-7: Final model with regression weights............................................................. 254
Figure 5-1: The link between dynamic capabilities, resources and capabilities, and
performance ........................................................................................................... 258
Figure 5-2: May's intangibles framework ........................................................................ 274
Figure 5-3: Construction of a theory ............................................................................... 280
Figure 5-4: A dynamic capabilities classification framework ........................................... 282
9
Table 1-1: The eight fundamental concepts...................................................................... 19
Table 2-1: Evidence for benefits of Business Excellence ................................................. 32
Table 2-2: Comparison of models derived from the literature ........................................... 49
Table 2-3: Critical success factors from empirical work .................................................... 52
Table 2-4: The common themes from the Business Excellence frameworks ................... 54
Table 2-5: Analysis of critical success factors .................................................................. 57
Table 2-6: Potential factors to measure Business Excellence .......................................... 58
Table 2-7: Strategic leadership practices .......................................................................... 59
Table 2-8: Core competencies of leadership in quality-orientated organizations ............. 61
Table 2-9: Change management competencies ............................................................... 71
Table 2-10: Strengths and weaknesses of the theoretical perspectives of the RBV ........ 75
Table 2-11: Main themes identified from the resource-based view literature ................... 76
Table 2-12: Sample definitions of and relationships among underlying RBV constructs . 80
Table 2-13: Parameterizing Barney‟s resource-based theory components ...................... 83
Table 2-14: Inapplicability arguments and counter-arguments ......................................... 85
Table 2-15: Comparison of the RBV and PBV from a strategic perspective .................... 87
Table 2-16: Top managers‟ rankings of distinctive competences, by strategy & industry 89
Table 2-17: Distinctive competencies ............................................................................... 92
Table 2-18: Sustainable competitive advantage of 248 organizations ............................. 94
Table 2-19: Typology of competences .............................................................................. 99
Table 2-20: Determinants of sustainable competitive advantage ................................... 103
Table 2-21: The relative importance of the contribution each intangible resource made to
the overall success of the business in 1990 ........................................................... 105
Table 2-22: Relative importance of intangible resources in 1987 and 1990 ................... 107
Table 2-23: Replacement periods ................................................................................... 108
Table 2-24: Other views on the sources of advantage ................................................... 109
Table 2-25 General characteristics of strategic industry factors (SIF) ............................ 114
Table 2-26: The VIRO Framework .................................................................................. 116
Table 2-27: Dynamic capabilities and types of dynamic markets ................................... 119
Table 2-28: Features of dynamic communities ............................................................... 121
Table 2-29: Definitions of dynamic capabilities ............................................................... 123
Table 2-30: Comparing the EFQM Excellence Model® with RBV literature ................... 127
Table 2-31: Construct definitions .................................................................................... 135
Table 3-1: Contrasting implications of positivism and social constructionism ................ 141
Table 3-2: Types of validity and reliability ....................................................................... 144
Table 3-3: Types of group interviews and dimensions ................................................... 146
Table 3-4: Research design criteria ................................................................................ 148
Table 3-5: Methods of considering environmental dynamics .......................................... 155
Table 3-6: Potential leadership instruments .................................................................... 157
10
Table 3-7: Support for the content of the Leadership Excellence instrument ................. 159
Table 3-8: Potential assets and capabilities from the literature ...................................... 162
Table 3-9: Analysis of assets and capabilities ................................................................ 164
Table 3-10: Potential instruments to measure performance ........................................... 169
Table 3-11: Base instruments for each construct ........................................................... 171
Table 3-12: Summary of main changes by construct ..................................................... 174
Table 3-13: Questionnaire instruction page considerations ............................................ 179
Table 3-14: Considerations for one or two questionnaire version options ...................... 180
Table 3-15: Initial alphas recorded .................................................................................. 186
Table 3-16: Initial correlations for three of the constructs (N=54) ................................... 186
Table 3-17: Sample sizes by source and respective responses..................................... 191
Table 3-18: Requirements of SEM reporting .................................................................. 198
Table 3-19: Multivariate techniques to test hypotheses .................................................. 200
Table 4-1: Breakdown of responses by category............................................................ 204
Table 4-2: Descriptive statistics for log (P) and Log (T) .................................................. 204
Table 4-3: Skewness and kurtosis statistics by part ....................................................... 207
Table 4-4: Environment variate reliability and descriptive statistics................................ 211
Table 4-5: Strategic Capability factors from EFA ............................................................ 212
Table 4-6: Strategic Capability factors reliability and descriptive statistics ..................... 213
Table 4-7: Reliability statistics for the stakeholder groups .............................................. 214
Table 4-8: Performance factors from EFA ...................................................................... 215
Table 4-9: Performance reliability and descriptive statistics ........................................... 217
Table 4-10: Performance factors from secondary EFA .................................................. 218
Table 4-11: Secondary performance factors reliability and descriptive statistics ........... 218
Table 4-12: Reliability statistics for Kanji‟s leadership instrument .................................. 219
Table 4-13: Correlation matrix of the independent variates ............................................ 220
Table 4-14: Test of means on final variables – Sector and Organization ....................... 221
Table 4-15: Independent samples test Private Vs Public sector .................................... 222
Table 4-16: Independent samples test Whole Organization Vs Business Unit .............. 223
Table 4-17: Test of means on final variables – Leadership level.................................... 224
Table 4-18: ANOVA results for final variates - Leadership levels ................................... 225
Table 4-19: Post hoc ANOVA results on leadership levels (Multiple comparisons) ....... 226
Table 4-20: Regression of Leadership Excellence and Performance ............................ 232
Table 4-21: Difference between the results for public and private organizations ........... 233
Table 4-22: Effect of whole business vs. business unit on the Leadership Excellence and
Performance relationship ....................................................................................... 234
Table 4-23: Effect of organization size on the Leadership Excellence and Performance
relationship ............................................................................................................. 234
Table 4-24: Relationship between Leadership Excellence and different stakeholder
Performance measures .......................................................................................... 235
11
Table 4-25: Effect of Environment Dynamics on the Leadership Excellence and
Performance relationship ....................................................................................... 236
Table 4-26: Examining the relationship Between Capability and Performance .............. 238
Table 4-27: Examining the relationship between Leadership Excellence and Strategic
Capability ................................................................................................................ 239
Table 4-28: Relationship between Strategic Capability and the eight stakeholder
Performance factors ............................................................................................... 240
Table 4-29: Standardized betas for Strategic Capability and the eight stakeholder
Performance factors ............................................................................................... 241
Table 4-30: Sources of organizational advantage missing data ..................................... 242
Table 4-31: Comparison of the results of Hall and this study ......................................... 248
Table 4-32: Replacement periods for top 10 sources of competitive advantage ............ 249
Table 4-33: Summary of SEM results ............................................................................. 252
Table 4-34: Regression coefficients for SEM paths ........................................................ 253
Table 5-1: Summary of results against each hypothesis ................................................ 260
Table 5-2: Comparison of focus of leadership across Business Excellence models...... 264
Table 5-3: Results from other empirical models on the Business Excellence and
Performance relationship ....................................................................................... 265
Table 5-4: Comparison of stakeholder weightings .......................................................... 269
Table 5-5: Classification of the sources of SOA using Kay's framework ........................ 272
Table 5-6: Sources of advantage (SOA) and Business Excellence CSF comparison.... 275
Table 5-7: Classification of dynamic capabilities and other resource-based definitions 284
Table 5-8: Classification of Business Excellence construct definitions .......................... 288
Table 6-1: Potential themes for publications and relevant bodies of knowledge ............ 305
Table 6-2: Comparison of current work with Eden and Huxham's framework ................ 316
12
Acknowledgements
As has become customary I would like to record my thanks for the people who have
provided support during my journey over the last 3 years. First and foremost is my family,
who not only tolerated a lack of attention due to the need to focus on the research, but
also contributed to the work during the data collection phase by entering the data. In
particular Elizabeth was charged with filing away all the papers and for ensuring the
supply of beer was uninterrupted (after appropriate sampling).
My work colleagues at Oakland provided technical, emotional and financial support. This
extended from helpful comments from JSO (whose views on football provided an
alternative insight to the world), to Anna Pye, who in between jumping off buildings,
provided support in identifying respondents for the questionnaire. Special mention also
goes to Dr Mary Davies for proof-reading the thesis with her normal care and Dr Joachim
Bauer for his advice, support and use of the sunbed.
Outside of Oakland, support from my personal networks allowed the research to reach a
successful conclusion. People I had worked with in the award processes or had met at
conferences fulfilled a number of roles, including providing feedback on the questionnaire
and securing responses. A special mention goes to Dr Brigitte Tantawy Monsou for
taking an active interest in the work and for providing support, and Adrian Foster who
provided an insight into public service performance and who we look forward to
welcoming into the family when he finally marries Nibbles. Joe Goasdoue and John
Smith from BQF and Dr. Lway Nackasha from Dubai also deserve a mention.
I was particularly fortunate to meet several of the authors of the papers that I built my own
research on over the course of the programme. This allowed me to obtain a greater
insight into their work and for me to receive their feedback on my work. These people
include Professors Richard D‟Aveni, Rob Grant, Patricia Moura e Sà, Richard Hall and
Mark Easterby-Smith.
Despite having completed my MBA at Henley I was to discover many more excellent
people within the Henley network. I count myself lucky to have received the support of
Professors Malcolm Higgs, Joe Hair, Arthur Money and Phil Samuel, and I have seen my
own knowledge and experience inch towards their level of competence. Although I still
have some way to go before I reach their level of competence at least I am on the road.
13
The Henley doctoral programme, which I am honoured to be a product of, would not
enjoy its worldwide reputation without the inspirational leadership of Dr David Price.
David has provided continual support and guidance throughout the programme and I look
forward to working with him in the future. Mention must also be given to Veronica and
Louise in the Doctoral office, as well as Jackie and Natalie, who have both moved on to
new pastures during my time in the programme.
Tradition determines that under the acknowledgements thanks should be reserved for the
first supervisor, so I have saved the best till last. Over the three years Pat Joynt has
welcomed me warmly into his network and taught me more than just how to conduct
research. His encouragement and support have been exemplary and I look forward to
this thesis being the start of a long-term relationship. But now I can look forward to
sharing my experiences for the benefit of others with the objective of providing the care
and attention that Pat has shown to me.
So there you have it. Many other people have helped me along the way and if I missed
them off the list it was not intentional. Come on you Irons.
14
1 Introduction
Everyone has his or her reasons for choosing their research topic. Mine are routed in my
work experience from the time when I left Sussex University with a D. Phil in Enzymology
to become a first line production supervisor at the Ford Motor Company Truck Plant at
Langley, Berkshire. After 2 years I moved into the field of quality control, as my personal
time horizon was beyond the end of the shift, to the annoyance of many of my work
colleagues. I have been there ever since. At that time quality was mainly concerned with
inspection and audits. A critical success factor was the ability to attach the correct label
onto a file in a filing cabinet under the DEF- 05-21 requirements. It did not matter so
much if the wheels fell of the trucks as long as the files were correctly labelled. I am
convinced that many of these external auditors retired to become Reading traffic
wardens.
Quality is a field that has been traced back to the 1950s (Martinez-Lorente, Dewhurst et
al. (1998)) and has changed radically over the past 25 years (Luthans and Hodgetts
(2002); Yarrow, Hanson et al. (2004)). Moving from Ford to International Computers
Limited exposed me to Philip Crosby, and from there I took my experience to the
Financial Sector, working for Prudential to implement a Total Quality Management (TQM)
programme that won a UK National Training Award. It was at this time, in the late 80‟s,
that the American Malcolm Baldrige National Quality Award was born in accidental
circumstances (Porter and Tanner (1998)).
Higher requirements for improved quality of products and services have led to three
important changes in international business over the last decade (Terziovski, Sohal et al.
(1999)). These are the growing recognition of the strategic importance of Total Quality
Management philosophy and methods; a major push by organizations world-wide to seek
certification to the ISO 9000 quality standards; and the growing recognition and
application of the Malcolm Baldrige National Quality Award, the European Quality Award,
and other awards such as the Australian, Taiwan, Canadian, Singapore and Dubai
Quality Awards.
I have been involved with the European Quality Award process since 1992. In that time I
have assessed many organizations and also advised several on how to win the Award.
The objective of these awards is to improve competitiveness in their regions and, as
described in Chapter 2, there is a body of evidence suggesting that this is the case. But
a critic might argue that an organization can win an award by being good at writing an
application, not having an excellent sustained performance; a bit like solving a crossword
15
puzzle without being able to write a sentence. This view was supported by others
(Simms, Bowles et al. (1991); Conti (1992); Wilson and Durant (1995)).
In writing this thesis there is a concern that „criticising quality is like criticising the Queen
Mother‟, as Seddon (1997) remarks. This is especially true given the snowballing interest
in Business Excellence where it has even been suggested that the philosophy could be
applied to Premiership football clubs (Clarke (2000)).
The main focus of this research was to examine the philosophy of Business Excellence to
see whether there was support for its use. In this introductory Chapter a brief summary of
®
Business Excellence and the EFQM Excellence Model has been given to aid the reader
not familiar with the subject area. A notable feature is the interest being given to
Business Excellence by the UK Government, which is one of the reasons why it was
decided to include public sector organizations in the current study.
At the outset the reader should avoid any confusion between Business Excellence as
defined in this research, and Peters and Waterman‟s definition of „Excellence‟, which, as
noted by Caruana, Pitt et al. (1994), was based on the three criteria of size, financial
performance and innovation. Research concluded that Peters and Waterman‟s
„Excellence‟ and Performance are not synonymous (Ramanujam and Venkatraman
(1988)).
The first section of this Chapter provides a brief introduction to Business Excellence,
®
followed by some information on the EFQM Excellence Model in section 2. Section 3
reviews some of the research conducted on the structure of the various Business
Excellence models. We see that the empirical underpinning is particularly weak and that
the current research has contributed to this area of debate. The Chapter continues with
section 4 examining some views on the current state of the theory of TQM and Business
Excellence research, and some suggestions made by other authors on where new
research may contribute. TQM is only just building its own body of knowledge and, as a
consequence, the Business Excellence research had to be grounded in the research from
more established areas. In the summary of this Chapter the research focus is defined.
1.1 Introduction to Business Excellence
Since the introduction of the Deming Prize in Japan in 1951 a number of other quality
awards have been developed with the aim of increasing the competitiveness of industry
in their respective countries. The most famous awards in the Western World are the
16
USA‟s Malcolm Baldrige National Quality Award (MBNQA), introduced in 1987, and the
European Foundation for Quality Management‟s (EFQM) „Excellence Model‟, which was
introduced in 1991. As explained by Porter and Tanner (1998), the Baldrige Award
adopted the process of the Deming Prize but developed a Business Excellence model
that took a more holistic view of business than the Deming Prize, which was centred on
„Total Quality Control‟. The EFQM approach built on the Baldrige model and award
process, which had seen several organizations go out of business despite being
recognised as „world-class‟ (Powell (1995)). Briggs and Keogh (1999) have noted that
even world-class organizations may find managing change in their business environment
difficult. Both the Baldrige and EFQM models have been refined over the years (Vokurka
and Stading (2000); Porter and Tanner (2003)).
Many books have been published describing the composition and use of the number of
Business Excellence models that are available around the world. These include
publications from the award bodies (e.g., JUSE (1990); EFQM (1999a); NIST (2001)) and
from practitioners (e.g., Hakes (1994); Mahoney and Thor (1994); Oakland (1999a);
ECforBE (2000); ECforBE (2002); Porter and Tanner (2003)). The importance of this
subject area was reinforced by the observation by Garvin (1991) that, in the first three
years of its existence, the American National Institute of Standards and Technology
(NIST) distributed over 450,000 copies of the Baldrige application guidelines. Over this
period there were only approximately 200 applications for the award (Porter and Tanner
(1998)).
Despite this level of interest, some authors challenged whether Business Excellence was
as efficacious as the research indicates (e.g., Fernando (2001); Hughes and Halshaw
(2002)). Rao, Youssef et al. (2004) cited an opinion reported in the Economist in 1992
that there is mounting evidence that the quality programmes of Western companies are
failing dismally. This work also cited a recent survey of 500 manufacturing and service
organizations by Arthur D Little that found that only a third of the organizations felt their
quality programmes were having a significant impact on competitiveness. As noted by
Schaffer and Thompson (1992), „Most improvement efforts have as much impact on
company performance as a rain dance has on the weather!‟ Byrne (1997) proclaimed
that „TQM is as dead as a pet rock‟. Despite this Hendricks and Singhal (1999) advised
organizations „Don‟t Count TQM Out‟. The growth of process management and TQM was
noted by Benner and Tushman (2003) who cited Nohria (1996) who observed that, back
in 1992, every Fortune top 100 organization had a TQM programme.
17
So why do organizations chose to invest in Business Excellence? The European Centre
for Business Excellence conducted a questionnaire-based study with a sample of 200
private sector organizations (ECforBE (1997)). This study included canvassing opinions
on the reasons for starting or continuing Business Excellence. It concluded that the
®
primary reasons for starting to use the EFQM Excellence Model were to provide a driver
for improvement and to increase awareness and commitment to quality throughout the
organization. The main reason for continuing was also to drive improvement in the
organization, although the view has been expressed that use of Business Excellence for
improvement and as a mechanism for external recognition must be kept separate (Conti
(1992)). Reed (1995) reported a small survey amongst public service staff that had just
undertaken assessor training. The results indicated that the primary motive behind selfassessment at the time was its use as a measurement tool. Similar work has also been
conducted on the Baldrige Award (Bemowski and Stratton (1995)).
Redman, Mathews et al. (1995) note a number of reasons why Business Excellence
would be attractive to the public sector organization. These include increasing pressures
on cost and greater consumer choice. In some countries governments are imposing use
of Business Excellence in order to drive up the level of service provided by public sector
organizations. Business Excellence is being used as a vehicle for implementing the UK
Government‟s Best Value initiative (Lewis (1998)). Such is its importance, the EFQM
®
Excellence Model was cited in the 1998 White Paper „Modern Local Government: In
touch with the people‟ (I&DeA (2001)). As stated in a UK government report „In the jungle
that is quality improvement, the Model is the biggest beast – used by over 20,000
organizations across Europe. It is an approach therefore that the whole of the public
sector should consider‟. (PriceWaterhouseCoopers (2000: p3)). This report surveyed
public sector organizations noting that a wide range of organizations had adopted the
®
EFQM Excellence Model including Local Authorities, Emergency Services and Central
Government. The estimated cost of implementation was placed at anywhere between
£20,000 and over £400,000. The majority of managers interviewed were found to use the
®
EFQM Excellence Model to help their organization achieve key objectives and to
enhance organizational performance. No causal approach – deployment linkages were
established, this being put down to the observation that it takes many years to develop
this capability (PriceWaterhouseCoopers (2000)). Work in 2001 came to similar
conclusions but noted that implementation was being used at different organizational
levels: Service Unit level, Department level and Corporate level (I&DeA (2001)).
Despite this level of interest empirical work that investigates why Business Excellence
delivers benefit, particularly in the public sector, is sadly lacking. The EFQM Excellence
®
Model , which forms the basis for this research, was formulated by expert opinion and to
18
date has not been empirically tested, although some such work has been conducted on
the American Baldrige model.
On a European stage, Business Excellence is considered to be beyond TQM, but in the
USA the terms Total Quality Management and Business Excellence are interchangeable.
Bauer (2002) gave a comprehensive review of the TQM literature and argued that
Business Excellence is an extension of TQM and, for the purpose of this work, Business
Excellence will be used to cover both terms accept where TQM was specifically
mentioned in others‟ work.
1.2 The EFQM Excellence Model®
®
According to the EFQM Excellence Model , truly excellent organizations are measured
by their ability to achieve and sustain outstanding results for all their stakeholders, such
as customers, employees, shareholders and the community (EFQM (1999a)). It is stated
that this requires a management approach based on the eight fundamental concepts in
Table 1-1.
Table 1-1: The eight fundamental concepts
Fundamental Concept
Definition
Results Orientation
Excellence is achieving results that delight the
organization‟s stakeholders
Customer Focus
Excellence is creating sustainable customer value
Leadership and Constancy of
Excellence is visionary and inspirational leadership,
coupled with alignment of purpose
Purpose
Management by Process and
Fact
People Development and
Involvement
Continuous Learning,
Innovation and Improvement
Excellence is managing the organization through a set
of independent and interrelated systems, processes
and facts
Excellence is maximising the contribution of employees
through their development and involvement
Excellence is challenging the status quo and affecting
change by utilizing learning to create innovation and
improvement opportunities
Partnership Development
Excellence is developing and maintaining value adding
partnerships
Corporate Social
Excellence is exceeding the minimum regulatory
framework in which the organization operates and to
strive to understand and respond to the expectations of
their stakeholders in society
Responsibility
Adapted from: EFQM (2003)
19
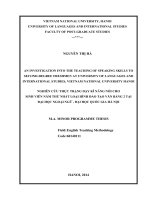
®
The eight fundamental concepts form the basis of the EFQM Excellence Model , which is
shown schematically in Figure 1-1. This has nine criteria broken down into two main
groups, enablers and results. The five enablers are the things an organization does in
order to achieve the desired results. This result/enabler breakdown provides a valuable
way to classify the organization‟s activities and performance. The theme of innovation
and learning spans the model and reinforces the feedback mechanisms that drive the
improvement in the organization‟s performance.
Results
Enablers
People
People
Results
Results
People
People
Leadership
Leadership
Policy
Policy && Strategy
Strategy
Processes
Processes
Customer
Customer
Results
Results
Partnerships
Partnerships
&& Resources
Resources
Key
Key
Performance
Performance
Results
Results
Society
Society
Results
Results
Innovation & Learning
Adapted from: EFQM (1999a)
Figure 1-1: The EFQM Excellence Model®
®
The fundamental concepts and the EFQM Excellence Model have been described, but
the key question is „How does the this help drive business improvement?‟ This is
®
achieved through the application of RADAR philosophy, which sits at the heart of the
®
®
EFQM Excellence Model . RADAR consists of four elements based on Deming‟s widely
accepted „Plan – Do- Check – Act‟ cycle. The philosophy is that an organization needs
to:
Determine the Results it is aiming for from its policy and strategy
Plan and develop an integrated set of
Approaches
Deploy the approaches, then
Assess and Review these approaches, to identify, prioritize, plan and implement
improvements.
20
European, country-wide and regional awards are given on an annual basis to
organizations who can demonstrate that continued or improving results across all the
results areas are being achieved because of the approaches that are deployed across
the organization. Many organizations conduct the activity of „self-assessment‟ by
®
reviewing their results and approaches against the EFQM Excellence Model on the
journey to becoming „world-class‟. The award process and self-assessment are outside
the scope of this research.
1.3 Research supporting the models’ structures
Recent work has examined the internal relationships between the elements within both
®
the Baldrige Model and the EFQM Excellence Model . Building on the earlier work of
Evans (1992), who described the Baldrige Model as three related sub-systems, Curkovic,
Melnyk et al. (2000) defined three factors to define TQM, consisting of TQM Strategic
Systems, TQM Operational Systems, and TQM Information Systems. To this they added
the construct of TQM Results and conducted a survey consisting of responses gathered
from 526 plant managers within the US automotive industry. Using structured equation
modeling, the authors found all of the causal paths specified in their hypothesized model
to be positive and statistically significant. In concluding they stated that the study had
shown empirically that the Baldrige framework did capture the concept of Total Quality
Management.
In a study on applicants for the Arizona Quality Award Pannirselvam and Ferguson
(2001) concluded that leadership had a key impact on all the constructs they tested and
that areas such as human resource management had statistically significant impact. In
concluding they claimed that, within scope of the research, they had validated the
Baldrige framework. They did note that this was not the case in earlier work by Winn and
Cameron (1998), the difference being partially put down to sampling and the process
used to collect the data (Pannirselvam and Ferguson (2001)).
Like Curkovic, Melnyk et al. (2000), Meyer and Collier (2001) also used structured
equation modelling to empirically test the causal relationships in the MBNQA Health Care
Pilot Criteria using data from 220 US hospitals. Results of confirmatory structural
equation modelling showed that many of the hypothesized causal relationships in the
Baldrige model were statistically significant. The study found the Baldrige components of
leadership and information and analysis were statistically significantly linked with
organizational performance results, while human resource development and
management and process management statistically significantly linked with customer
21
satisfaction. More recently Su, Li et al. (2003) have used structured equation modelling
to confirm causal relationships in the Taiwan National Quality Award.
®
No similar studies could be found featuring the EFQM Excellence Model . Research has
questioned the weightings of the criteria. Research on Danish organizations suggested
the weightings have remained constant in most areas over the period 1998 to 2001, but
the weights do not match those given by the model. Results suggested that the enabler/
results ratio is 70/30, and not 50/50 as defined in the EFQM Excellence Model
®
(Eskildsen, Kristensen et al. (2001); Eskildsen, Kristensen et al. (2002)), a result that is
supported by Chuan and Soon (2000). Vokurka and Stading (2000) noted the different
weightings given to similar criteria within the various quality frameworks and Dervitsiotis
(1999) held the view that the weightings must change in line with changes in the business
environment.
®
Following the review of the EFQM Excellence Model in 1999, Nabitz, Severens et al.
(2001) published an alternative model based on work conducted during the review.
Using concept mapping to summarize the main areas of emphasis within the EFQM
®
Excellence Model and other Business Excellence models, the work concluded that there
was an emphasis on customers, markets, suppliers and partnerships and that the
measurement systems and results have a central position. Their „improved‟ model had
11 criteria and, like the „official‟ model, it is yet to be tested empirically. Within this
revised model leadership was defined as being the key driving factor delivering the
performance though the various activities.
Reiner (2002) conducted a dependency analysis using information from applicants from
the Austrian Quality Award. The resulting model that Reiner constructed suggested that
logical relationships exist, such as Leadership influencing People Management and
Policy & Strategy and People Management influencing Processes. The work had some
limitations, in particular the fact that the organizations used in the study were following
the pre-1999 model and the range of the scores of these organizations was extremely
wide (ca. 450 +/- 250).
1.4 TQM and research
Although it is generally accepted that Business Excellence can generate a sustainable
competitive advantage, there is little or no theory to underpin this belief (Reed, Lemak et
al. (2000)). Those working in the field of Business Excellence need to further establish
underpinning theories that are consistent with Business Excellence practice (Leonard and
McAdam (2001)). Even the large-scale quality models (e.g. Baldrige, EFQM Excellence
22
®
Model ) attract the attention of researchers who question some of their underpinning
philosophy in regard to Business Excellence principles. For example, Grint (1995) and
Wilkinson and Wilmott (1994) inquired if a coherent quality philosophy underpins these
models. Wilson and Durant (1995) saw theoretical weaknesses, in that Business
Excellence models can encourage a "motivational/directional effect", in other words,
fulfilling award criteria is rewarded rather than achieving business goals. This is a form of
goal displacement where the award model criteria become pseudo business goals.
Furthermore, the models encourage evaluation against a standard rather than evaluation
of the standard. Many of these problems were identified as relating to TQM's lack of
theory and definition based on in-depth qualitative studies (Carr and Littman (1990);
Leonard, McAdam et al. (2002); Leonard and McAdam (2002b)).
In reviewing the current position of TQM theory, Dale, Wu et al. (2001) noted that such
theory was at an early stage of development and that it was often viewed as part of
operations management. The theory is also fragmented (Link and Scott (2001)). The
situation is not unlike the information systems body of knowledge where there are so few
theoretical articles due to the youth of the subject and the difficulty in assembling a view
in a multi-disciplinary field (Webster and Watson (2002)). Dale, Wu et al. (2001)
concluded that TQM was becoming an academic subject in its own right and went on to
state:
'To extend the scope of TQM (Business Excellence) theory it is necessary to
incorporate management theories into its development and that much remains to
be done for TQM (Business Excellence) to reach a stage of 'refine/ extend' in the
theory building process.‟ Dale, Wu et al. (2001: p439).
A good theory has to begin somewhere and often this comes from theories (or
researchers) from other areas (Ladik (1999)). Dale, Wu et al. (2001) noted that most
research to date has been by practitioners and not academics, but many of the
acknowledged theory originators have relevance to TQM theory. Earlier attempts to
develop a theory for Business Excellence drew parallels between management theory
and TQM noting the close connection with leadership theory (Dean and Bowen (1994)).
This work raised a number of questions that are pertinent to the current research and
they included:
Can TQM be considered a substitute for leadership?
What is the role of quality in competitive strategy?
Can strategy formulation processes be improved? How?
What are the relative contributions of person and system factors to performance?
23
In support of the observation TQM/ Business Excellence is establishing itself to be a
dedicated area of theory, the International Encyclopaedia of Business and Management
(Rogerson (2002)) has a short entry describing the evolution of the area from Fredrick
Taylor‟s early views on manufacturing to the Business Excellence models on which this
thesis focuses. Rogerson (2002) made the point that organizations tend to focus on
conformance to these models and not value created from their use. He also outlined four
future research trends, with this thesis contributing the first trend:
How Business Excellence can be used to contribute to competitive advantage
Understanding the voice of the customer
Addressing environmental issues in product and service design
Effect of IT on the core processes, such as Supply Chain and Customer
Management
Zain, Dale et al. (2001) recommended some future research trends based on an
assessment of 14 UK doctoral theses over the period 1988-1995. They categorized the
research areas into „People‟, „Systems‟ and „Techniques‟, but more importantly
categorized 12 frameworks that were a result of the work. Zain, Dale et al. (2001)
recommended a need for a 'meta model' summarizing „Whats‟ and „Hows‟ of the
challenges that organizations face as a starting point for future research. They also
noted that all the work in their sample was retrospective with very little foresight into next
generation of quality tools, approaches and paradigms. New areas, such as ecommerce, were also not taken into account, supporting the view that the dynamics of the
environment lacked consideration.
There have been calls for research into the relationship between Business Excellence
and strategy. Morgan and Piercy (1996) noted that one of the fundamental questions of
how quality may be used, as a base for competitive strategy has not been addressed and
that this was a priority area for future research. This area of research is pertinent and
applicable to industry as „this is clearly an area which is attracting a great deal of interest
and there is an urgent need to explore what senior managers are increasingly
recognizing as critical interfaces in the pursuit of sustainable competitive advantage and
superior business performance‟ (Morgan and Piercy (1996: p242)). Leonard and
McAdam (2002a) also noted that the full extent of the relationship between Business
Excellence and corporate strategy has not been made at this time.
Sirkin and Stalk (1995) suggested a link between Business Excellence and strategy. In
describing their „Capabilities-based competition‟ approach they identified three basic
24
building blocks: Mastery of business processes, Superior knowledge and Internal
organizational practices. All these three must be linked directly to the delivery of
customer value and to the creation of sustainable competitive advantage for the
company. They also noted that it is the role of top management to focus the organization
on developing these capabilities.
1.5 Research focus
®
In this Chapter the EFQM Excellence Model has been introduced and it has been
argued that interest in Business Excellence from both organizations and researchers
demonstrates that this is area where the current research will make a significant
contribution.
The relationship between strategy and Business Excellence was noted to be of particular
importance and there have been calls for more research in this area. Even a cursory
®
glance at the EFQM Excellence Model shows an overlap with the capabilities-based
competition idea of Stalk, Evans et al. (1992), suggesting that the resource-based view of
the firm was a good body of knowledge in which to ground the current research. There is
an early indication, which will be expanded in the literature overview, that the external
environment in which firms compete could have an impact on the success of a Business
Excellence approach.
The focus of this thesis is to examine whether a Business Excellence approach develops
strategic capability and whether this strategic capability leads to enhanced performance.
The scope includes examining the effect of different environments on the success of such
strategic capability development and the level of benefits derived. Being a holistic model
covering most areas of an organization‟s activities, it was appropriate to limit the scope of
®
this study to the main elements of the EFQM Excellence Model .
One area that is of particular interest is the way in which Business Excellence could
develop an organization‟s intangible assets. McDonald-Wood (2004) noted that an
organization‟s intangible assets can raise an organization‟s value by between 2 to 10
times its book value and that these intangible assets are an amalgam of knowledge,
relationships, structure, processes, systems, market position, reputation, trust and
leadership as well as the more traditional items such as intellectual property, licences and
brand. Such a view was supported by Beer and Nohria (2000) and Kristensen and
Westlund (2004b) made a direct link between Business Excellence and the value of
intangible assets.
25