online maps with apis and webservices[electronic resource]
Bạn đang xem bản rút gọn của tài liệu. Xem và tải ngay bản đầy đủ của tài liệu tại đây (14.16 MB, 313 trang )
Lecture Notes in Geoinformation and Cartography
Series Editors: William Cartwright, Georg Gartner, Liqiu Meng,
Michael P. Peterson
For further volumes:
/>.
Michael P. Peterson
Editor
Online Maps with APIs
and WebServices
Editor
Prof. Michael P. Peterson
University of Nebraska, Omaha
Dept. Geography & Geology
Nebraska
USA
ISSN 1863-2246 ISSN 1863-2351 (electronic)
ISBN 978-3-642-27484-8 ISBN 978-3-642-27485-5 (eBook)
DOI 10.1007/978-3-642-27485-5
Springer Heidelberg New York Dordrecht London
Library of Congress Control Number: 2012935753
# Springer-Verlag Berlin Heidelberg 2012
This work is subject to copyright. All rights are reserved by the Publisher, whether the whole or part
of the material is concerned, specifically the rights of translation, reprinting, reuse of illustrations,
recitation, broadcasting, reproduction on microfilms or in any other physical way, and transmission or
information storage and retrieval, electronic adaptation, computer software, or by similar or dissimilar
methodology now known or hereafter developed. Exempted from this legal reservation are brief excerpts
in connection with reviews or scholarly analysis or material supplied specifically for the purpose of being
entered and executed on a computer system, for exclusive use by the purchaser of the work. Duplication
of this publication or parts thereof is permitted only under the provisions of the Copyright Law of the
Publisher’s location, in its current version, and permission for use must always be obtained from
Springer. Permissions for use may be obtained through RightsLink at the Copyright Clearance Center.
Violations are liable to prosecution under the respective Copyright Law.
The use of general descriptive names, registered names, trademarks, service marks, etc. in this
publication does not imply, even in the absence of a specific statement, that such names are exempt
from the relevant protective laws and regulations and therefore free for general use.
While the advice and information in this book are believed to be true and accurate at the date of
publication, neither the authors nor the editors nor the publisher can accept any legal responsibility for
any errors or omissions that may be made. The publisher makes no warranty, express or implied, with
respect to the material contained herein.
Printed on acid-free paper
Springer is part of Springer Science+Business Media (www.springer.com)
Contents
Part I Background
1 Online Mapping with APIs 3
Michael P. Peterson
2 Web Mapping Services: Development and Trends 13
Manuela Schmidt and Paul Weiser
3 Current Trends in Vector-Based Internet Mapping:
A Technical Review 23
Christophe Lienert, Bernhard Jenny, Olaf Schnabel, and Lorenz Hurni
4 Map Mashups and APIs in Education 37
Emmanuel Stefanakis
Part II API Mashups
5 Multimedia Mapping on the Internet Using Commercial APIs 61
Shunfu Hu
6 The GIS Behind iMapInvasives: The “Open Source Sandwich” 73
Georgianna Strode
7 Towards a Dutch Mapping API 91
Edward Mac Gillavry, Thijs Brentjens, and Haico van der Vegt
8 LatYourLife: Applying Multiple API Services for Task Planning 105
Amin Abdalla
9 Guidelines for Implementing ArcGIS API for Flex Developers 123
Georgianna Strode
v
Part III Symbolization
10 Web Services for Thematic Maps 141
Otakar Cerba and Jachym Cepicky
11 A Technical Survey on Decluttering of Icons in Online Map-Based
Mashups 157
Haosheng Huang and Georg Gartner
12 Web Map Design for a Multipublishing Environment Based
on Open APIs 177
Pyry Kettunen, L. Tiina Sarjakoski, Salu Ylirisku, and Tapani Sarjakoski
13 User Scalable Graduated Circles with Google Maps 195
Douglas Paziak
14 Webservices for Animated Mapping: The TimeMapper Prototype 205
Barend Ko
¨
bben, Timothe
´
e Becker, and Connie Blok
15 The Possibilities of Globe Publishing on the Web 219
Ma
´
tya
´
s Gede
Part IV Applications
16 Mapping Social-Network Interactions 241
James O’Brien and Kenneth Field
17 Online Map Service Using Google Maps API and Other JavaScript
Libraries: An Open Source Method 265
Shunfu Hu
18 Online Information Dissemination at the Wisconsin State
Cartographer’s Office Using Map Services and APIs 279
Howard Veregin and Timothy Kennedy
19 WebGIS Systems for Planetary Data Access at the PDS
Geosciences Node 299
J. Wang, D.M. Scholes, and K.J. Bennett
Index 315
vi Contents
Contributors
Amin Abdalla Research Group Geoinform ation, Geoinformation and Cartogra-
phy, Vienna University of Technology, Wien, Austria,
ac.at
K.J. Benn ett Department of Earth and Planetary Sciences, Washington University
in St. Louis, St. Louis, MO, USA, bennett@ wunder.wustl.edu
Thijs Brentjens Geonovum, Amersfoort, The Netherlands, t.brentje ns@
geonovum.nl
Otakar Cerba Section of Geomatics, Department of Mathematics, University of
West Bohemia in Pilsen, Plzen, Czechia, ota.cerba@sez nam.cz
Jachym Cepicky Section of Geomatics, Department of Mathematics, University
of West Bohemia in Pilsen, Plzen, Cz echia
Kenneth Field ESRI Inc, Redlands, CA, USA, j.fi
Georg Gartner Research Group Cartography, Department of Geoinformation and
Cartography, Vienna University of Technology, Vienna, Austria, georg.
Edward Mac Gillavry Webmapper, Haarlem, The Netherlands,
Ma
´
tya
´
s Gede Department of Cartography and Geoinformatics, Eo
¨
tvo
¨
s Lornd
University, Budapest, Hungary,
Shunfu Hu Department of Geography, Southern Illinois University, Edwardsville,
IL, USA,
vii
Haosheng Huang Research Group Cartography, Department of Geoinformation
and Cartography, Vienna University of Technology, Vienna, Austria, haosheng.
Lorenz Hurni Institute of Cartography, ETH Zurich, Zurich, Switzerland,
Bernhard Jenny Department of Geosciences, Oregon State University, Corvallis,
OR, USA,
Timothy Kennedy Wisconsin State Cartographer’s Office, University of
Wisconsin-Madison, Madison, WI, USA,
Pyry Kettunen Department of Geoinformatics and Cartography, Finnish Geodetic
Institute, Masala, Finland, Pyry.Kettunen@fgi.fi
Barend Ko¨bben Faculty of Geo-Information Science and Earth Observation,
ITC – University of Twente, Enschede, The Netherlands,
Christophe Lienert Institute of Cartography, ETH Zurich, Zurich, Switzerland,
James O’Brien Kingston University London, Centre for GIS, London, United
Kingdom,
Doug Paziak Private Cartographic Contractor, 7528 Pinkney Street, Omaha,
NE 68134, USA,
Manuela Schmidt Institute of Geoinformation and Cartography, Vienna
University of Technology, Wien, Austria,
Olaf Schnabel Department for City Planning, Zurich, Switzerland, olaf.
D.M. Scholes Department of Earth and Planetary Sciences, Washington
University in St. Louis, St. Louis, MO, USA,
Emmanuel Stefanakis Department of Geodesy and Geo matics Engineering,
University of New Brunswick, Fredericton, NB, Canada,
Georgianna Strode Florida Resources and Environmental Analysis Center
(FREAC), Florida State University (FSU), Tallahassee, FL, USA, GStrode@admin.
fsu.edu
viii Contributors
Haico van der Vegt Kadaster, Apeldoorn, The Netherlands, Haico.Vegt@
kadaster.nl
Howard Veregin Wisconsin State Cart ographer, University of Wisconsin-
Madison, Madison, WI, USA,
J. Wang Department of Earth and Planetary Sciences, Washington University in
St. Louis, St. Louis, MO, USA,
Paul Weiser Institute of Geoinformation and Cartography, Vienna University of
Technology, Vienna, Austria,
Contributors ix
.
Part I
Background
Chapter 1
Online Mapping with APIs
Michael P. Peterson
Abstract Bringing maps to users has been made much easier with the World Wide
Web. Millions of maps now make their way through a world-wide network of
computers. A major change occurred in 2005 in how those maps were delivered
when Google Maps implemented a tile-based mapping system based on AJAX that
facilitated interactive zooming and panning. The following year, an Application
Programmer Interface (API) was released that gave programmers access to the
underlying mapping functions. It was now possible to place data on top of the
Google base map and make this map available to anyone. This system was created
at tremendous expense. It is calculated that the number of tiles required at 20 zoom
levels is nearly 1.5 trillion. At 15 KB per tile, this equates to 20 Petabytes or 20,480
TB and a data storage cost of between US $2 million and US $2 billion per data
center. This expenditure indicates the level of importance that online companies
place on maps. It also represents a shift in how maps of all kinds are delivered to
users. Mobile devices are a further indication of this change in map delivery.
1.1 Introduction
This book is about new approaches for online mapping, a form of map presentation
that can trace its origins to the introduction of the graphical World Wide Web in
1993. The Web drastically expanded the use of the Internet for the distribution of
maps. Apps on mobile devices have since become a primary way that maps are
delivered to users.
Since the introduction of Google Maps in 2005, online mapping has been defined
by Application Programming Interfaces (APIs). These online software libraries
provide the means to acquire, manipulate and disp lay information from a variety
M.P. Peterson (*)
Department of Geography/Geology, University of Nebraska at Omaha, Omaha, NE 68182, USA
e-mail:
M.P. Peterson (ed.), Online Maps with APIs and WebServices,
Lecture Notes in Geoinformation and Cartography,
DOI 10.1007/978-3-642-27485-5_1,
#
Springer-Verlag Berlin Heidelberg 2012
3
of sources. Altho ugh APIs are used for many different types of applications, the
creation of maps is one of the major uses. The relat ive ease of overlaying all types
of information with online mapping APIs has further transformed cartography from
a passive to an active enterprise.
APIs are the basis of map mashups. The term mashup was first used for a
movement in pop music that involved the digital mixing of songs from different
artists and genres. In technology, the term is used for a melding of web reso urces
and information. A mashup combines tools and data from multiple online sources.
The most common mashup application is the mapping of data.
Mashups are an integral part of what is common ly referred to as Web 2.0.
Beginning about 2004, the term Web 2.0 began to be used for a variety of innova-
tive resources, and ways of interacting with, or combining web content. In addition
to mashups, Web 2.0 also includes wikis, such as Wikipedia, blog pages, podcas ts,
RSS feeds, and AJAX. Social networking sites like MySpace and Facebook are also
seen as Web 2.0 applications.
The advantage of using a major online mapping site is that the maps represent a
common and recognizable representation of the world – a base map. Overlaying
features on top of these maps provides a frame of reference for the map user. A
particular advantage for thematic mapping is the ability to spatially reference
thematic data. In the past, thematic maps have limited the display of spatial
reference information such as cities and transportation networks partly to empha-
size the distribution being mapped. The inclusion of these features provides valu-
able locational information to the thematic map user.
This chapter provides an overview to online mapping with APIs, and an over-
view of this volume.
1.2 The Online Base Map
Google Maps changed the online mapping landscape. Known for its search engine,
Google effectively added a map-based search through Google Maps. In the process,
they found a more effective way to indirectly make money from online maps by
charging businesses to be found. In addition, by not including ads around the map,
like MapQuest, they left more room for the map on the computer screen. More
importantly, from a map user’s perspective, Google Maps changed the way we
interact with maps.
The delivery of a Google Map is based on image tiling. This technique had been
used since the early days of the World Wide Web to speed the delivery of graphics.
In comparison to text, images require more storage and therefore take longer to
download. A solution is to divide the image into smaller segments, or tiles, and send
each tile individually through the Internet. These smaller files often travel faster
because each can take a different route to the destination computer. The tiles are
reassembled on the receiving end in their proper location on the web page. With a
moderately fast Internet connection, all of this occurs so quickly that the user rarely
4 M.P. Peterson
notices that the image is actually composed of square pieces. With slower
connections, the individual tiles are clearly evident.
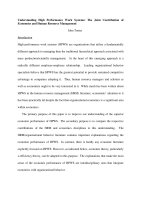
Figure 1.1 depicts a series of map tiles at different levels of detail (LOD). All
tiles are 256 Â 256 pixels and require about 15 KB a piece to store in the PNG
format. Table 2.1 shows the number of tiles that are used in a tile-based mapping
system for 20 levels of detail (LOD), or zoom levels, and the associated storage
requirements and estimated storage costs. With 20 LODs, approximately one
trillion tiles are needed for the whole world. At an average of 15 KB per tile, the
total amount of memory required is 20 Petabytes, or 20,480 Terabytes. No single
computer currently has this much storage capacity.
The cost of storing this much data has not been made public by Google or any
other company. It is estimated in Table 1.1 based on a cost of about US $100 per
Terabyte, the cost of a hard-drive in 2011 that does not include the housing or
computer connection. As can be seen from Table 1.1, storing the entire one trillion
tiles on disk drives woul d be about US $2 million ($100 Â 20,480 TB). This
assumes that all of the tiles are pre-made and stored. It is likely that many of the
less popular tiles are ‘made-on-the-fly’ when they are requested.
In order to achieve faster response times, there is strong indication that data
centers use faster random-access memory (RAM) to cache the most popular map
tiles. At the current US $30 for 1 GB of RAM, storing the entire map of the world
10
th
LOD
13
th
LOD 14
th
LOD 15
th
LOD
11
th
LOD 12
th
LOD
Fig. 1.1 Individual map tiles from Google Map at six different levels of detail (zoom levels). In
2005, Google introduced a tiling system to deliver online maps. Over a trillion tiles are used for
Google’s 20 zoom levels
1 Online Mapping with APIs 5
would be more than US $629 million (see Table 1.1). If all tiles are stored on either
a disk drive or in RAM, we could estimate that the cost of map storage at each data
center would be somewhere between $2 and $629 million. Google maintains more
than 30 data centers. A still faster storage option would be to use a graphical
processing unit (GPU). These devices are specifically designed to store and manip-
ulate images and transfer image data much faster than computer memory. Map
storage on GPUs would be at least twice as expensive as RAM, or about $1.3 billion
for a map of the world at 20 levels of detail.
These data storage requirements and costs are only for a single map. The satellite
view, with tiles in the JPEG format, requires approximately the same amount of
storage space. Other maps provided by Google are the Terrain view (offered at only
15 levels of detail) and the bicycle map (12 larger scale levels of detail). All other
maps are transparent overlays. Combining all of these data storage costs – perhaps
as much as $2 billion, provides some indication of the importance placed on maps
by Google and other companies.
Table 1.1 The number of tiles, storage requirements, and storage costs used by a tile-based online
mapping system to represent the world at different levels of detail (LOD) or zoom levels
Levels
of
detail
(LOD)
Number of tiles Ground
distance per
pixel in
meters
Storage
requirements at 15
KB per tile
Disk storage
costs at US
$100 per
Terabyte
RAM storage
costs at US
$30 per
Gigabyte
1 4 78,272 60 Kilobytes (KB) $0.000006 $0.002
2 16 39,136 240 KB $0.00002 $0.007
3 64 19,568 968 KB $0.0001 $0.03
4 256 9,784 3.75 Megabytes $0.0004 $0.11
5 1,024 4,892 15 MB $0.001 $0.44
6 4,096 2,446 60 MB $0.006 $1.76
7 16,384 1,223 240 MB $0.02 $7.03
8 65,536 611.50 960 MB $0.09 $28.13
9 262,144 305.75 3.75 Gigabytes (GB) $0.37 $112.50
10 1,048,576 152.88 15 GB $1.46 $450.00
11 4,194,304 76.44 60 GB $5.86 $1,800.00
12 16,777,216 38.22 240 GB $23.44 $7,200.00
13 67,108,864 19.11 968 GB $93.75 $28,800.00
14 268,435,456 9.55 3.75 Terabytes (TB) $375 $115,200.00
15 1,073,741,824 4.78 15 TB $1,500 $460,800.00
16 4,294,967,296 2.39 60 TB $6,000 $1,843,200.00
17 17,179,869,184 1.19 240 TB $24,000 $7,372,800.00
18 68,719,476,736 0.60 960 TB $96,000 $29,491,200
19 274,877,906,944 0.30 3.75 Petabytes (PB) $384,000 $117,964,800
20 1,099,511,627,776 0.15 15 PB $1,536,000 $471,859,200
Total 1,466,015,503,700 20,480 TB or 20 PB $2,048,000 $629,145,600
6 M.P. Peterson
1.3 Mapping APIs
Introduced in 2005, shortly after Google Maps, the Google Map API consists of a
series of map-related functions (Google Maps JavaScript API V3 Basics 2011).
These functions control the appearance of the map, including the scale, position,
and any added information in the form of points, lines or areas. The purpose of the
API is to make it possible to incorporate user-defined maps on websites, and to
overlay information from other sources. The use of the Google Maps API is free,
provided the site does not charge for access and does not generate more than 25,000
maps a day. Designed for business applications, a pay version of Google maps,
called Google Maps API Premier, provides some additional functions dealing with
geocoding and usage tracking.
Soon after the introduction of Google Maps in 2005, Microsoft, Yahoo!, and
MapQuest changed their online mapping service to incorporate an AJAX-type
interface. By 2006, Yahoo! had released its own API. The Yahoo! Maps API is
much the same as Google’s implementation but does not support polygons and still
requires the use of an electronic key. While the key is made freely available, it
limits the use of the API to the server that is specified when the key is requested.
Other online map providers include OpenStreetMap, ESRI, and Nokia (OviMap).
In mid-2009, Microsoft re-labeled its Live Local web mapping service to Bing
Maps, a part of the company’s search engine services. Bing Maps includes a street
map, an aerial view, Bird’s-Eye view, StreetSide view, and 3D Maps. The oblique
Bird’s Eye view has more detail than Google’s satellite view. In contrast to the
Yahoo! Maps API, Bing Maps does support polygons. Most other online map
providers include an API.
The development of APIs is still in an early stage and is progressing in a
haphazard manner. While very similar, the function calls used by the major
providers have slight differences and it is time-consuming to re-write the code for
each. A standard set of functions has been developed that works with many online
mapping systems. The open source Mapstraction API makes it possible to easily
switch between each of the mapping APIs but implements only the common
functions (Duvander 2010).
Google is still leading the development of mapping APIs with regular additions
of new functions. The current Google Maps v3 was introduced specifically to meet
the needs of online mapping through mobile devices. It reduces the amount of data
communications overhead, thus increasing the speed of map display.
1.4 Behind the Online Base Map
While online maps can be based on any type of server they are usually associated
with data centers – specialized buildings, usually without windows, that house a
large number of computers. Figure 1.2 depicts the Google data center in Council
1 Online Mapping with APIs 7
Bluffs, Iowa, and part of the associated power facilities behind the main building.
Diesel generators are used to make certain that electricity is available in case of a
power failure. A lead-acid battery back-up system is in place to power the
computers until the generators are running. To reduce power demands, not all
services are maintained during power outages. It has been reported that, in the
case of a natural disaster such as an earthquake, Google data centers in California
have contingencies to acquire diesel fuel by helicopter.
Power is a major concern for a data center. Each is estimated to use 10 MW
of electricity, requiring about ten large diesel generators. Google has calculated
the amount of energy used for each search done through its search engine. They
estimate that each search requires 0.0003 kWh. In terms of greenhouse gases,1,000
search requests generates the equivalent CO
2
of a car driven 1 km (0.61 miles)
(search: Powering a Google Search). Partly to reduce costs and greenhouse
emissions, companies operating data centers have invested in renewable energy.
The major innovation introduced by Google Maps is the incorporation of
Asynchronous JavaScript and XML (AJAX) into the relationship between the server
and client. This was the culmination of many years of effort to re-shape interaction
through the Internet. Essentially, AJAX maintains a continuous connection with the
server – exchanging small messages in the background even when the user has n ot
made a specific request (Garrett 2005). This leads to faster server responses when
the user does make a request. AJAX might be thought of as an application that
works in the background of a browser to anticipate what the user might want and be
ready to communicate with the server to respond to a request. Operations in Google
Maps that are particularly assisted by AJAX include zooming and panning, the most
common form of interaction with maps.
AJAX is not a programming language in itself but a term that refers to the
combined use of a group of different technologies. The technique uses a mix of
HTML, Cascading Style Sheets (CSS), Document Object Model (DOM), and the
eXtensible Markup Language (XML). These are all freely available technologies.
Asynchronous communication is used to exchange data with the server while the
user is idle so that the entire web page does not need to be reloaded each time the
Fig. 1.2 Google data center in Council Bluffs, Iowa. Power generators, pictured on the right, are
located behind the windowless main building
8 M.P. Peterson
user makes a change (see Fig. 1.3). The result is increased interactivity, speed, and
an improved user interface.
AJAX eliminates the usual start-stop-start-stop type of interaction. When the m ap is
scrolled, addition al map t iles are automatically downloaded. T he tiles are added
almost instantly because a connection is maintained to the server so that additional
tiles can be quickly loaded. As the user scrolls, more of the map or satellite image is
downloaded from t he server without the user sp ecifically asking for t he additional tiles.
Asynchronous communication is made possible by the AJAX engine, JavaScript
code that resides between the user and the server. Instead of loading the webpage at
the start of a web session, the AJAX engine is initially loaded in the background.
CLIENT
TIME
SERVER
CLIENT
TIME
SERVER
user activity user activity user activity
system
processing
system
processing
data transmission
data transmission
data transmission
data transmission
Classic Web Application Model (synchronous)
server-side
processing
data transmission
data transmission
server-side
processing
data transmission
data transmission
server-side
processing
data transmission
data transmission
server-side
processing
data transmission
data transmission
Ajax Web Application Model (asynchronous)
user activity
browser
client-side processing
Ajax engine
input
input
input
input
display
display
display
display
Fig. 1.3 The typical client–server communication is synchronous (top illustration ). AJAX uses
asynchronous communication between the client and the server. A connection is maintained to the
server to speed interaction
1 Online Mapping with APIs 9
Once loaded, the XMLHttpRequest object begins its work. This JavaScript code
downloads data from the server without refreshing the web page. A user action
that normally would generate an HTTP request to the server becomes instead a
JavaScript call to the AJAX engine. If the engine can respond to a user action, no
response from the server is required. If the AJAX engine needs something from
the server in order to respond to a user request – such as retrieving new data – the
engine makes the request without interrupting the user’s interaction with the
application. AJAX has effective ly transformed the online client/server experience.
1.5 Web Mapping Services
A considerable amount of geographic information has been placed into GIS
databases since these systems came into widespread use in the 1980s. In order for
this information to be useful to more people, a method was needed for “pulling” the
information from the database. In 1999, the Open Geospatial Consortium defined a
set of standards for distributing geographic data (OGC 2011). The purpose was to
both facilitate the distribution of data and make layers of information easily
available to Internet users. A series of standardized services were defined to supply
geodata to any platform connected to the Internet. With this standard method of
data access, a web mapping service is able to interact with and display maps
through an Internet-based interface.
Initially, extracting information to a GIS database required interacting with a
large and complicated database. Th e OGC streaml ined the process by placing the
burden for extracting data on the server. As defined by OGC, the web mapping
service consists of two functions: (1) GetCapablites that defines the capabilities
of the server such as the supported file formats, the available map layers, and
the method of display; and (2) GetMap that tells the database what is needed.
The database reads the request and creates the map-based data based on the
requirements laid out by GetCapabilities. The data is then sent to the web mapping
service.
Most web mapping services support a handful of other functions. For example,
“GetFeatureInfo” sends specific information about locations on the map, such as the
name of the road or the height of a location. “GetLegendGraphic” function deals
with the symbols used on the map.
The OGC standard leads to the definition of a variety of services, including:
Web Map Service (WMS) – georeferenced map images typically in the form of
raster tiles (PNG, GIF, or JPG), but they can also be in a vector format. Requests
are made using a standard web URL address.
Web Coverage Service (WCS) – a geographical area that can be overlaid on a map
but cannot be edited or analyzed. WCS is used to transfer coverages that consist
of objects such as data points, pixe ls, or paths defined with vectors.
10 M.P. Peterson
Web Feature Service (WFS) – allows the request for geogr aphical features, essen-
tially the information behind the map. WFS web service allows features to be
queried, updated, created, or deleted by the client. The data is usually provided
in an XML format like GML.
The open source GeoServer application is the reference implementation of a
server for the WMS, WFS, and WCS standards.
1.6 Mobile Mapping
Mobile devices have provided a new, portable medium for maps. Screens on cell
phones have become larger, positioning technologies have improved, and all types
of location-aware applications have been developed. Location Based Systems
(LBS) emerged with the overall goal of providing information specific to the
current location of the mobile user.
While the Internet and mobile phones developed during the same time period,
there were major differences in how they developed. For example, the Internet
originated through a government program while the mobile phone network was
largely created by private interests. There was very little government involvem ent
in building the mobile phone network. In Europe, governments mandated that
mobile phone com panies share cell phone towers. The more laissez-faire approach
in the United States resulted in every company building their own towers. For a
country as large in area as the US, this contributed to significantly greater costs for
infrastructure development. These costs were passed to users, increasing subscrip-
tion prices and slowing adoption.
Despite the added expense of owning and using mobile phones, the number of
mobile phone subscribers quickly surpassed the number of Internet users. The
Computer Industry Almanac (2005) reporte d in 2005 that the worldwide number
of cellular subscribers surpassed 2 billion – exactly twice as many Internet users at
that time and up from only 11 million in 1990 and 750 million in 2000. The use of
cell phones expanded rapidly during the first decade of the twenty-first century with
4.6 billion subscribers by 2010.
While the US Federal Communications Agency maintained a laissez-faire rela-
tionship with the cell phone industry, it did mandate automatic location identifica-
tion (ALI) on mobile phones. ALI stipulated positio ning within 100 m or less to
ensure that emergency workers could find cell phone callers. Wireless carriers were
required to have 95% ALI-capable handsets among their subscriber bases by
Dec. 31, 2005. The ALI mandate was the main impetus for the growth of loca-
tion-aware cell phones, at least in the US (GPS World 2007).
In order to comply with ALI, most carriers initially decided to integrate GPS
technology into cell phone handsets rather than overhaul the tower network used to
triangulate the position of mobile phones . GPS does not work inside of buildings
and is power hungry, quickly draining mobile phone batteries. For these reasons,
1 Online Mapping with APIs 11
cell towers were eventually upgraded to support position finding. Of the 3.3 billion
cell phones in use in 2008, only 175 million had GPS (Bray 2008).
Initially, a location-aware mobile phone would only determine its location if
an emergency call was made. It was not possible to get direct access to location
data. Later, location data was provided continuously as an aid to navigation,
transforming mobile phones into personal navigators. Many people now access
maps primarily through their mobile devices.
1.7 Summary
The online map is a new entity. The first map to be incorporated within a web page was
displayed by Mosaic web browser in 1993. Initially, scanned paper maps pre-
dominated as online maps. Database driven maps appeared in the latter part of the
1990s, along with the growth of data centers. Mobile devices began to be used
extensively for map delivery beginning with the introduction of Apple’s iPhone in
2007.
With all of these changes in the way maps are delivered to users, it is appropriate
to examine the process by which this is done, the various applications, and how
these maps can be improved. This is the overall purpose of this book. A culmination
of many years of work by the Maps and the Interne t commission of the International
Cartographic Association, authors are from Austria, Czechia, Finland, Hungary, the
Netherlands, Switzerland, United Kingdom, and the United States. The first part of
the book examines the background of the online map. The second looks specifically
at mash-ups. The third part examines methods of symbolization, and the last part
examines applications.
References
Bray H (2008) GPS turns cell phones into powerful navigators. Boston Globe, April 17
Duvander, Adam (2010) Map Scripting 101: An example-driven guide to building interactive
maps with Bing, Yahoo!, and Google Maps. San Francisco: No Starch Press.
Computer Industry Almanac (2005) China tops cellular subscriber top 15 ranking. http://www.c-i-a.
com/pr0905.htm
Garrett JJ (2005) Ajax: a new approach to web applications. AdaptivePath.com, Feb. 18.
Accessed 19 June 2008
Google Maps JavaScript API V3 Basics (2011) (search: Google Maps Javascript API V3 Basics)
GPS World (2007) FCC to require full E911 adherence by 2012. GPS World, 12 Sep 2007
Open Geospatial Consortium (2011) OGC standards and specifications. ht tp://www.opengeospatial.
org/standards
12 M.P. Peterson
Chapter 2
Web Mapping Services: Development
and Trends
Manuela Schmidt and Paul Weiser
Abstract Web mapping services like Google, introduced in 2005 have altered the
online mapping experience. Not only could maps be viewed in a fast and simple
way but there was also the possibility to create Mashups through APIs, leading
some to proclaim the “democratization of mapping”. Addressed here is the devel-
opment of these mapping services, how they impacted the existing Web mapping
environment and possible future areas of development. An emphasis is placed on
the technical developments from desktop to mobile applications, as well as the
development of base maps and map types from pre-rendered tiles to editable map
styles in different viewing modes from bird eye view, 3D, and augmented reality.
While the first maps produced with APIs were mostly static point maps, new
features have enabl ed dynamic and interactive applications with “GIS-like”
functionalities, often supported by third party implementations.
2.1 Introduction
In 2006, a year after the appearance of Google Map Mashups, the free software
developer and activist Erle Schuyler summarized the state of map APIs as follows:
At present, all that these map APIs offer is ultimately a way to put points on a map – what
we’ve [ ] referred to as “red dot fever”. [ ] Where is the broader palette for telling new
and different stories on the Web with maps? Where is the bi-directionality, the interactivity,
the Wiki nature? (Schuyler 2006)
Before proceeding, it is good to ask whether much has changed since Schuyler’s
assessment.
M. Schmidt (*)
Institute of Geoinformation and Cartography, Vienna University of Technology,
1040 Vienna, Austria
e-mail:
M.P. Peterson (ed.), Online Maps with APIs and WebServices,
Lecture Notes in Geoinformation and Cartography,
DOI 10.1007/978-3-642-27485-5_2,
#
Springer-Verlag Berlin Heidelberg 2012
13
One way to answer this question is to explore the stages of development of Web
mapping services. Figure 2.1 shows a time-line depicting the release of important
tools of Web mapping services on the one side and the introduction of related tools,
projects, and products on the other. The following section will focus on
2009 201020082007200620052004
Release of Google Maps API
Release of Yahoo Maps
Release of Google Earth
Release of Google Maps
Google My Maps
Google Street View
Google MapMaker
Google Maps Mobile:
Vector, 3D navigation
Google Maps Navigation:
free turn-by-turn navigation
Google Fusion Tables
Google Styled Maps
Google Earth Browser Plug-in
Release of Windows Live Local
including Bird’s Eye View
Launch of OpenStreetMap
Launch of Wikimapia
Release of OpenLayers
Release of Mapstraction
Launch of CloudeMade StyleEditor
KML 2.2 W3C Standard
Introduction of first iPhone
Release of Microsoft Silverlight
Release of ArcGIS Explorer
Introduction of first G1:
Android Phone with GPS and compass
Introduction of Wikitude Drive:
first Augmented Reality navigation
housingmaps.com: First map mash-up
Launch of NASA World Wind
Fig. 2.1 Development of web mapping services depicted by some exemplary services and tools
14 M. Schmidt and P. Weiser
cartographic aspects by discussing the different map and content types as well as
map styles. Section 2.3 gives an overview on advances in API technology by
highlighting the aspects of widespread usage, mobile usage and expert usage of
Web mapping services. The final chapter gives a short summary and discussion.
2.2 Development of Online Maps
When Google published its Web mapping service in 2005, it was the first free
service providing a global coverage of satellite map views (Purvis et al., 2006).
Other companies followed offering satellite as well as road map views. They
usually also provided a hybrid view, i.e., the combination of a road network and
satellite views. Most road network data, however, was restricted to areas covered by
commercial data providers. We argue that maps have changed considerably since
that. The following paragraphs give an overview of the new types of maps and new
approaches to map content and styles.
2.2.1 Map Types
Parallel to the launch of 2D web mapping services, 3D desktop applications like
NASA World Wind and Google Earth were introduced. Shortly after, Microsoft
integrated the 3D terrain view in the browser, at some places complemented with
3D buildings; however , a proprietary plug-in was needed to access this version. In
2008 also Google published a plug-in offering Google Earth’s 3D capability in a
browser (Google 2008a). In addition to 3D and different aerial views, another street
map view created considerable controversy: panoramic, street-level imagery called
“Street View” (Google) or “StreetSide View” (Bing).
An early innovation in addition to the basic map, satellite, hybrid view, was the
“Bird’s Eye View” integrated in Windows Live Local (now: Bing Maps) (CNet
2005), not only giving top-down aerial views, but images taken at an oblique, 45
angle, allowing for a view on the front and back sides of buildings. The drawback of
this feature, however, is that only areas with a high population are covered.
Concerning the map itself, an improvement to the standard map view was the
Google Maps “Terrain” view introduced in 2007 (Google 2007b), that displays
physical features, i.e., shaded relief representation.
Most map services allow users to integrate new custom map types. This requires
pre-rendering of the host titles and their storage on a server. Third party tools and
open source scripts appeared that support the rendering of tiles from different data
sources and their hosting on a cloud-server. Figure 2.2 compares the map type
choices of Google Maps in 2005 to those in 2011. However, some of the options do
not refer to map types, but to image or real-time data overlays, such as “Photos” or
“Traffic”.
2 Web Mapping Services: Development and Trends 15
2.2.2 Map Content
Base maps are based on a mixture of public data commercial data. The two major
data provider are NavTeq and TeleAtlas. However, these data are costly, quickly
outdated and restricted to specific areas covered by the data acquiring companies.
Large companies have invested large sums of money to purchase smaller com-
panies to acquire their data (e.g., Nokia acquiring NavTeq (Nokia 2007), Microsoft
acquiring the Imagery and Remote Sensing Company Vexcel (Microsoft 2006)).
For an easier and cheaper data acquisition, Google introduced a tool called Map
Maker in 2008, that enabled users to contribute data themselves (Google 2008b).
This tool was only available for areas with no or little commercial data coverage,
e.g., India, Pakistan, Iceland. Within a short time, large areas were mapped in this
crowd-sourcing manner.
This user-generated approach is also used in a project called OpenStreetMap that
tries to build a free map database of the world. Until now, many Web mapping
service providers shied away from using OpenStreetMap data, because of unclear
license terms and a claimed lack of quality assurance. However, studies quality of
OpenStreetMap data in comparison to commercial data vendors (e.g., Haklay 2010;
b
a
Fig. 2.2 Simple map type
control in the first Google
Maps release in 2005 for map,
satellite and hybrid view (a).
Extended map type control of
Google Maps in January 2011
(b). Map types include real-
time data overlays such as
traffic
16 M. Schmidt and P. Weiser