economic modeling of water[electronic resource] the australian cge experience
Bạn đang xem bản rút gọn của tài liệu. Xem và tải ngay bản đầy đủ của tài liệu tại đây (2.27 MB, 194 trang )
Economic Modeling of Water
GLOBAL ISSUES IN WATER POLICY
VOLUME 3
Series Editors
Ariel Dinar
José Albiac
Eric D. Mungatana
Víctor Pochat
Rathinasamy Maria Saleth
For further volumes:
/>Glyn Wittwer
Editor
Economic Modeling
of Water
The Australian CGE Experience
Editor
Dr. Glyn Wittwer
Centre of Policy Studies
Monash University
Wellington Road
11th Floor, Menzies Building 11E
Clayton, VIC 3800
Australia
ISSN 2211-0631 e-ISSN 2211-0658
ISBN 978-94-007-2875-2 e-ISBN 978-94-007-2876-9
DOI 10.1007/978-94-007-2876-9
Springer Dordrecht Heidelberg New York London
Library of Congress Control Number: 2012934055
© Springer Science+Business Media Dordrecht 2012
This work is subject to copyright. All rights are reserved by the Publisher, whether the whole or part of
the material is concerned, specifi cally the rights of translation, reprinting, reuse of illustrations, recitation,
broadcasting, reproduction on microfi lms or in any other physical way, and transmission or information
storage and retrieval, electronic adaptation, computer software, or by similar or dissimilar methodology
now known or hereafter developed. Exempted from this legal reservation are brief excerpts in connection
with reviews or scholarly analysis or material supplied specifi cally for the purpose of being entered and
executed on a computer system, for exclusive use by the purchaser of the work. Duplication of this
publication or parts thereof is permitted only under the provisions of the Copyright Law of the Publisher’s
location, in its current version, and permission for use must always be obtained from Springer. Permissions
for use may be obtained through RightsLink at the Copyright Clearance Center. Violations are liable to
prosecution under the respective Copyright Law.
The use of general descriptive names, registered names, trademarks, service marks, etc. in this publication
does not imply, even in the absence of a specifi c statement, that such names are exempt from the relevant
protective laws and regulations and therefore free for general use.
While the advice and information in this book are believed to be true and accurate at the date of
publication, neither the authors nor the editors nor the publisher can accept any legal responsibility for
any errors or omissions that may be made. The publisher makes no warranty, express or implied, with
respect to the material contained herein.
Printed on acid-free paper
Springer is part of Springer Science+Business Media (www.springer.com)
v
By 2030, the OECD predicts that over half the world’s population will be living
with water scarcity. By this they mean that these people will be living in a world
where water availability, or more correctly the lack of it, limits economic opportunity.
To get to the bottom of this issue, one needs to understand how local water supply
conditions infl uence water use and what changes in availability mean for local,
regional, and national economies.
Before the advent of TERM – The Enormous Regional Model – any discussion
about the likely impacts of changes in water policy or changes in supply tended to
be based on a combination of some partial analysis coupled with speculative
assertions about fl ow on effects to other sectors. As any CGE modeler will tell you,
in the complex world we live in, changes in one sector often have counterintuitive
implications for other sectors. Assertion making is a risky and unwise business to
be in. The recommended approach is to use a model to estimate the likely impacts
of a change in one sector on all other sectors. Expect to be surprised.
For many problems, fi ne scale insights are needed. One needs to know which
industries in which towns will gain income and which will lose income. It is impor-
tant to know how quickly people can adjust. TERM was built to allow such analysis.
Think about 50 regions each with 170 sectors. Yes, TERM is enormous, and yes, it
is constructed from the “bottom up.” But, by taking a bottom-up approach, the detail
that determines the fate of any region and its relationship with all other regions can
be captured realistically.
This book shows how such models can be built. But the book does not stop there.
Catchments and rivers have little respect for statistical survey boundaries so TERM’s
architects have spent considerable time working out how to convert a conventional
regional CGE model into one that respects catchment and other biophysical boun-
daries. This is no easy task but, once completed, the resultant model is extremely
powerful. The power comes from the use of regional boundaries that are consistent
with the very same regions that people are arguing about.
TERM-H2O demonstrates the potential of this approach. The boundaries used align
with catchment, not statistical division boundaries, and the amount of water available
for use in each region described precisely. Objective exploration of the effects of water
Foreword
vi
Foreword
scarcity, policy changes, and government expenditure becomes possible. Moreover,
because the boundaries used align with catchment boundaries, it is diffi cult for water
managers to dismiss the results as irrelevant. Instead, they are given a platform that
allows them to examine impacts at local, regional, and national levels.
The development of TERM-H2O and, more importantly, the completion of this
book enable others to see how to build such a model. It represents an important
breakthrough.
The power of models like TERM-H2O to bring objectivity to complex political
issues is important. This is best demonstrated in Chaps. 6 and 7 of this book.
Chapter 6 is about the impacts of a government water entitlement buyback
scheme in Australia’s Murray Darling Basin. Water entitlements are traded throughout
this region, and in an attempt to resolve over-allocation problems, the government
has been purchasing water entitlements and transferring them to a body responsible
for making water available for environmental purposes. Many irrigation communities
are strongly opposed to this buyback program because they perceive the resultant
capital fl ight would destroy their livelihood. TERM-H2O shows that the reverse is
the case. Buyback programs increase economic activity in the region.
TERM-H2O has also been used to show that most of the adverse fi nancial impacts
experienced by irrigators in recent times can be explained by the severity of the
drought not government policy reforms (see Chap. 7 ). Variants of TERM work in
urban, as well as rural areas, and in Chap. 8 one can see how models like this can be
used to assess the merits of different water infrastructure and demand management
options. Powerful insights about the economic wisdom of different investment
strategies emerge.
In summary, the power of modeling systems like TERM-H2O has proven to be
greater than many people had expected. This power comes from the richness that
fl ows from the construct of models whose regions align with catchments rather than
broader statistical areas, have hydrological integrity, and allow objective exploration
of options at a level of detail and complexity consistent with the way people talk
around a dinner table.
Is this approach generally applicable? The answer is a resounding yes – read
Chap. 9 .
The world we are living in is changing rapidly and becoming increasingly
complex; the approach taken in this book is one that should be applied to all
problems. The future will be much better if we explore options carefully and avoid
listening to those who make assertions that cannot be shown to be real.
Prof. Mike Young
Executive Director, The Environment Institute
The University of Adelaide, Australia
Reference
OECD (2009) Managing water for all: an OECD perspective on pricing and fi nancing. OECD, Paris
vii
Multiregional national CGE modeling took a dramatic turn in 2002 when Mark
Horridge devised a new approach to regional representation in TERM (The
Enormous Regional Model). The Australian version of this new model became
available just in time to undertake modeling of the 2002–2003 drought. The new
model was based on a massive master database which had to be aggregated to
undertake any simulation. In theory, this implied that the model could be aggregated
to focus on any number of issues in the Australian economy. In practice, water
issues have dominated the model’s use.
Starting in 2003, various government agencies including the Productivity
Commission, the Murray-Darling Basin Authority, and Victoria’s Department of
Primary Industries have commissioned studies concerning the Murray-Darling
Basin that required use of the model. CSIRO funded a study of rural and urban
water usage. The Productivity Commission has also sponsored database develop-
ment that has been important in improving the model. Consulting fi rms, including
Frontier Economics, Marsden Jacob Associates, and Deloitte Touch Tohmatsu,
have subcontracted work to the Centre of Policy Studies requiring TERM.
Two Australian Research Council grants have been instrumental in TERM-H2O
development. The fi rst (LP0667466) was undertaken through a linkage with Victoria’s
Department of Sustainability and the Environment. The second (DP0986783) pro-
vided the resources to bring this volume into being.
A number of people in government departments and consulting fi rms mentioned
above have assisted us in various ways in developing TERM-H2O, thereby bringing
this volume into being. I thank in particular Michael Vardon for ongoing guidance
on database development, and Mike Young, who remains an inspiration for others
pursuing water issues in Australia and the rest of the world. Nadya Ivanovna
provided invaluable background information for the fi nal chapter.
Glyn Wittwer
Preface
ix
1 Practical Policy Analysis Using TERM 1
Glyn Wittwer
Part I The TERM Approach
2 The TERM Model and Its Database 13
Mark Horridge
3 Introducing Dynamics to TERM 37
Glyn Wittwer and George Verikios
Part II Water Modeling
4 Water Resources Modeling: A Review 59
Marnie Griffi th
5 The Theory of TERM-H2O 79
Peter B. Dixon, Maureen T. Rimmer and Glyn Wittwer
6 Buybacks to Restore the Southern
Murray-Darling Basin 99
Peter B. Dixon, Maureen T. Rimmer and Glyn Wittwer
7 The Economic Consequences of a Prolonged
Drought in the Southern Murray-Darling Basin 119
Glyn Wittwer and Marnie Griffi th
8 Urban Water Supply: A Case Study
of South-East Queensland 143
Glyn Wittwer
Contents
x
Contents
9 Applying TERM-H2O to Other Countries 163
Glyn Wittwer
About the Authors 179
Index 183
xi
Note : All authors are at the Centre of Policy Studies
Peter B. Dixon Centre of Policy Studies , Monash University , Melbourne , VIC ,
Australia
Marnie Griffi th Centre of Policy Studies , Monash University , Melbourne , VIC ,
Australia
Mark Horridge Centre of Policy Studies , Monash University , Melbourne , VIC ,
Australia
Maureen T. Rimmer Centre of Policy Studies , Monash University , Melbourne ,
VIC , Australia
George Verikios Centre of Policy Studies , Monash University , Melbourne , VIC ,
Australia
Glyn Wittwer Centre of Policy Studies , Monash University , Melbourne , VIC ,
Australia
Contributors
xiii
Fig. 2.1 The TERM fl ow database 18
Fig. 2.2 TERM production structure 22
Fig. 2.3 TERM sourcing mechanisms 23
Fig. 2.4 Statistical divisions in Australia 32
Fig. 2.5 Aggregating from master database
to policy simulation (watershed) regions 33
Fig. 2.6 Producing regional databases for MMRF and TERM 34
Fig. 3.1 Outline of preparation of dynamic TERM 44
Fig. 5.1 Production function for a farm industry 83
Fig. 5.2 Data generation procedure for TERM-H2O 93
Fig. 5.3 Regions available in TERM-H2O 95
Fig. 6.1 Price of irrigation water in SMDB ($ per megalitre) 102
Fig. 6.2 Buyback-induced percentage effects on real GDP:
TERM-H2O result and back-of-the-envelope calculation 103
Fig. 6.3 Demand for irrigation water in SMDB in 2018 104
Fig. 6.4 Map of SMDB regions used in the buyback simulation 106
Fig. 7.1 Map of SMDB regions in TERM-H2O 131
Fig. 7.2 Macroeconomic outcomes for SMDB
(% deviation from forecast) 132
Fig. 7.3 Downstream processing and farm capital, SMDB
(% deviation from forecast) (Used and available capital
in SMDB for the aggregate of meat products,
dairy products, wine and other beverages,
and fl our and processed cereals) 133
Fig. 7.4 Employment and industry contributions to GDP,
Lower Murrumbidgee (% change relative to forecast) 135
List of Figures
xiv
List of Figures
Fig. 7.5 Industry contributions to GDP, all SMDB
(% change relative to forecast) 135
Fig. 7.6 Price of water in buyback scenario:
droughts in 2015 and 2020 136
Fig. 7.7 MDB farm output: buyback scenario
($m output relative to forecast) 137
Fig. 8.1 Map of south-east Queensland 145
Fig. 8.2 Impact of the Traveston dam project
on south-east Queensland’s labour market 155
Fig. 8.3 Impact of project on south-east
Queensland’s GRP, capital and labour 155
Fig. 8.4 Impact on south-east Queensland’s
aggregate consumption and investment 156
Fig. 8.5 Contribution of trade to overall deviation
in south-east Queensland’s real GDP 157
xv
Table 1.1 Irrigation water use and price
in the Murray-Darling Basin 6
Table 2.1 Main sets of the TERM model 19
Table 5.1 Farm industries in region d
in the input-output data for TERM-H2O 81
Table 6.1 Buyback-induced percentage deviations
in farm outputs in SMDB regions in 2018 105
Table 6.2 Prices of permanent water rights ($ per ML, 2009 prices) 117
Table 7.1 Water consumption (GL) by crop in the
Murray-Darling basin, 2001–02 to 2005–06 122
Table 7.2 Impacts of drought by region, 2007–08
relative to no-drought baseline (%) 127
Table 7.3 Comparing modeled SMDB
outcomes to observed changes 130
Table 7.4 GDP defl ator, income and household
spending in Lower Murrumbidgee 133
Table 7.5 Data used in irrigation water price regression 138
Table 8.1 Population growth: south-east Queensland,
other mainland capitals and rest of Australia 144
Table 8.2 Major water supply projects in south-east Queensland 148
Table 9.1 Countries included in the UN survey on water accounts 170
List of Tables
Part I
The TERM Approach
13
G. Wittwer (ed.), Economic Modeling of Water: The Australian CGE Experience,
Global Issues in Water Policy 3, DOI 10.1007/978-94-007-2876-9_2,
© Springer Science+Business Media Dordrecht 2012
Abstract TERM (The Enormous Regional Model) provides a strategy for creating
a ‘bottom-up’ multi-regional CGE model which treats each region of a single
country as a separate economy. This makes it a useful tool for examining the regional
impacts of shocks that may be region specifi c. TERM is designed to allow quick
simulations with many regions, so allowing for models of large countries with
30–50 provinces, such as USA or China. TERM also offers a standard procedure for
preparing a database which requires, in addition to a national input-output or use-
supply table, a minimal amount of regional data. More regional data can be used if
available.
Keywords CGE modeling • Database development • Demand sourcing • Gravity
assumption • Input-output data • Sub-national data
2.1 Introduction
TERM is a framework for CGE (computable general equilibrium) modeling of
multiple regions within a single country. It was developed to address two common
problems of multi-regional CGE models:
As the number of regions increases, simulations become very slow, or require •
large amounts of memory.
It is diffi cult to develop a database for such models; published data are usually •
quite sparse.
Chapter 2
The TERM Model and Its Database*
Mark Horridge
M. Horridge (*)
Centre of Policy Studies , Monash University , Wellington Rd, Clayton campus ,
Clayton , VIC 3800 , Australia
e-mail:
*
Portions of this chapter draw on Horridge et al. (2005).
14
M. Horridge
TERM offers a solution to both problems:
The database and equation system are structured to allow fast solutions with •
small memory needs. An inbuilt automatic system to aggregate regions and/or
sectors allows model size to be reduced to speed simulations, while preserving
detail that is needed for a particular application.
There is a standard procedure for preparing a database which requires, in addi-•
tion to a national input-output or use-supply table, a minimal amount of regional
data. More regional data can be used if available.
From the outset, the TERM framework has been intended as a template which
might be quickly applied to a variety of countries. Thus, the standard version of
TERM is fairly simple, avoiding mechanisms which might be specifi c to a particular
country or application. Rather the emphasis is on allowing a basic multi-regional
model to produce simulation results as soon as possible. Very often, analysis of
results reveals shortcomings of the model or data, or suggests priorities for improve-
ment. To arrive quickly at this stage is key to the quality of the fi nal model.
TERM builds on the ORANI model (Dixon et al.
1982 ) , which distinguished
over 100 sectors, and introduced large-scale computable general equilibrium mod-
eling in 1977. In particular, the minimal data requirements for constructing a TERM
database scarcely exceed those for a ‘top-down’ multi-regional version of ORANI,
described below. In fact, the standard procedure for preparing a TERM assumes that
a working ‘top-down’ database has already been prepared and used for simulations.
This allows most potential problems with regional data to be noticed and fi xed at an
early stage.
2.2 Progress in Australian Regional Economic Modeling
Since ORANI, related models have developed in several new directions. ORANI’s
solution algorithm combined the effi ciency of linearised algebra with the accuracy
of multi-step solutions, allowing the development of ever more disaggregated and
elaborate models. The GEMPACK software developed by Ken Pearson ( 1988 ) and
colleagues since the mid-1980s simplifi ed the specifi cation of new models, while
cheaper, and more powerful computers allowed the development of computer-intensive
multi-regional and dynamic models.
On the demand side, these advances have been driven by the appetite of policy-
makers for sectoral, regional, temporal, and social detail in analyses of the effects of
policy or external shocks. Since parliamentary representatives are elected by regions,
demand for regional detail is particularly strong.
To meet this need, even early versions of ORANI (see Dixon et al.
1978 ) included
a ‘top-down’ regional module to work out the regional consequences of national
economic changes: national results for quantity (but not price) variables were
broken down by region using techniques borrowed from input-output analysis.
15
2 The TERM Model and Its Database
The name ‘top-down’ refl ects the feature that national results drive regional results
and are unaffected by the regional subsystem. Key assumptions are:
For each sector, the technology of production (i.e., cost shares) is uniform across •
regions.
For commodities that are heavily traded between regions (the ‘national’ com-•
modities), each region’s share of national output is fi xed or exogenous. So for
these sectors, the percent change in output is uniform across regions.
For the remaining, ‘local’, commodities (that are little traded between regions), •
output in each region adjusts to meet demand in that region.
Using the top-down technique, from 8 to 100 regions can easily be distinguished.
Region-specifi c demand shocks may be simulated, but since price variables have no
regional dimension, there is little scope for region-specifi c supply shocks.
1
On the
other hand, the ‘top-down’ approach requires little extra data or computer power.
A second generation of regional CGE models adapted ORANI by adding two
regional subscripts (source and destination) to many variables and equations. In this
‘bottom-up’ type of multi-regional CGE model, national results are driven by
(i.e., are additions of) regional results. Liew ( 1984 ) , Madden ( 1990 ) , and Peter
et al. ( 1996 ) describe several Australian examples. Dynamic versions of such models
have followed (Giesecke 1997 ) . The best-known example of this type of regional
model is the Monash Multi-Regional Forecasting model, MMRF (Adams et al. 2002 ) .
Bottom-up models allow simulations of policies that have region-specifi c price
effects, such as a payroll tax increase in one region only. They also allow us to
model imperfect factor mobility (between regions as well as sectors). Thus, increased
labour demand in one region may be both choked off by a local wage rise and
accommodated by migration from other regions. Unfortunately, models like MMRF
pose formidable data and computational problems—limiting the amount of sectoral
and regional detail. Only two to eight regions and up to 40 sectors could be distin-
guished.
2
Luckily, Australia has only eight states, but size limitations have hindered
the application of similar models to larger countries with 30–50 provinces and have
hitherto prevented us from distinguishing smaller, sub-state regions.
Finer regional divisions are desirable for several reasons. Policymakers who are
concerned about areas of high unemployment or about disparities between urban
and rural areas desire more detailed regional results. Environmental issues, such as
water management, often call for smaller regions that can map watershed or other
natural boundaries more closely. Finally, more and smaller regions give CGE models
a greater sense of geographical realism, closing the gap between CGE and LUTE
(Land Use Transportation Energy) modeling.
1
Such limitations could be partially circumvented: see Higgs et al. ( 1988 ) .
2
More precisely, these second-generation models (like MMRF) become rather large and slow to
solve as the product: (number of regions) × (number of sectors) exceeds 300. TERM raises this
limit to about 2,500.
16
M. Horridge
The TERM
3
model adds to the ORANI/MMRF tradition by allowing greater
disaggregation of regional economies than was previously available. For example,
it allows us to analyse effects for each of 57 statistical divisions within Australia—
which would be computationally infeasible using the MMRF framework.
2.3 The Structure of TERM
A key feature of TERM, in comparison to predecessors such as MMRF, is its ability to
handle a greater number of regions or sectors. The greater effi ciency arises from a
more compact data structure, made possible by a number of simplifying assumptions.
2.3.1 Defeating the Curse of Dimensionality
The database for a CGE model consists of matrices of fl ow values dimensioned by
commodity, industry, and region. The model will contain quantity and price vari-
ables for each of these fl ows, so the number of variables and equations tends to track
database size. The computer resources (time and memory) needed to solve the
model increase super-proportionately
4
as the size of the database increases. Indeed,
a doubling of database size may multiply solution time by three. Sectoral or regional
detail may have to be sacrifi ced to reduce computing problems.
To illustrate, the value of intermediate demands in a single-region CGE model
(like ORANI) might be represented by a matrix V , with dimensions COM*IND,
where, for example:
V (‘Coal’,‘Steel’) = value of Coal used by the Steel industry.
With 50 commodities and industries, V would contain 2,500 elements.
In the MMRF framework, V would be dimensioned COM*IND*REG*REG,
where the fi rst regional subscript denotes the region of origin of some input and the
second regional subscript denotes the region where the input is used. Since MMRF
distinguishes eight Australian states, the V matrix would be 64 times bigger than in
ORANI—leading to much larger (but just acceptable) solution times. A USA ver-
sion of MMRF, distinguishing 50 states, would imply a database which was 39
[=(50/8)
2
] times larger than the eight-state MMRF, leading to model solution times
3
TERM is an acronym for “The Enormous Regional Model.”
4
A key stage in the model solution process is the solution of an N * N linear equation system, where
N is the number of endogenous variables. Using conventional techniques, we can expect that the
time for this step will follow the cube of N . GEMPACK’s sparse matrix and automatic substitution
techniques reduce this penalty substantially; we assume below that solution time and space require-
ments follow N
1.5
.
17
2 The TERM Model and Its Database
and memory requirements perhaps 500 times those of the Australian MMRF—which
is quite impractical. TERM’s solution to this problem is to restructure the model
database so that no matrix contains more than three of the ‘large’ COM, IND, or
REG dimensions. For example, instead of the large four-dimensional intermediate
input matrix used by MMRF: V(COM, IND, REG, REG), we could instead use two
3-dimensional matrices:
V(COM, IND, REG) = value of commodities used by industries in region of
use, and
T(COM, REG, REG) = value of commodities used, by regions of production and use,
which together are 25 times smaller (with 50 sectors and regions), leading to
model solution times and memory requirements perhaps 125 times less. The cost is
a small loss in generality: the sourcing or trade matrix T encapsulates the assump-
tion that all users in a particular region of, say, vegetables, source their vegetables
from other regions according to common proportions.
2.3.2 The TERM Data Structure
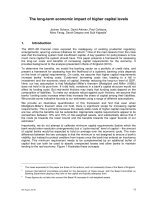
Figure 2.1 is a schematic representation of the model’s input-output database. It
reveals the basic structure of the model, which is key to its effi ciency. The rectangles
indicate matrices of fl ows. Core matrices (those stored on the database) are shown
in bold type; the other matrices may be calculated from the core matrices. The
dimensions of the matrices are indicated by indices (c, s, i, m, etc.) which correspond
to the sets of (Table 2.1 ); there, the sets DST, ORG, and PRD are in fact the same set,
named according to the context of use.
The matrices in Fig. 2.1 show the value of fl ows valued according to three
methods:
1. Basic values = Output prices (for domestically produced goods), or CIF prices
(for imports).
2. Delivered values = Basic + Margins.
3. Purchasers’ values = Basic + Margins + Tax = Delivered + Tax.
The matrices on the left-hand side of the diagram resemble (for each region) a
conventional single-region input-output database. For example, the matrix USE at
top left shows the delivered value of demand for each good (c in COM) whether
domestic or imported (s in SRC) in each destination region (DST) for each user
(USER, comprising the industries; IND; and four fi nal demanders: households,
investment, government, and exports). Some typical elements of USE might show:
USE(‘Wool’, ‘dom’, ‘Textiles’, ‘North’): domestically produced wool used by •
the textile industry in North.
USE(‘Food’, ‘imp’, ‘HOU’, ‘West’): imported food used by households in West. •
18
M. Horridge
Fig. 2.1 The TERM fl ow database
19
2 The TERM Model and Its Database
USE(‘Meat’, ‘dom’, ‘EXP’, ‘North’): domestically produced meat exported from •
a port in North. Some of this meat may have been produced in another region.
USE(‘Meat’, ‘imp’, ‘EXP’, ‘North’): imported meat re-exported from a port in •
North.
As the last example shows, the data structure allows for re-exports (at least in
principle). All these USE values are ‘delivered’: they include the value of any trade
or transport margins used to bring goods to the user. Notice also that the USE matrix
contains no information about regional sourcing of goods.
The TAX matrix of commodity tax revenues contains an element corresponding
to each element of USE. Together with matrices of primary factor costs and produc-
tion taxes, these add to the costs of production (or value of output) of each regional
industry.
In principle, each industry is capable of producing any good. The MAKE matrix
at the bottom of Fig. 2.1 shows the value of output of each commodity by each
industry in each region. A subtotal of MAKE, MAKE_I, shows the total production
of each good (c in COM) in each region d.
TERM recognises inventory changes in a limited way. First, changes in stocks of
imports are ignored. For domestic output, stock changes are regarded as one desti-
nation for industry output (i.e., they are dimension IND rather than COM). The rest
of production goes to the MAKE matrix.
The right-hand side of Fig. 2.1 shows the regional sourcing mechanism. The key
matrix is TRADE, which shows the value of inter-regional trade by sources (r in
ORG) and destinations (d in DST) for each good (c in COM) whether domestic or
imported (s in SRC). The diagonal of this matrix ( r = d ) shows the value of local
usage which is sourced locally. For foreign goods ( s = ‘imp’), the regional source
subscript r (in ORG) denotes the port of entry. The matrix IMPORT, showing total
entry of imports at each port, is simply an add up (over d in DST) of the imported
part of TRADE.
The TRADMAR matrix shows, for each cell of the TRADE matrix, the value of
margin good m (m in MAR) which is required to facilitate that fl ow. Adding together the
TRADE and TRADMAR matrix gives DELIVRD, the delivered (basic + margins)
Table 2.1 Main sets of the TERM model
Index Set name Description Typical size
s SRC (dom,imp) Domestic or imported (ROW) sources 2
c COM Commodities 40
m MAR Margin commodities (trade, road, rail, boat) 4
i IND Industries 40
o OCC Skills 8
d DST Regions of use (destination) 30
r ORG Regions of origin 30
p PRD Regions of margin production 30
f FINDEM Final demanders (HOU, INV, GOV, EXP) 4
u USER Users = IND union FINDEM 44
20
M. Horridge
value of all fl ows of goods within and between regions. Note that TRADMAR
makes no assumption about where a margin fl ow is produced (the r subscript refers
to the source of the underlying basic fl ow).
Matrix SUPPMAR shows where margins are produced (p in PRD). It lacks the
good-specifi c subscripts c (COM) and s (SRC), indicating that, for all usage of margin
good m used to transport any goods from region r to region d, the same proportion
of m is produced in region p. Summation of SUPPMAR over the p (in PRD) sub-
script yields the matrix SUPPMAR_P which should be identical to the subtotal
of TRADMAR (over c in COM and S in SRC), TRADMAR_CS. In the model,
TRADMAR_CS is a CES aggregation of SUPPMAR: margins (for a given good
and route) are sourced according to the price of that margin in the various regions
(p in PRD).
TERM assumes that all users of a given good (c,s) in a given region (d) have the
same sourcing (r) mix. In effect, for each good (c,s) and region of use (d), there is a
broker who decides for all users in d whence supplies will be obtained. Armington
sourcing is assumed: the matrix DELIVRD_R is a CES composite (over r in ORG)
of the DELIVRD matrix.
A balancing requirement of the TERM database is that the sum over user of USE,
USE_U, shall be equal to the sum over regional sources of the DELIVRD matrix,
DELIVRD_R.
It remains to reconcile demand and supply for domestically produced goods. In
Fig.
2.1 , the connection is made by arrows linking the MAKE_I matrix with the
TRADE and SUPPMAR matrices. For non-margin goods, the domestic part of
the TRADE matrix must sum (over d in DST) to the corresponding element in the
MAKE_I matrix of commodity supplies. For margin goods, we must take into account
both the margin requirement SUPPMAR_RD and direct demands TRADE_D.
At the moment, TERM distinguishes only four fi nal demanders in each region:
(a) HOU: the representative household
(b) INV: capital formation
(c) GOV: government demand
(d) EXP: export demand
For many purposes, it is useful to break down investment according to destination
industry. The satellite matrix INVEST (subscripted c in COM, i in IND, and d in
DST) serves this purpose. It allows us to distinguish the commodity composition of
investment according to industry: for example, we would expect investment in agri-
culture to use more machinery (and less construction) than investment in dwellings.
Similarly, another satellite matrix, HOUPUR, allows us to distinguish several
household types with different budget shares. Both satellite matrices enforce the
assumption that import/domestic shares and commodity tax rates are uniform across
household (or investor) types: For example, we assume that the tax rate on cigarettes
is the same for rich and poor, as is the share of imports in cigarette consumption.
Missing from Fig.
2.1 is an account of how factor incomes and tax revenue accrue
to regional households and governments. Such data would be needed to convert the
TERM data scheme into a complete SAM. Australian versions of TERM typically