designing data visualizations
Bạn đang xem bản rút gọn của tài liệu. Xem và tải ngay bản đầy đủ của tài liệu tại đây (18.83 MB, 110 trang )
Designing Data Visualizations
Noah Iliinsky and Julie Steele
Beijing
•
Cambridge
•
Farnham
•
Köln
•
Sebastopol
•
Tokyo
Designing Data Visualizations
by Noah Iliinsky and Julie Steele
Copyright © 2011 Julie Steele and Noah Iliinsky. All rights reserved.
Printed in the United States of America.
Published by O’Reilly Media, Inc., 1005 Gravenstein Highway North, Sebastopol, CA 95472.
O’Reilly books may be purchased for educational, business, or sales promotional use. Online editions
are also available for most titles (). For more information, contact our
corporate/institutional sales department: (800) 998-9938 or
Editor: Julie Steele
Production Editor: Teresa Elsey
Cover Designer: Karen Montgomery
Interior Designer: David Futato
Illustrator: Robert Romano
Nutshell Handbook, the Nutshell Handbook logo, and the O’Reilly logo are registered trademarks of
O’Reilly Media, Inc. Designing Data Visualizations, the image of a gang-gang cockatoo, and related trade
dress are trademarks of O’Reilly Media, Inc.
Many of the designations used by manufacturers and sellers to distinguish their products are claimed as
trademarks. Where those designations appear in this book, and O’Reilly Media, Inc., was aware of a
trademark claim, the designations have been printed in caps or initial caps.
While every precaution has been taken in the preparation of this book, the publisher and authors assume
no responsibility for errors or omissions, or for damages resulting from the use of the information con-
tained herein.
ISBN: 978-1-449-31228-2
[LSI]
1316096679
Table of Contents
Preface . . . . . . . . . . . . . . . . . . . . . . . . . . . . . . . . . . . . . . . . . . . . . . . . . . . . . . . . . . . . . . . . . . . . . vii
Part I. What Will You Design?
1. Classifications of Visualizations . . . . . . . . . . . . . . . . . . . . . . . . . . . . . . . . . . . . . . . . . . . . 3
Complexity 3
Infographics versus Data Visualization 4
Infographics 5
Data Visualization 7
Exploration versus Explanation 7
Exploration 7
Explanation 8
Hybrids: Exploratory Explanation 8
Informative versus Persuasive versus Visual Art 8
The Designer-Reader-Data Trinity 9
Informative 9
Persuasive 10
Visual Art 10
2. Source Trinity: Ingredients of Successful Visualizations . . . . . . . . . . . . . . . . . . . . . . . 13
Designer 13
Why Are You Here? 13
Reader 14
You Are Creating This for Other People 14
They Are Not You 15
Contextual Considerations for the Reader 15
Context of Use 16
Data 16
iii
Part II. How Should You Design It?
3. Determine Your Goals and Supporting Data . . . . . . . . . . . . . . . . . . . . . . . . . . . . . . . . 21
Knowledge Before Structure 21
Avoiding TMI 23
4. Choose Appropriate Visual Encodings . . . . . . . . . . . . . . . . . . . . . . . . . . . . . . . . . . . . . 25
Choosing Appropriate Visual Encodings 25
Natural Ordering 25
Distinct Values 28
Redundant Encoding 29
Defaults versus Innovative Formats 30
Readers’ Context 31
Compatibility with Reality 34
Patterns and Consistency 37
Selecting Structure 38
Comparisons Need to Compare 40
Some Structures Are Just Inherently Bad 40
Some Good Structures Are Often Abused 42
Keep It Simple (or You Might Look) Stupid 44
5. First, Place . . . . . . . . . . . . . . . . . . . . . . . . . . . . . . . . . . . . . . . . . . . . . . . . . . . . . . . . . . . . 47
Position: Layout and Axes 47
Position Is Your Most Powerful Encoding 48
The Meaning of Placement and Proximity 49
Semantic Distance and Relative Proximity 49
Absolute Placement 50
Representation of Physical Space 50
Logical Relationships versus Physical Relationships 51
Patterns and Grouped Objects 52
Patterns of Organization (and More!) 52
Specific Graphs, Layouts, and Axis Styles 53
Appropriate Use of Circles and Circular Layouts 58
6. Apply Your Encodings Well . . . . . . . . . . . . . . . . . . . . . . . . . . . . . . . . . . . . . . . . . . . . . . 65
Color 65
Leverage Common Color Associations 66
Cognitive Interference and the Stroop Test 67
Color Theory 68
Size 71
Conveying Size 71
Comparing Sizes 72
iv | Table of Contents
Text and Typography 74
Use Text Sparingly 74
Fonts and Hierarchies 74
Beware of All Caps 75
Avoid Drop Shadows 76
Shape 76
Cultural Connotations 76
Icons 76
Illusions 77
Lines 78
When Not to Use Lines 79
Keys versus Direct Labeling of Data Points 79
Pitfalls to Avoid 80
3D 81
Pies 82
Gradients 82
Drop Shadows 83
Any Excel Defaults 83
Conclusion 83
A.
Additional Resources . . . . . . . . . . . . . . . . . . . . . . . . . . . . . . . . . . . . . . . . . . . . . . . . . . . 85
B. Checklist . . . . . . . . . . . . . . . . . . . . . . . . . . . . . . . . . . . . . . . . . . . . . . . . . . . . . . . . . . . . . 91
Table of Contents | v
Preface
The path from journeyman to master is long. In the case of data visualization, the path
has been well marked by many accomplished designers and cognitive scientists who
have been doing great work for decades. We gladly follow in their footsteps, and we
hope you will, too.
In these pages, however, our goal is not so much to take you to the summit as to start
you down the path—and that the path is quite rewarding to travel. Our goal is to give
you confidence as you begin your journey.
Many statisticians and practitioners with excellent coding and data munging skills are
nevertheless stuck in a rut of common formats and default settings, which lead to
mundane, suboptimal visualizations. But the domain of hand-crafted, fine-tuned, note-
worthy visualizations is not limited to “creative” types; it is accessible with a bit of
guidance.
The truth is, there is plenty of room for artistry and creativity in data visualization. But
success is built upon a linear process that encodes information for visual transmission
and subsequent decoding by wetware—the reader’s brain. One aim in writing this book
is to introduce you to this process, including some basic concepts and best practices,
so that your message may be transmitted with minimal interference.
It is a process. And design is something you’re probably already doing, whether you’re
designing applications, frameworks, graphics, or something else. Design is simply a
process of organized thinking, planning, and executing. You are making design choices,
intentional or not. Of course, intentional choices have a better chance of being useful
than arbitrary or accidental choices.
*
This book is a road map to those choices: it is
meant to make you aware of the choices you get to make, and to help you make useful,
intentional design decisions at every turn.
This high-level road map is one we haven’t seen presented anywhere else. It will give
you the general lay of the land. It is a set of steps and rules to follow that will get you
80% of the way to turning out great work. We’ll introduce many questions you’ll need
to ask yourself, and point you in the direction of some answers. The nuanced details
* Suh: The Principles of Design (Oxford University Press); Schon: The Reflective Practitioner (Basic Books).
vii
of those answers have already been addressed by others, and we hope you will continue
down the path with further guidance from our colleagues and mentors (see the Reading
List in Appendix A).
Note that Appendix A also covers some of the many tools available for creating data
visualizations, and we hope you will peruse them. But you’ll find a discussion of tools
intentionally missing from the rest of the book, because the topic at hand is, “What
problem are you solving?” (and the questions you’re answering), rather than, “What
tools are you using?” Design and implementation are two separate things.
As in any creative discipline, the best data visualizations are forged by breaking some
of the rules. But rules must be broken with intention. One must learn the rules (well,
more like guidelines) before one is entitled to break them. With that in mind, we present
for your consideration our process for the visual encoding of information.
How This Book Is Organized
This book is organized into two major parts, which can loosely be thought of as practical
theoretical foundations and applied suggestions, respectively.
In Part I, we discuss different kinds of visualization (including infographics and visual
art) and explore the influences at work in each one. The goal is to help you become a
more savvy consumer of visualizations, as well as a more organized thinker when cre-
ating your own visual work.
In Chapter 1, we introduce some ways of classifying and describing different styles of
visualization, so that you can begin to think about and describe what you’re designing.
In Chapter 2, we introduce the three fundamental influences to the visualization prod-
uct—the designer, the reader, and the data—and describe how each should shape what
is eventually created.
In Part II, we apply these concepts to the design process. The goal is to help you think
in a linear way about how to select and apply appropriate encodings for your data.
In Chapter 3, we focus on getting to a clear understanding of your goals—and defining
the requisite supporting data—so that you can implement them most effectively.
In Chapter 4, we lay out heuristics for understanding the shape of your data and choos-
ing compatible visual properties and structures with which to encode it.
In Chapter 5, we dive deep into the property of spatial position—axes and placement—
one of the most important properties you’ll need to select. We also discuss using dif-
ferent visualization structures.
In Chapter 6, we look at best practices and offer specific suggestions for encoding many
specific different data types with visual properties. We also present warnings against
common pitfalls and dark patterns.
viii | Preface
Finally, the Appendices are full of resources and references meant to help you put your
skills into practice and expand your knowledge beyond this volume.
Appendix A contains a list of tools to help you get started, as well as a suggested reading
list to expand your knowledge and understanding of design concepts.
Appendix B is a list of the questions and decisions you’ll confront as part of the design
process. We hope you’ll read the entire book, and then use this section as a refresher
whenever you design a new visualization.
What We Mean When We Say…
In this book, we’ll use some specific terms to describe your data and visual encodings.
Here is a handy glossary for quick reference.
Chart: Something that shows qualitative information (e.g., flow charts).
Data dimensions: One single channel of data. A stock graph may comprise four
properties: date, price, company, and market cap. Each is a unique dimension of
the data, which can be encoded separately, with a different visual property.
Data visualization: Visualizations that are algorithmically generated and can be
easily regenerated with different data, are usually data-rich, and are often aesthet-
ically shallow.
Designer: The creator of a visualization; any reader of this book.
Encoding: The visual property (noun) applied to a dimension of data that enco-
des (verb) the information into a visual medium for decoding by the reader’s brain.
Explanatory visualization: Data visualizations that are used to transmit infor-
mation or a point of view from the designer to the reader. Explanatory visualiza-
tions typically have a specific “story” or information that they are intended to
transmit.
Exploratory visualization: Data visualizations that are used by the designer for
self-informative purposes to discover patterns, trends, or sub-problems in a data-
set. Exploratory visualizations typically don’t have an already-known story.
Graph: Something that shows quantitative information (e.g., pie graphs and bar
graphs).
Infographic: Visualizations that are manually generated around specific data,
tend to be data-shallow, and are often aesthetically rich.
Reader: The consumer of a visualization, often someone other than the designer.
The reader has information needs that are meant to be satisfied by the visualization.
Visual property: A characteristic that you can see. Color, size, location, thickness,
and line weight are all visual properties.
Variability of a property or data dimension: Within a visual property or single
data dimension, what values are present or allowed, and how they change. Integers
vary discretely; position can vary continuously. Categories are finite (and discrete,
though maybe hierarchical); numbers are infinite.
Preface | ix
Figures Used by Permission
The following figures are reprinted by kind permission:
Figure 1-3. Flint Hahn (2010). Copyright © 2010, Flint Hahn. Permission to reproduce
the likeness of Burning Man and the mark “Burning Man” granted by Burning Man.
Figure 1-5. Nora Ligorano and Marshall Reese (2011). Copyright © 2011, Ligorano/
Reese. />Figure 4-1. European Soil Bureau. Copyright © 1995–2011, European Union. Used
with stated authorization to reproduce, with acknowledgment.
ropa.eu/
Figure 4-2. Center for International Earth Science Information Network (CIESIN)
(2007). Copyright © 2007, The Trustees of Columbia University in the City of New
York. Columbia University. Population, Landscape, and Climate Estimates (PLACE).
Used under the Creative Commons Attribution License. umbia
.edu/place/
Figure 4-5. Tableau Software Public Gallery. Copyright © 2003–2011 Tableau Soft-
ware. />Figure 4-6. Christian Caron (2011). Copyright © 2011, Christian Caron.
Figure 4-10. Michael Dayah (1997). Copyright © 1997 Michael Dayah. http://www
.ptable.com
Figure 4-15. Robert Palmer (2010). Copyright © 2010, Robert Palmer. http://rp-network
.com/
Figure 5-1 and Figure 5-2. Photo credits to: Annette Crimmins, Sias van Schalkwyk,
Janni Due, Dimitri Castrique, and Grethe Boe.
Figure 5-6. Nelson Minar (2011). Copyright © 2011 Daedalus Bits, LLC. http://wind
history.com/
Figure 5-7. Craig Robinson (2011). Copyright © 2011, Craig Robinson. http://www
.flipflopflyin.com/flipflopflyball/info-majorleagueparks.html
Figure 5-8. Tableau Software Public Gallery. Copyright © 2003–2011 Tableau Soft-
ware. />Figure 6-3. Spective® Colour System is the evolved color selection method created by
Tony Scauzillo-Golden in 2010 while improving upon existing design industry standard
color UIs. Please visit TSG’s Spective Productions website for further details. Spective®
is registered under United States Patent Reg. No. 3,896,334.
Figure 6-11. Jess Bachman (2011). Copyright © 2011, Jess Bachman. r
ter.org/research/apples-to-oranges/
x | Preface
See the Color Figures Online
The images in this book were designed to be viewed in color and at full size. If you’re
reading the print edition or on a mobile device, please download the color figures from
the website for this book to see them in their full glory.
Attributions and Permissions
This book is here to help you get your job done. If you reference limited parts of it in
your work or writings, we appreciate, but do not require, attribution. An attribution
usually includes the title, author, publisher, and ISBN. For example: “Designing Data
Visualizations by Noah Iliinsky and Julie Steele (O’Reilly). Copyright 2011 Julie Steele
and Noah Iliinsky, 978-1-449-31228-2.”
If you feel your use of examples or quotations from this book falls outside fair use or
the permission given above, feel free to contact us at
Safari® Books Online
Safari Books Online is an on-demand digital library that lets you easily
search over 7,500 technology and creative reference books and videos to
find the answers you need quickly.
With a subscription, you can read any page and watch any video from our library online.
Read books on your cell phone and mobile devices. Access new titles before they are
available for print, and get exclusive access to manuscripts in development and post
feedback for the authors. Copy and paste code samples, organize your favorites, down-
load chapters, bookmark key sections, create notes, print out pages, and benefit from
tons of other time-saving features.
O’Reilly Media has uploaded this book to the Safari Books Online service. To have full
digital access to this book and others on similar topics from O’Reilly and other pub-
lishers, sign up for free at .
How to Contact Us
Please address comments and questions concerning this book to the publisher:
O’Reilly Media, Inc.
1005 Gravenstein Highway North
Sebastopol, CA 95472
800-998-9938 (in the United States or Canada)
707-829-0515 (international or local)
707-829-0104 (fax)
Preface | xi
We have a web page for this book, where we list errata, examples, and any additional
information. You can access this page at:
/>To comment or ask technical questions about this book, send email to:
For more information about our books, courses, conferences, and news, see our website
at .
Find us on Facebook: />Follow us on Twitter: />Watch us on YouTube: />Acknowledgments
We wish to thank all the amazing visual thinkers and designers who came before us,
who work with us, who inspire us. Many of them are cited in the Reading List in
Appendix A, and many others have kindly given us permission to reprint their work
here. We also wish to thank the good folks at O’Reilly who helped this project come
to life.
In particular, Noah would like to thank professor David Farkas, as one of the many
origins of this book can be traced to Dave’s suggestion to “take a quarter and look at
some diagrams, and see what happens,” many years ago.
Finally, big thanks and hugs to our friends, and especially our family members, who
have loved, supported, fed, and encouraged us over the hectic writing period. Martin,
Miller, Amy, Juliebot WCE, Nathan, Noël, Tanya, Edd, and Anna: thanks for keeping
us going and for cheering us on.
xii | Preface
PART I
What Will You Design?
Since you are interested in learning more about designing data visualizations (by virtue
of the fact that you’re reading this book), then chances are good that you have been
the reader of other people’s data visualizations. You may already understand—intui-
tively or consciously—some of the visual techniques that work well, and some that
don’t. You may also be aware of some of the different categories of visualization.
The first part of this book aims to help you build your understanding of these categories
and techniques. We will explain how to recognize and think about them, so that you
will be better prepared to discuss, plan, and consume all kinds of data visualizations.
Why Visualization?
Before we dive into the categories, however, it may be useful to pause for a moment
and be explicit about why visualization is a useful medium for examining, understand-
ing, and transmitting information.
• Visualization leverages the incredible capabilities and bandwidth of the visual sys-
tem to move a huge amount of information into the brain very quickly.
• Visualization takes advantage of our brains’ built-in “software” to identify patterns
and communicate relationships and meaning.
• Visualization can inspire new questions and further exploration.
• Visualization helps identify sub-problems.
• Visualization is really good for identifying trends and outliers, discovering or
searching for interesting or specific data points in a larger field, etc.
The key function of data visualization is to move information from point A to point B.
In exploratory visualization, point A is the dataset and point B is the designer’s own
mind. In explanatory visualization, point A is the mind of the designer, and point B is
the mind of the reader. (More about these categories in Chapter 1.) In order to cross
the gulf between points A and B and be successfully communicated, the information
must be encoded for transmission. In this case, visual elements are the chosen trans-
mission medium.
For this reason, the designer’s purpose in designing a data visualization is to create a
deliverable that will be well received and easily understood by the reader. All design
choices and particular implementations must serve this purpose.
CHAPTER 1
Classifications of Visualizations
There are several ways to categorize and think about different kinds of visualizations.
Here are four of the most useful. The first two are unrelated to the others; the last two
are related to each other.
Complexity
One way to classify a data visualization is by counting how many different data dimen-
sions it represents. By this we mean the number of discrete types of information that
are visually encoded in a diagram. For example, a simple line graph may show the
price of a company’s stock on different days: that’s two data dimensions. If multiple
companies are shown (and therefore compared), there are now three dimensions; if
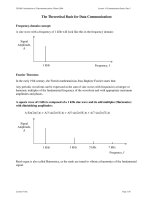
trading volume per day is added to the graph, there are four (Figure 1-1).
This count of the number of data dimensions can be described as the level of complex-
ity of the visualization. As visualizations become more complex, they are more chal-
lenging to design well, and can be more difficult to learn from. For that reason, visu-
alizations with no more than three or four dimensions of data are the most common—
though visualizations with six, seven, or more dimensions can be found.
Adding more volume or data points of the same data dimension doesn’t
increase complexity. Showing 100 years of stock data for one stock isn’t
more complex than one week of data, it’s just more voluminous. Show-
ing 50 companies instead of two might make the display more crowded
or complicated, but fundamentally it’s just more data points in the
company dimension, and therefore isn’t making the graph more
complex.
There are two main challenges to designing more complex visualizations. The first is
that the more dimensions you need to encode visually, the more individual visual
properties you need to use. Selecting properties is easy to do for the first few dimensions
when most visual properties haven’t been used. However, as more dimensions are
3
added, finding appropriate, unused visual properties becomes more difficult. (Bear in
mind that a visualization shows not just types of information but also the relation-
ships between and among those information types.) As this difficulty in design increa-
ses, intentionality in the decision-making process becomes ever more necessary.
The way to succeed in the face of this challenge is to be intentional about which property
to use for each dimension, and iterate or change encodings as the design evolves. This
is the subject of Part II.
The second challenge for designing more complex visualizations is that there are rela-
tively few well-known conventions, metaphors, defaults, and best practices to rely on.
Because the safety net of convention may not exist, there is more of a burden on the
designer to make good choices that can be easily understood by the reader.
Infographics versus Data Visualization
You may have heard the terms infographics and data visualization used in different
ways, or interchangeably in different contexts, or even casually by the same person in
a single sentence. You may also have heard these terms used politically—that is, with
positive or negative connotations attached. Some people use infographic to refer to
representations of information perceived as casual, funny, or frivolous, and visualiza-
tion to refer to designs perceived to be more serious, rigorous, or academic.
Figure 1-1. Four data dimensions are shown in this graph. Adding more points within any of these
dimensions won’t change the graph’s complexity.
4 | Chapter 1: Classifications of Visualizations
The truth is, even though the art of representing statistical information visually is hun-
dreds of years old, the vocabulary of the field is still evolving and settling. Among the
general public, there is still confusion over what these two terms mean, but within the
information design community, definitions for these terms are solidifying.
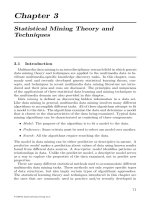
In short: The distinction between infographics and data visualizations (or information
visualizations) is based on both form and origin (see Figure 1-2).
Figure 1-2. The difference between infographics and data visualization may be loosely determined by
the method of generation, the quantity of data represented, and the degree of aesthetic treatment
applied.
Infographics
We suggest that the term infographics is useful for referring to any visual representation
of data that is:
• manually drawn (and therefore a custom treatment of the information);
• specific to the data at hand (and therefore nontrivial to recreate with different data);
• aesthetically rich (strong visual content meant to draw the eye and hold interest);
and
Infographics versus Data Visualization | 5
• relatively data-poor (because each piece of information must be manually
encoded).
Put another way, infographics are illustrations where the data representation is man-
ually laid out or sketched, probably with drawing software such as Adobe Illustrator.
Because of their manually-drawn process of creation, infographics have the option of
being aesthetically rich (see Figure 1-3
*
). Another consequence of their manual origins
is they tend to be limited in the amount of data they can convey, simply due to the
practical limitations of manipulating many data points. Similarly, it is difficult to change
or update the data in an infographic, as any changes must be implemented manually.
Figure 1-3. Flint Hahn’s Burning Man infographic is a great example of an aesthetically rich,
manually-drawn piece.
This is not a complete, universal, or absolute definition, but may be a helpful way to
think about and identify the category.
* Flint Hahn (2010). Copyright © 2010, Flint Hahn. Permission to reproduce the likeness of Burning Man and
the mark “Burning Man” granted by Burning Man.
6 | Chapter 1: Classifications of Visualizations
Data Visualization
By contrast, we suggest that the terms data visualization and information visualiza-
tion (casually, data viz and info viz) are useful for referring to any visual representation
of data that is:
• algorithmically drawn (may have custom touches but is largely rendered with the
help of computerized methods);
• easy to regenerate with different data (the same form may be repurposed to rep-
resent different datasets with similar dimensions or characteristics);
• often aesthetically barren (data is not decorated); and
• relatively data-rich (large volumes of data are welcome and viable, in contrast to
infographics).
Data visualizations are initially designed by a human, but are then drawn algorithmi-
cally with graphing, charting, or diagramming software. The advantage of this approach
is that it is relatively simple to update or regenerate the visualization with more or new
data. While they may show great volumes of data, information visualizations are often
less aesthetically rich than infographics.
As you will have inferred from the title of this book, it is this latter cat-
egory of data visualizations with which we are primarily concerned here.
However, the principles we present are relevant to the design of both
infographics and data visualizations.
Exploration versus Explanation
Generally speaking, there are two categories of data visualization: exploration and
explanation. The two serve different purposes, and so there are tools and approaches
that may be appropriate only for one and not the other. For this reason, it is important
to understand the distinction, so that you can be sure you are using tools and ap-
proaches appropriate to the task at hand.
Exploration
Exploratory data visualizations are appropriate when you have a whole bunch of data
and you’re not sure what’s in it. When you need to get a sense of what’s inside your
data set, translating it into a visual medium can help you quickly identify its features,
including interesting curves, lines, trends, or anomalous outliers.
Exploration is generally best done at a high level of granularity. There may be a whole
lot of noise in your data, but if you oversimplify or strip out too much information, you
could end up missing something important. This type of visualization is typically part
of the data analysis phase, and is used to find the story the data has to tell you.
Exploration versus Explanation | 7
Explanation
By contrast, explanatory data visualization is appropriate when you already know what
the data has to say, and you are trying to tell that story to somebody else. It could be the
head of your department, a grant committee, or the general public.
Whoever your audience is, the story you are trying to tell (or the answer you are trying
to share) is known to you at the outset, and therefore you can design to specifically
accommodate and highlight that story. In other words, you’ll need to make certain
editorial decisions about which information stays in, and which is distracting or irrele-
vant and should come out. This is a process of selecting focused data that will support
the story you are trying to tell.
If exploratory data visualization is part of the data analysis phase, then explanatory
data visualization is part of the presentation phase. Such a visualization may stand on
its own, or may be part of a larger presentation, such as a speech, a newspaper article,
or a report. In these scenarios, there is some supporting narrative—written or verbal—
that further explains things.
Hybrids: Exploratory Explanation
It’s worth noting that there is also a kind of hybrid category, which involves a curated
dataset that is nonetheless presented with the intention to allow some exploration on
the reader’s part. These visualizations are usually interactive via some kind of graphical
interface that lets the reader choose and constrain certain parameters, thereby discov-
ering for herself whatever insights the dataset may have to offer. These might even be
insights the creator of the visualization hasn’t come across yet.
So in these hybrid designs there is a certain freedom-of-discovery aspect to the infor-
mation presented, but it is usually not totally raw; it has been distilled and facilitated
to some extent. See for an example.
Informative versus Persuasive versus Visual Art
We posit that there are three main categories of explanatory visualizations based on
the relationships between the three necessary players: the designer, the reader, and the
data.
This section refers to explanatory (or hybrid) visualizations exclusively, because it dis-
cusses designing visualizations of data with known parameters and stories. If you don’t
yet know the message you intend to convey, then you’re still in an exploration phase,
and probably aren’t designing for the same styles of consumption as this section
describes.
8 | Chapter 1: Classifications of Visualizations
The Designer-Reader-Data Trinity
It is useful to think of an effective explanatory data visualization as being supported by
a three-legged stool consisting of the designer, the reader, and the data. Each of these
“legs” exerts a force, or contributes a separate perspective, that must be taken into
consideration for a visualization to be stable and successful. Chapter 2 will address the
considerations of each of the three in much more detail, but we find it helpful to in-
troduce the concept here.
Each of the three legs of the stool has a unique relationship to the other two. While it
is necessary to account for the needs and perspective of all three in each visualization
project, the dominant relationship will ultimately determine which category of visual-
ization is needed (see Figure 1-4).
Figure 1-4. The nature of the visualization depends on which relationship (between two of the three
components) is dominant.
Informative
An informative visualization primarily serves the relationship between the reader and
the data. It aims for a neutral presentation of the facts in such a way that will educate
the reader (though not necessarily persuade him). Informative visualizations are often
associated with broad data sets, and seek to distill the content into a manageably con-
sumable form. Ideally, they form the bulk of visualizations that the average person
encounters on a day-to-day basis—whether that’s at work, in the newspaper, or on a
service-provider’s website. The Burning Man Infographic (Figure 1-2) is an example of
informative visualization.
Informative versus Persuasive versus Visual Art | 9
Persuasive
A persuasive visualization primarily serves the relationship between the designer and the
reader. It is useful when the designer wishes to change the reader’s mind about some-
thing. It represents a very specific point of view, and advocates a change of opinion or
action on the part of the reader. In this category of visualization, the data represented
is specifically chosen for the purpose of supporting the designer’s point of view, and is
presented carefully so as to convince the reader of same. See also: propaganda.
While an informative visualization may not have an intentional point of
view in the manner that a persuasive visualization does, all visualizations
are going to be biased to some degree, based on the fact that designers
are human and have to make choices.
A good example of persuasive visualization is the Joint Economic Committee minority’s
rendition of the proposed Democratic health care plan in 2010, shown in Figure 4-14.
Visual Art
The third category, visual art, primarily serves the relationship between the designer and
the data. Visual art is unlike the previous two categories in that it often entails unidir-
ectional encoding of information, meaning that the reader may not be able to decode
the visual presentation to understand the underlying information.
Whereas both informative and persuasive visualizations are meant to be easily decod-
able—bidirectional in their encoding—visual art merely translates the data into a visual
form. The designer may intend only to condense it, translate it into a new medium, or
make it beautiful; she may not intend for the reader to be able to extract anything from
it other than enjoyment.
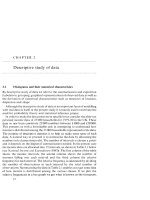
This category of visualization is sometimes more easily recognized than others. For
example, Nora Ligorano and Marshall Reese designed a project that converts Twitter
streams into a woven fiber-optic tapestry (Figure 1-5
†
; />tic-tapestry). A project like this is abstract enough that most people intuitively recognize
it as art: something to be appreciated rather than explicitly decoded.
But a project like the Planetary app from Bloom Studios ( is
less easily categorized. Ostensibly, one may decode the information represented visu-
ally by noting the number of stars (representing artists), planets (representing albums),
and moons (representing tracks) in a constellation or galaxy on the screen. But prop-
erties such as track length, encoded as the speed at which the each moon orbits its
album-planet, are encoded too subtly for the average user to decode—at which point,
† Nora Ligorano and Marshall Reese (2011). Copyright © 2011, Ligorano/Reese. />-optic-tapestry
10 | Chapter 1: Classifications of Visualizations
it just becomes something pretty to look at. A worthy pursuit in its own right, perhaps,
but better clearly labeled as visual art, and not confused with informative visualization.
Figure 1-5. Participants address the Fiber Optic Tapestry by tweeting #optictapestry and a primary
color—the tapestry displays the colors in algorithmically-determined patterns.
Informative versus Persuasive versus Visual Art | 11