1641 assignment 2 (pass)
Bạn đang xem bản rút gọn của tài liệu. Xem và tải ngay bản đầy đủ của tài liệu tại đây (1.48 MB, 35 trang )
Higher Nationals in
Computing
Unit 06: Business Intelligence
ASSIGNMENT 2
Assessor name: NGUYEN XUAN SAM
Learner’s name: Đào Vĩnh Khang
ID: GCS200222
Class: GCS0905B
Subject code: 1641
Assignment due: 3 1/ 0 1 / 2023
Assignment submitted: 3 1/ 0 1 /2023
Assessment Brief
Student Name/ID
Number
Unit Number and Title
14: Business Intelligence
Academic Year
2023
Unit Tutor
Assignment Title
Assignment 2: Apply BI tools & techniques and their impact
Issue Date
Submission Date
IV Name & Date
Submission Format
Part I: Project submission. This should be a zip / rar folder of your project, including all
necessary files to run your project. There should be a link to your Tableau work on
Tableau Public cloud.
Part II: The submission is in the form of a group written report. This should be written in
a concise, formal business style using single spacing and font size 12. You are required
to make use of headings, paragraphs and subsections as appropriate, and all work must
be supported with research and referenced using the Harvard referencing system.
Please also provide a bibliography using the Harvard referencing system.
Part III: Team needs to present their point of view about how business intelligence tools
can contribute to effective decision-making as well as the legal issues involved in
exploiting user data for business intelligence. You may need to research for specific
examples of organizations that use BI tools to enhance or improve their business and
evaluate how they can use BI tools for extend their target audience and make them
more competitive within the market.
Unit Learning Outcomes
LO3 Demonstrate the use of business intelligence tools and technologies
Assignment Brief
(Continued from previous scenario)
Your next task is to demonstrate to the board of directors about the ability of applying
business intelligence in the company's current business processes. To demonstrate BI,
you need to prepare a presentation about BI and related tools & techniques and a
demonstration on real company dataset.
For the presentation, you need:
- Explain general concept of what is BI
- Introduction to some tools / techniques for BI and their application in general For
the demonstration, you need:
- A (some) data set(s) extracted from the company's business processes. Explain
the dataset.
- Show how you pre-process data for later analysis, explain each step and it
purpose
- Design dashboards to show your analysis on pre-processed data. Explain clearly
purpose of dashboards and charts. Suggestions should be made after analysis During the
demonstration, you need collect feed-back and comments from users to review how
well your dashboards design meet user or business requirement and what customization
needed for future use.
Team needs to present their point of view about how business intelligence tools can
contribute to effective decision-making as well as the legal issues involved in exploiting
user data for business intelligence. You may need to research for specific examples of
organizations that use BI tools to enhance or improve their business and evaluate how
they can use BI tools for extend their target audience and make them more competitive
within the market.
To summary, you need to submit a report in PDF includes 4 parts: your presentation,
result of demonstration and review of user feedback, point of view on BI contribution and
legal issues.
Learning Outcomes and Assessment Criteria
Pass
Merit
Distinction
LO3 Demonstrate the use of business intelligence tools and technologies
P3 Determine, with examples, what
business intelligence is and the tools and
techniques associated with it.
M3 Customise the design to ensure that it is
user friendly and has a functional interface.
D3 Provide a critical review of the
design in terms of how it meets a
specific user or business
requirement and identify what
customisation has been integrated
into the design.
P4 Design a business intelligence tool,
application or interface that can
perform a specific task to support
problemsolving or decision-making at an
advanced level.
LO4 Discuss the impact of business intelligence tools and technologies for effective
decision-making purposes and the legal/regulatory context in which they are used
P5 Discuss how business intelligence
tools can contribute to effective
decision-making.
P6 Explore the legal issues involved in
the secure exploitation of business
intelligence tools
M4 Conduct research to identify specific
examples of organisations that have used
business intelligence tools to enhance or
improve operations.
D4 Evaluate how organisations
could use business intelligence to
extend their target audience and
make them more competitive
within the market, taking security
legislation into consideration
ASSIGNMENT 2 FRONT SHEET
Qualification
BTEC Level 5 HND Diploma in Computing
Unit number and title
Unit 14: Business Intelligence
Submission date
June 15th, 2023
Re-submission Date
Date Received 1st submission
Date Received 2nd submission
Student Name
Đào Vĩnh Khang
Student ID
GCS200222
Class
GCS0905B
Assessor name
SAMNX
Student declaration
I certify that the assignment submission is entirely my own work and I fully understand the consequences of plagiarism. I understand
that making a false declaration is a form of malpractice.
Student’s signature
Grading grid
P3
P4
M3
D3
Summative Feedback:
Grade:
IV Signature:
Resubmission Feedback:
Assessor Signature:
Date:
Table of content
P3. DETERMINE, WITH EXAMPLES, WHAT BUSINESS INTELLIGENCE IS AND THE TOOLS AND TECHNIQUES ASSOCIATED WITH IT
1.1What is Business Intelligence? ...........................................................................................................10
1.2How Business Intelligence systems are implemented? .....................................................................11
1.3Example about Business Intelligence .................................................................................................12
1.3.1 Example 1: ......................................................................................................................................12
1.4 Tools and Techniques ........................................................................................................................13
P4. DESIGN A BUSINESS INTELLIGENCE TOOL, APPLICATION OR INTERFACE THAT CAN PERFORM A SPECIFIC TASK TO SUPPORT
PROBLEM SOLVING OR DECISION-MAKING AT AN ADVANCE LEVEL ......................................................18
P5. Discuss how business intelligence tools can contribute to effective decision-making .....................21
P6 Explore the legal issues involved in the secure exploitation of business intelligence tools ..............28
10
4.1 Reference ..........................................................................................................................................34
Figure 1: BI (Business Intelligence) is a set of processes .........................................................................11
Figure 2 Example Business Intelligence ...................................................................................................12
Figure 3 SAP Business Intelligence ..........................................................................................................14
Figure 4 MicroStrategy is a business intelligence tool ............................................................................15
Figure 5 Datapine is an all-in-one BI ........................................................................................................16
Figure 6 CHART PIE DESIGN A BUSINESS INTELLIGENCE TOOL................................................................18
Figure 7 Tableau Category, Ship Mode, Profit and Sales.........................................................................19
Figure 8 Tableau First Class, Same Day, Second Class and Standard Class. ............................................20
Figure 9 Tableau 405,461 and also the sale is about 2,840,846..............................................................21
Figure 10 Data Analysis............................................................................................................................22
Figure 11 Visualization.............................................................................................................................23
Figure 12 Forecasting ..............................................................................................................................24
Figure 13 Collaboration ...........................................................................................................................25
Figure 14 Continuous...............................................................................................................................26
Figure 15 Tableau Store Technology .......................................................................................................27
Figure 16 Data Privacy .............................................................................................................................29
Figure 17 Data security ............................................................................................................................30
Figure 18 Intellectual ...............................................................................................................................31
Figure 19 Compliance ..............................................................................................................................32
Figure 20 Transparency ...........................................................................................................................33
ASSIGNMENT 2
1
P3. DETERMINE, WITH EXAMPLES, WHAT BUSINESS INTELLIGENCE IS AND THE TOOLS AND TECHNIQUES
ASSOCIATED WITH IT
1.1 What is Business Intelligence?
BI (Business Intelligence) is a set of processes, architectures, and technologies that convert raw data into meaningful information
that drives profitable business actions. It is a suite of software and services to transform data into actionable intelligence and
knowledge.
BI has a direct impact on organization's strategic, tactical, and operational business decisions. BI supports fact-based decision
making using historical data rather than assumptions and gut feeling.
Figure 1: BI (Business Intelligence) is a set of processes
1.2 How Business Intelligence systems are implemented?
Here are the steps:
•
Step 1: Raw Data from corporate databases is extracted. The data could be spread across multiple systems
heterogeneous systems.
•
Step 2: The data is cleaned and transformed into the data warehouse. The table can be linked, and data cubes are
formed.
•
Step 3: Using BI system the user can ask quires, request ad-hoc reports or conduct any other analysis.
1.3 Example about Business Intelligence
1.3.1 Example 1:
Figure 2 Example Business Intelligence
In an Online Transaction Processing (OLTP) system information that could be fed into product database could be
•
Add a product line
•
Change a product price
Correspondingly, in a Business Intelligence system query that would be executed for the product subject area could be did the
addition of new product line or change in product price increase revenues
In an advertising database of OLTP system query that could be executed
•
Changed in advertisement options
•
Increase radio budget
Correspondingly, in BI system query that could be executed would be how many new clients added due to change in radio
budget
In OLTP system dealing with customer demographic data bases data that could be fed would be
•
Increase customer credit limit
•
Change in customer salary level
Correspondingly in the OLAP system query that could be executed would be can customer profile changes support higher
product price.
b. Example 2:
A hotel owner uses BI analytical applications to gather statistical information regarding average occupancy and room rate. It
helps to find aggregate revenue generated per room.
It also collects statistics on market share and data from customer surveys from each hotel to decides its competitive position in
various markets.
By analyzing these trends year by year, month by month and day by day helps management to offer discounts on room rentals.
1.4
Tools and Techniques
a. Tools
SAP Business Intelligence
SAP Business Intelligence offers several advanced analytics solutions including real-time
BI predictive analytics, machine learning, and planning & analysis. The Business Intelligence platform offers reporting & analysis,
data visualization & analytics applications, office integration and mobile analytics. SAP is a robust software intended for all roles
(IT, end uses and management) and offers tons of functionalities in one platform.
Figure 3 SAP Business Intelligence
MicroStrategy
MicroStrategy is a business intelligence tool that offers powerful (and high speed) dashboarding and data analytics which help
monitor trend, recognize new opportunities, improve productivity and more. Users can connect to one or various sources,
whether the incoming data is from a spreadsheet, cloud-based or enterprise data software. It can be accessed from your
desktop or via mobile.
Figure 4 MicroStrategy is a business intelligence tool
Datapine
Datapine is an all-in-one BI platform that facilitates the complex process of data analytics even for non-technical users. Thanks to
a comprehensive self-service analytics approach, datapine’s solution enables data analysts and business users alike to easily
integrate different data sources, perform advanced data analysis, build interactive business dashboards, and generate actionable
business insights.
Figure 5 Datapine is an all-in-one BI
b. Techniques
OLAP
It provides summarized and multi-dimensional views of business data and is used for analysis, modeling, reporting, and planning
for optimizing the business. It discovers trends and analyze critical factors through reporting software, data mining and data
warehouses, information visualization and dash boarding, knowledge management mapping, decision support systems and
forecasting, management information systems, document warehouses and document management, Software as a Service
(SaaS), geographic information systems and Trend Analysis.
Model Visualization
Making discovered knowledge easily understood using plots, charts, histograms, and other visual means.
Advance Analytics
It is referred to as forecasting, data mining, or predictive analytics, which takes advantage of statistical analysis techniques to
provide or predict certainty measures on facts. It is to be noted that despite major investments in enterprise resource planning
(ERP) and customer relationship management (CRM), the firms need to support the analysis and application of information to
make operational decisions.
Classification, Clustering and outlier analysis
Determines to which class a data item belongs and partition it into classes, whereby items with similar characteristics are
grouped together.
Exploratory Data Analysis (EDA)
Its goal is to identify patterns in an exploratory manner and then explore a dataset without a strong dependence on assumptions
or models.
2
P4. DESIGN A BUSINESS INTELLIGENCE TOOL, APPLICATION OR INTERFACE THAT CAN PERFORM A
SPECIFIC TASK TO SUPPORT PROBLEM SOLVING OR DECISION-MAKING AT AN ADVANCE LEVEL
I will use Tableau tool to design and analyze the data, below is the chart:
Figure 6 CHART PIE DESIGN A BUSINESS INTELLIGENCE TOOL
I will assign data about Category, Ship Mode, Profit and Sales. We can look at the Side-by-side bar to figure out the profit and sale
information of all regions.
Figure 7 Tableau Category, Ship Mode, Profit and Sales
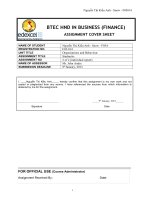
We can also create another chart to know the information about First Class, Same Day, Second Class and Standard Class.
Figure 8 Tableau First Class, Same Day, Second Class and Standard Class.
In this text table report, Technology category and Standard Class ship mode have the high profit, it’s about 405,461 and also the sale
is about 2,840,846.
Figure 9 Tableau 405,461 and also the sale is about 2,840,846.
3
P5. Discuss how business intelligence tools can contribute to effective decision-making
Business intelligence tools are designed to analyze and present data in a way that helps organizations make
more informed decisions. By providing real-time insights into a company's operations, these tools can help
managers identify trends, spot problems, and develop strategies to improve performance. Here are some ways
business intelligence tools can contribute to effective decision-making:
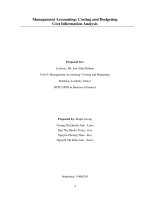
Data analysis: Business intelligence tools provide the capability to analyze large volumes of data quickly and
efficiently. This enables managers to identify patterns and trends that would be difficult or impossible to
discern manually. By providing real-time data, business intelligence tools can help managers make informed
decisions based on up-to-date information.
Figure 10 Data Analysis
Visualization: Business intelligence tools often use visualizations to represent complex data in a more
digestible way. This can help managers understand the relationships between different data points and
identify areas for improvement. For example, a sales dashboard may use a heat map to show which regions are
generating the most revenue, or a bar chart to show which products are selling the most.
Figure 11 Visualization
Forecasting: Business intelligence tools can help managers make more accurate predictions about future
trends. By analyzing historical data, these tools can identify patterns and trends that can be used to predict
future performance. This can be particularly useful in areas like sales forecasting or inventory management,
where accurate predictions are crucial to business success.
Figure 12 Forecasting
Collaboration: Business intelligence tools can facilitate collaboration and communication among team
members. By providing a centralized platform for data analysis and reporting, these tools can help ensure that
everyone is working from the same data set and making decisions based on the same information.
Figure 13 Collaboration
Continuous improvement: Business intelligence tools can help managers identify areas for improvement and
track progress over time. By setting targets and monitoring performance, managers can identify areas where
they need to make changes to improve efficiency, reduce costs, or increase revenue.