wto annual report 2001 (wto world trade organization annual report)
Bạn đang xem bản rút gọn của tài liệu. Xem và tải ngay bản đầy đủ của tài liệu tại đây (698.44 KB, 151 trang )
A
N
N
U
A
L
R
E
P
O
R
T
2
0
0
1
A
N
N
U
A
L
R
E
P
O
R
T
2
0
0
1
Albania
Angola
Antigua and Barbuda
Argentina
Australia
Austria
Bahrain
Bangladesh
Barbados
Belgium
Belize
Benin
Bolivia
Botswana
Brazil
Brunei Darussalam
Bulgaria
Burkina Faso
Burundi
Cameroon
Canada
Central African Republic
Chad
Chile
Colombia
Congo
Costa Rica
Côte d’Ivoire
Croatia
Cuba
Cyprus
Czech Republic
Democratic Republic of the
Congo
Denmark
Djibouti
Dominica
Dominican Republic
Ecuador
Egypt
El Salvador
Estonia
European Communities
Fiji
Finland
France
Gabon
The Gambia
Georgia
Germany
Ghana
Greece
Grenada
Guatemala
Guinea Bissau
Guinea
Guyana
Haiti
Honduras
Hong Kong, China
Hungary
Iceland
India
Indonesia
Ireland
Israel
Italy
Jamaica
Jordan
Japan
Kenya
Korea, Republic of
Kuwait
The Kyrgyz Republic
Latvia
Lesotho
Liechtenstein
Luxembourg
Macau, China
Madagascar
Malawi
Malaysia
Maldives
Mali
Malta
Mauritania
Mauritius
Mexico
Mongolia
Morocco
Mozambique
Myanmar
Namibia
Netherlands
New Zealand
Nicaragua
Niger
Nigeria
Norway
Oman, Sultanate of
Pakistan
Panama
Papua New Guinea
Paraguay
Peru
Philippines
Poland
Portugal
Qatar
Romania
Rwanda
Saint Kitts and Nevis
Saint Lucia
Saint Vincent & the Grenadines
Senegal
Sierra Leone
Singapore
Slovak Republic
Slovenia
Solomon Islands
South Africa
Spain
Sri Lanka
Suriname
Swaziland
Sweden
Switzerland
Tanzania
Thailand
Togo
Trinidad and Tobago
Tunisia
Turkey
Uganda
United Arab Emirates
United Kingdom
United States
Uruguay
Venezuela
Zambia
Zimbabwe
WTO Members
(As of 31 December 2000)
This study is also available in French and Spanish – (Price: SFr 50)
To order, please contact:
WTO Publications
Centre William Rappard
154, rue de Lausanne - CH-1211 Geneva
Tel: (41 22) 739 5208/5308 - Fax (41 22) 739 54 58
E-mail:
ISSN 1020-4997
ISBN 92-870-1218-0
Printed in France
V-2001-5,000
© World Trade Organization 2001
Chapter One
O
VERVIEW
2
The year 2000 and the first part of 2001 was a busy and productive period for the WTO,
with most activities falling into one of four categories: first, the launching of new
negotiations on trade in agricultural products and trade in services; second, a broad range of
ongoing activities that constitute the WTO’s day-to-day work, such as accessions and the
settlement of disputes between the member countries; third, the adoption of new measures
to assist the WTO’s least developed Members; and fourth, progress in dealing with issues
arising out of the December 1999 Seattle Ministerial meeting, including renewed efforts to
launch a comprehensive round of multilateral trade negotiations.
Overview
Introduction
Negotiations on agriculture and services
New negotiations on trade in the areas of agriculture and services, mandated by the
Members when they signed the Uruguay Round agreements in Marrakesh in 1994, were
launched in early 2000. As is evident both from the one-year stocktaking and from the
agreement on work plans for the second year (completed in March 2001), the negotiations
are progressing on schedule. Altogether 125 WTO Members have submitted 44 proposals in
the agriculturalnegotiations. These proposals will be the focus of the second phase, which
will be a more challenging process since the list of issues to be considered is long and
reflects a wide range of interests and complexity. The negotiations on trade in serviceswill
also consider a large number of proposals. The guidelines adopted restate the fundamental
principles of the GATS: governments’ right to regulate and to introduce new regulations on
the supply of services in pursuit of national policy objectives; their right to specify which
services they wish to open to foreign suppliers and under what conditions; and the granting
of additional flexibility for developing and least-developed countries.
While there certainly is room for legitimate differences of opinion regarding what
countries’ policies should be in these sensitive areas, it is also true that the growing public
awareness of the significance of these negotiations has been accompanied by a number of
instances of ill-informed comments and misinformation. This has prompted efforts by the
Secretariat and some governments to increase the public’s awareness of the facts of the
situation, and to emphasize the importance of conducting public debates on trade policy
– essential in any democratic process – on the basis of an accurate understanding of the
policies being considered by the negotiators.
The WTO’s day-to-day activities
The many ongoing activities involved in the regular operation of the WTO – including the
various councils, committees and trade policy reviews – are detailed in Chapter Four. Three of
the more active areas last year were:
Accessionsto the WTO, all involving developing or transition economies, continued at a
steady pace. Bringing the total membership to 140, five countries became new Members in
2000 – Jordan, Georgia, Albania, Oman and Croatia. The accessions of Lithuania and
Moldova are expected to be finalized in the first half of 2001, the accessions of China,
Chinese Taipei and Vanuatu are close, and that of the Russian Federation is showing
encouraging progress. Another 25 governments have also requested accession, including the
Federal Republic of Yugoslavia, which submitted its formal request in January 2001. Clearly,
full participation in the multilateral trading system remains a vital element in countries’
development strategies.
Dispute settlement, one of the WTO’s core functions, has become increasingly active.
Between January 1995 and March 2001, there were 228 complaints, with about one quarter
of the notifications coming from developing countries. More recently, nearly one half of the
46 complaints received during the 15 months from January 2000 through March 2001 were
notified by developing countries. An active dispute settlement system can be a sign of
growing trade frictions. But, as the increased use of the dispute settlement procedures by
developing countries indicates, it can also reflect a greater willingness of WTO Members to
use the procedures to protect their WTO rights. The existence of this rules-based option for
resolving trade disputes is particularly important for medium and smaller size WTO Members.
Electronic commerceis an example of one of the WTO’s more specialized activities. A
comprehensive work programme, involving an examination of all trade-related issues arising
from electronic commerce, was launched in 1998. At its July 2000 meeting, the General
Council reiterated the importance of the WTO’s work in this area.
3
Assisting least-developed countries
In the ongoing work programme, particular emphasis has been given to measures intended
to advance the interests of the of least-developed countries (LDCs). In response to an appeal by
the Director-General, a number of Members have recently announced improvements to market-
access opportunities for products from LDCs. The Director-General is also continuing efforts to
improve the Integrated Framework for LDCs – an initiative with other international agencies to
coordinate the provision of technical assistance and capacity building. Following an
independent review of the Integrated Framework, the six agencies (ITC, IMF, UNCTAD, UNDP,
World Bank and WTO) met in July 2000 and agreed on a series of new arrangements aimed at
ensuring that countries’ needs in the areas of trade policy, trade-related technical assistance,
and capacity-building would be articulated in a broad development context.
Improving the planning and funding of the WTO’s technical cooperationactivities has
also been a major focus. Technical cooperation activities with middle and lower income
countries – both Members and those in the process of acceding to the WTO – are aimed at
improving Members’ understanding of the WTO agreements and facilitating their capacity
both to implement their WTO obligations and defend their WTO rights. At the same time,
emphasis is increasingly being placed on enhancing the capacity of countries to integrate
into the world economy and to realize the benefits of the market-access opportunities
available to them as a result of WTO Membership.
Within the Secretariat, the Director-General has taken steps to refocus the delivery of
technical cooperation activities. This effort included the establishment of an audit function,
with the aim of ensuring that technical cooperation and training efforts are producing the
kinds of skills and knowledge in beneficiary countries that these Members and accession
candidates need to be effective participants in the WTO system.
The member countries are well aware that a number of factors were behind the lack of
success of the Seattle Ministerial meeting. Chief among these were a concern on the part of
many Members regarding opportunities for all WTO Members to participate in the
deliberations and decision making on important issues, the perceived difficulties many
developing and least developed countries are still having in implementing the new
obligations agreed to in the Uruguay Round, and important disagreements regarding what
should be on a new negotiating agenda. Intensive discussions and negotiations this past
year have produced progress in all three areas (especially in the first two), improving the
prospect that the Fourth Session of the WTO Ministerial Conference – to be held in Doha,
Qatar, from 9-13 November 2001 – will be successful.
Issues arising out of the Seattle Ministerial
4
The 2000 work programme included a series of discussions aimed at finding ways to
ensure the fuller participation of all Members in the work of the WTO and to improve
consultative procedures. From these discussions it became clear that a majority of Members
saw no need for radical reform of the WTO, firmly supported the practice of reaching
decisions by consensus, and indicated they believe informal consultations would continue to
be a useful tool, provided that certain improvements regarding inclusiveness and
transparency were introduced. By the end of the year most Members had expressed
satisfaction with the way in which the consultative processes were being carried out.
From the outset of the debate on internal transparency the Director-General also
instructed the WTO Secretariat to find immediate practical ways to improve and speed up the
flow of information to Members, including Members without representatives resident in
Geneva. A number of innovations have been made in this area, including improved use of
electronic communications, an annual week-long seminar for non-resident delegations
(“Geneva Week”) and the installation of an increasing number of WTO Reference Centres in
developing and least-developed countries.
This is a convenient point to note that progress has also been made in the related area of
external transparency and public outreach. Although there is no consensus among WTO
Members in favour of involving NGOs directly in the work of the WTO, the existing guidelines
on relations with NGOs were designed by Members to give the Secretariat an appropriate
degree of flexibility in dealing with these organizations. Within these guidelines, an
increasing number of symposia have been held. Other initiatives designed to increase the
dialogue between the WTO and the public include a new and more user-friendly website
which now averages around 250,000 visitors each month (349,000 in March 2001). The
Chairman of the General Council also held an informal consultation on external transparency
in November, where there was broad agreement among Members that the WTO should
continue to improve its outreach activities, including organizing and hosting symposia
Implementation of existing obligations
Another key aspect of the 2000 work programme which continues into 2001 is the
General Council’s work on implementation-related issues following its decision in May 2000
to establish an “implementation review mechanism”. This process covers a wide range of
issues raised by Members in the context of the implementation of existing agreements and
decisions, and is due to be completed by the time of the Ministerial Conference in November
2001. In addition, a formal Decision was adopted by the General Council in December 2000,
in which action was taken on a number of implementation-related issues. This decision was
seen as being modest but important, since it was a clear indication of the collective will of
the Members to take decisions on implementation-related issues and concerns, and also to
continue to work to find solutions in this area. Many Members have warned that no new
round can begin, or more importantly conclude, without progress on these matters.
Launching a new round
Although it is not certain that the political will needed to launch a new round of
multilateral trade negotiations will manifest itself this year, the prospects have been
improved by a number of developments. These include the progress on the issues of
participation of developing countries in the WTO system andimplementation of Uruguay
Round commitments. There is also the progress to date in the negotiations on agriculture
and services, where many participants argue that significant liberalization in these two
sensitive areas will require a broader agenda in order to increase the opportunities for
countries to make important trade-offs. Many Members feel that they should not enter into
new commitments when they hve not been able to implement existing ones.
Interest in the advantages of launching a new round sooner rather than later has also
been stimulated by the slowdown in global economic activity, including the slower
expansion of world trade, noted in Chapter Two. It is true that 2000 was an outstanding year
for global growth in trade and output that benefited allregions. By the year’s end, however,
a marked slowdown was apparent, and this tendency has continued into early 2001. The
outlook remains uncertain, and it seems likely that global trade will expand in 2001 at little
more than half last year’s rate.
As we have seen in past downturns, such as the Asian financial crisis, the WTO’s rules
and disciplines help restrain protectionist pressures and keep markets open, which in turn
Fuller participation of all Members
reduces the severity of the downturn and brings an earlier recovery. This is especially true
when a formal round of multilateral trade negotiations is underway. Confidence-building
actions – such as an agreement among 140 countries to launch a major new trade
liberalizing round – can also be especially valuable as global economic conditions worsen
and governments search for ways to promote economic recovery. Moreover, in the medium
term the negotiations open the possibility of an inflation-free economic stimulus from the
resulting multilateral liberalization – a stimulus which would be widely shared across
economies at all levels of development.
The spreading interest in regionalisminteracts with the prospects for a new round in two
ways. One of the factors influencing governments to give a higher priority to regional or
bilateral trade agreements in the post-Seattle period has undoubtedly been a feeling that
assembling the necessary consensus for launching a new WTO Round has become difficult.
If the alternative to launching a new round was either maintenance of the status quo or
a descent into the economic chaos that characterized the 1930s, there would be much less
to fear because countries will never again allow the latter to occur. The problem with
regional liberalization – from the perspective of the multilateral trading system and against
the background of the failure thus far to launch a new round – is that while it is a less
desirable alternative to multilateral liberalization, it is an alternative. In other words, when
the multilateral trading systems is functioning well it serves to keep regional integration
focused on outward oriented integration and provides opportunities for regional integration
to complement global integration. But when the multilateral system is seen as not delivering
what its Members want from it, they will look at other options.
It is not just the risk that in the present climate regional integration agreements are more
likely to become “inward looking” and to leave aside the liberalization of difficult areas
(such as agriculture). Additionally, as preferential agreements begin to encompass
“regulatory issues”, the risk of regional divergence in approaches to the rules arises, which
not only complicates and distorts the situation facing firms and investors, but also increases
the difficulty of agreeing – down the road – on multilateral rules. These and other downside
risks associated with regionalism at the present time are important considerations for WTO
Members to keep in mind as they prepare for the Doha meeting in November. The essential
challenge is to ensure that multilateral liberalization takes place in parallel with any regional
initiatives – the multilateral focus must not be neglected. When regionalism is seen as a
substitute for multilateralism, it can be a danger to the more vulnerable economies
Another consideration which is heightening interest in a new Round is shared, to varying
degrees, across governments and critics of globalization. This is the growing perception of
the importance of a global framework of multilaterally agreed, enforceable, non-
discriminatory rules and disciplines to guide trade relations in an open and equitable way.
While the Uruguay Round was a remarkable achievement in many ways, many member
governments and WTO critics agree that certain adjustments to the rules are needed if the
trading system is to better reflect the social, economic and political conditions of a rapidly
changing world. Agreement remains elusive on how existing rules should be changed or
whether new rules need to be agreed. But even the sternest critics of globalization today
point out the dangers of a completely “hands off” approach to commercial relations in an
increasingly integrated and interdependent world and warn that the alternative to
multilateral rules is reliance on the law of the jungle. The political debate clearly is moving in
a constructive direction.
Of course opinions vary widely as to how the rules-based system should evolve. Resolving
such differences is, in fact, the objective of such negotiations. But resolving all the
differences should not be a prerequisite for launching negotiations. Indeed, the recent past
has shown that imposing overly burdensome detail on Ministers and officials as they draft
negotiating guidelines can seriously inhibit the launch of a new round. The focus should be
on launching a process broad and inclusive enough to enable all WTO Members to feel part
of and become fully engaged in the negotiations.
The WTO functions on the basis of consensus. Along with being essential for the
acceptance and enforcement of its rules, it also gives negotiating agendas a solid basis in
democratic legitimacy and accountability. It makes the evolution of an agenda a complex
process, calling for flexibility and realism on all sides. Launching a new round or a wider set
of negotiations is among the most difficult subjects for consensus-building, second only to
concluding negotiations. As informal discussions among Members on a possible agenda
intensified in early 2001, it appeared that these points were well understood. No-one can
yet predict whether the factors favouring the launch of a major new round at Doha will
prove strong enough to outweigh the difficulties, though – as noted above – the odds in
favour are improving.
5
Chapter Two
W
ORLDTRADE
DEVELOPMENTS
8
The year 2000 witnessed the strongest global trade and output growth in more than a
decade. This outstanding expansion of the world economy was the result of the continued
acceleration of output growth in the already fast expanding economies of North America and
developing Asia, a recovery from output stagnation in South America and Russia and a pick-
up in economic activity in other regions. North America and Western Europe, which together
account for about 60% of global output and trade, recorded in 2000 their fastest annual
GDP growth in the 1990s.
1
In addition to the outstanding global growth, the dispersion of
regional growth rates was very low in 2000, indicating that the stronger world economy was
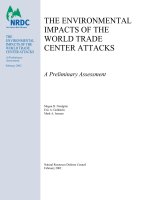
beneficial to all regions. In the second half of the year there were numerous signs that the
expansion of the world economy had begun to slow down (Chart II.1).
World trade developments
Main features
Chart II.1
Growth in the volume of world merchandise trade and GDP, 1990-2000
(Annual percentage change)
World GDPMerchandise exports
0
2
4
6
8
10
12
14
199091 92 93 94 95 96 97 98 99 2000
Average export growth (6.8)
Average GDP growth (2.3)
Stronger output growth in all regions was associated with trade expansion in 2000 that
matched – in volumeterms – the best rates observed over the last five decades. For most
regions, merchandise trade growth ranged between 10 and 15%. Although US merchandise
imports continued to grow at double-digit rates, the growth was no longer the highest
among the regions. Imports of Asia and the transition economies expanded faster, and those
of Latin America matched the United States figures.
The information and telecommunication sector was again one of the most dynamic
sectors stimulating the expansion of output, investment and trade. Although the final quarter
of 2000 recorded a slackening in the “new economy” boom, the average annual growth
remained very high. This can be illustrated by the rise in global sales of semi-conductors
which rose by 37% to $204 billion, and by that of mobile phones which exceeded 410
million units, an increase of 46% over 1999.
2
Sales of personal computers rose by nearly
15% to reach 135 million units.
3
Although office and telecom equipment was again one of the fastest growing product
categories in international trade, the nearly 60% rise in crude oil prices led to a dramatic
increase in the valueof fuels traded internationally and dwarfed the growth of all other
product categories. Real oil prices
4
reached their highest level since 1985 and the share of
fuels in world merchandise trade is estimated to have recovered to somewhat above 10%,
close to its share in 1990. Prices for all internationally-traded goods remained almost
unchanged from the preceding year as sharply higher prices for fuels were offset by declines
in the prices of manufactured goods. The price decline in 2000 for manufactures was the
fifth in a row, causing prices to fall to their lowest level in 10 years. Several factors
contributed to this outcome. First, inflation has receded worldwide to levels last seen in the
1960s. Second, the share of office and telecom equipment in world exports of manufactures
1
The five East Asian countries most affected by
the Asian crisis exceeded again in 2000 their
pre-crisis peak level.
2
Semiconductor Industry Association, World
Semi-conductor Trade Statistics, direct
communication, and Gartner Dataquest, Press
Release, February 2001.
3
Gartner Dataquest, Press Release, January
2001.
4
Real oil prices are obtained by deflating the
nominal oil price by the world export unit value
of manufactures.
increased and their prices have fallen considerably throughout the 1990s. Third, the strength
of the US dollar over the last years which, led to a dollar price decline for those goods
traded at nearly stable prices in depreciating currencies.
Non-fuel commodity prices edged up slightly in 2000 as the recovery in metal prices and
the higher prices for agricultural raw materials were not fully offset by price decreases for
beverages and food. This modest recovery left non-fuel commodity prices more than 20%
below their peak level in 1995 and almost 10% below their level at the beginning of the
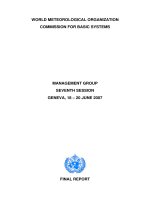
1990s. As price declines for manufactures and non-fuel primary products were not fully
offset by the increase in fuel prices, the 1990-2000 period recorded an average decline of
nearly 1%. From an inflation perspective, this is historically an outstanding performance as
even the 1950s and 60s recorded a moderate price increase in international trade. One of
the major differences in the 1990s relative to previous periods is the decline in the dollar
prices for manufactured goods (Chart II.2).
9
40
50
60
70
80
90
100
110
120
130
Chart II.2
Price developments in international trade, 1990-2000
(Indices, 1990 = 100)
Crude petroleum
Manufactures
a
Non-fuel primary commodities
a Unit value index.
Sources :
IMF, International Financial Statistics and WTO Secretariat estimates.
1990 200091 92 93 94 95 96 97 98 99
The marked changes in relative prices were beneficial for those regions and countries
where fuels are an important part of exports, such as the Middle East, Africa and the
transition economies. In 1999 fuel exports accounted for more than one fifth of total
merchandise export earnings in about 30 countries, and for nearly half of them the share
exceeded two thirds of merchandise exports. As most of these fuel exporters are developing
countries, these price developments contributed to lift the share of developing countries in
world merchandise trade to its highest level since 1950 (more than 30%).
Certain least-developed countries also benefited from the higher oil prices. Developed
countries’ imports from the three oil-exporting LDC countries – Angola, Yemen and Sudan –
increased by about two thirds. Imports from Asian LDCs, consisting largely of manufactured
goods, increased by about 30%. However, imports from non-fuel commodity exporting
African LDCs have probably increased by less than 10%.
In 2000, the valueof total merchandise exports rose by 12.5% to $6.2 trillion, thereby
exceeding for the second year in a row the growth of commercial services exports, which
rose by nearly 5% to $1.4 trillion dollars (Table II.1).
Table II.1
World exports of merchandise and commercial services, 1990-2000
(Billion dollars and percentage)
Value Annual percentage change
2000 1990-2000 1999 2000
Merchandise 6180 6.0 4.0 12.5
Commercial services 1415 6.0 1.5 5.0
10
The strength of global trade expansion was supported by international capital flows
which provided for the financing of the current account deficits of the United States, Latin
America and the transition economies. Global FDI flows are estimated to have grown by
about 15%, a much slower rate of growth than in the preceding years, with FDI flows
betweendeveloped countries continuing to be the most dynamic. The value of FDI inflows
into developing countries remained roughly unchanged from the preceeding year.
5
FDI
inflows into Latin America have most likely exceeded those into developing Asia for the
second year in a row.
Despite the strong global economic growth and the sharp rise in oil prices, inflation rates
remained low in industrial countries and in developing Asia, and decreased in Latin America
and the Middle East. According to the IMF the world average of national consumer prices fell
to 4%, the lowest rate in more than 30 years.
Unemployment fell to a record low in the United States, decreased in Western Europe but
increased in Japan. Data on employment in developing countries are scarce but the higher
growth in 2000 must have been beneficial for employment growth. However, according to
CEPAL, urban unemployment rates in Latin America remained unchanged from the preceding
year despite the acceleration of growth.
6
This calls attention to the need for sustained high
growth over the medium-term to improve the employment situation in regions with a high
labour force growth.
1.Global trade and output developments
Economic activity strengthened in 2000 in all major regions leading to the fastest global
output growth in the last decade. North America, the transition economies and Western
Europe recorded in 2000 their best annual GDP growth in ten years. The transition
economies and North America expanded their output by at least 5% last year, while the
output of the other regions grew in the range of 3-4%. Asia’s regional average rate conceals
the contrasting development of rigorous expansion of 7% in developing Asia and the
modest advance in Japan. While the regional output of Latin America recovered strongly and
matched the global average, that of Western Europe and Africa grew somewhat below the
average. Per capita GDP edged up only marginally in Africa which points to no significant
improvement in poverty reduction (Chart II.3).
5
UNCTAD, Press Release TAD/INF/2875, 7
December 2000.
6
CEPAL, Balance preliminar de las economías
de América Latina y el Caribe, 2000.
Chart II.3
Real GDP growth by region, 1999-2000
(Annual percentage change)
Transition economies
North America
Latin America
Middle East
Asia
Western Europe
Africa
01234567
2000
1999
Thus, in 2000, the United States was no longer the single motor of the world economy as
in the preceding years. Continued growth of investment and consumption in the United
States contributed to buoyant import growth and a marked widening of the deficit in the
external balance of the United States. Although the excess of imports over exports reached a
record level relative to GDP, and has become equivalent to 6% of world exports of goods
and services, it was financed easily, as large net capital inflows and the real effective
appreciation of the US dollar demonstrated.
11
7
According to information from various industry
sources, world automobile production is
estimated to have increased by 3.5% to 57.6
million units in 2000, while exports rose by 8%
to nearly 24 million units. The highest growth
in automobile exports was recorded in Latin
America.
The aggregate current account deficit of the Latin American countries was sharply curtailed
from its peak in 1998, but remained substantial in 2000. As in the preceding year, net foreign
direct investment inflows were larger than the deficit in the current account balance. The
reduction of Latin America’s deficit is largely due to favourable price developments, as the
volume growth of merchandise imports exceeded that of exports last year.
In contrast to North and Latin America – the two major regions with large current
account deficits – the volume growth of exports was more vigorous than imports in Asia, the
transition economies and Western Europe. Asia and the transition economies recorded both
the most dynamic export and import volume growth of all regions in the year 2000.
The valueof world merchandise trade rose by 12.5% in 2000 – twice the average for the
last decade – to reach nearly $6.2 trillion. Although the growth of commercial services
exports also picked up in 2000, its pace was subdued and below the average recorded in the
1990s. Due to the lacklustre performance of commercial services exports over the last two
years, its expansion over the last decade was, at 6% annually, no longer more dynamic than
that of merchandise.
2.Merchandise trade
Three main factors shaped the developments of world merchandise trade in nominal
dollar terms. First, the high level of economic activity worldwide that boosted the overall
volume growth. Second, the sharply divergent sectoral price trends concealed by the near
stability of average dollar prices in international trade. While prices of fuels and metals
recovered strongly, average prices of agricultural primary commodities stagnated and those
of manufactured goods decreased (the weakness in world export prices of manufactures is
primarily associated to exchange rate developments). Third, the variations among the three
key currencies – dollar, euro and yen – not only had an impact on regional but also on
sectoral trade flows. While the yen appreciated by 6%, the euro depreciated by 13% against
the US dollar in 2000. As domestic inflation was subdued in each currency area, the nominal
exchange rate variations translated into a marked appreciation of the real trade-weighted
exchange rate of the yen, a further increase in that of the US dollar and again a decline in
the trade weighted euro rate.
Preliminary information for 2000 on world merchandise trade by product group indicate
that – in value terms – fuels and office and telecom equipment were, as in 1999, by far the
most dynamic product categories in world trade, expanding five and two times faster than
the global average, respectively. In the case of fuels, the outstanding value increase is due to
the sharp increase in prices, while the buoyant expansion of trade in office and telecom
equipment can be attributed to the booming world-wide demand for semi-conductors and
telecom equipment, in particular mobile phones. Trade growth in automotive products was
sustained despite a slowdown in the world automobile production.
7
Merchandise trade in volume terms(that is, measured at constant prices and exchange
rates) rose by 12% in 2000, the fastest rate in more than a decade. The growth of
merchandise trade exceeded that of output by 8 percentage points, one of the largest
margins in the 1990s.
Asia and the transition economies recorded the highest regional trade growth in 2000
with both exports and imports up by around 15% (Chart II.4). In the case of the transition
economies, this development corresponds to the strong output recovery in the region,
particularly in Russia. The high trade growth in Asia looks surprising given the below average
expansion of Asian output. While both trade and output in developing Asia had been again
more vigorous than the world average, Japan’s weak economy surprised with a double-digit
increase in the volume of imports. Although fuels and office and telecom equipment
accounted for most of the extraordinary rise of Japan’s imports in 2000, other product
groups such as textiles, clothing and iron and steel recorded also substantial increases. The
strength of the yen presumably being a factor in this development.
North America’s merchandise exports accelerated markedly due to higher demand growth
outside the region, nearly matching the region’s import growth (which was up slightly over
the preceding year). Rebounding imports of Latin America matched the growth of North
American imports, but reflected highly different developments within the region. Mexico’s
and Venezuela’s import volume grew by more than 20% while that of the MERCOSUR
countries stagnated, following a decline in 1999. Export volume growth was more even
across Latin American countries, although Mexico’s export growth exceeded again that of
the region by a large margin. For the Middle East the available information points to a
volume increase of exports and imports above the 12% world average.
Western Europe’s export and import growth nearly doubled to 10% in 2000 but lagged
– as in the preceding year – somewhat behind the global average. Ireland and Finland, the
two countries in Western Europe with the highest share of office and telecom equipment in
their merchandise exports, benefited from the booming information technology sector and
12
recorded the highest export growth in the region. It is estimated that while African trade
showed an acceleration in 2000 compared with 1999, it continued to report the lowest
export and import growth of all regions in volume terms.
World merchandise trade growth measured in dollar termsshowed a considerably
wider variation than did trade measured in volume terms. This is particularly true for exports,
for which the year-to-year variations range from near stagnation to increases exceeding
50%. All the net fuel exporting regions showed stronger growth rates than the net fuel
importing regions, while the latter recorded – with one exception – higher import growth
rates than the fuel net-exporting regions. The influence of fuel prices is so pervasive that the
ranking of regions by their export growth in 2000 is identical with the ranking by the share
of fuels in their exports (Table II.2).
Table II.2
Growth in the value of world merchandise trade by region, 1990-2000
(Billion dollars and percentage)
Exports Imports
Value Annual percentage change Value Annual percentage change
2000 1990-2000 1998 1999 2000 2000 1990-2000 1998 1999 2000
World 6180 6.0 -1.5 4.0 12.5 6485 6.0 -1.0 4.5 12.5
North America 1060 7.3 -0.7 4.2 13.4 1508 8.9 4.6 11.2 17.8
Latin America 360 9.4 -1.3 6.4 20.8 389 11.9 5.0 -3.2 16.0
Mexico 166 15.1 6.4 16.1 22.0 183 15.0 14.0 13.5 22.9
Other Latin America 194 6.2 -6.1 -0.5 19.7 206 9.0 0.1 -13.3 10.5
Western Europe 2427 4.0 3.5 0.3 2.4 2550 4.1 5.6 1.6 4.4
European Union (15) 2239 4.0 4.0 0.1 1.9 2347 4.2 6.0 2.2 4.0
Excl. intra-EU trade 855 4.9 -0.3 -1.8 7.6 959 5.2 4.8 3.6 12.8
Transition economies 271 7.4 -4.0 -0.2 26.2 241 5.3 -2.1 -11.8 13.9
Central/Eastern Europe 116 7.7 9.3 1.1 14.1 147 10.4 10.8 -1.1 13.0
Russian Federation 105 - -15.2 1.1 39.0 44 - -21.2 -31.7 11.6
Africa 146 3.4 -16.2 10.2 27.0 136 3.9 0.9 -2.4 5.4
South Africa 30 3.2 -9.0 1.3 12.3 30 5.1 -9.4 -8.7 11.2
Major fuels exporters
a
59 3.8 -32.0 29.5 62.1 36 4.1 -1.5 -0.4 22.9
Middle East 266 7.1 -21.3 25.7 51.4 176 5.9 0.2 2.2 14.3
Asia 1649 8.4 -6.1 7.5 18.4 1482 7.7 -17.8 10.3 23.5
Japan 479 5.2 -7.8 8.1 14.3 380 4.9 -17.2 11.0 21.9
China 249 14.9 0.4 6.3 27.7 225 15.5 -1.3 18.2 35.8
Asia (5)
b
442 11.3 -3.5 10.2 18.5 373 8.3 -30.9 15.1 27.9
a
Angola, Algeria, Republic of Congo, Gabon, Libyan Arab Yamahiriya and Nigeria.
b
Indonesia, the Republic of Korea, Malaysia, Philippines and Thailand.
Chart II.4
Growth in the volume of merchandise trade by region in 2000
(Annual percentage change)
05101520
Imports
Exports
Transition economies
North America
Latin America
Asia
Western Europe
In the Middle East, where fuels have recently accounted for more than two thirds of
exports, merchandise exports expanded by more than one-half in 2000. Africa’s major
fuel exporters increased their shipments by more than 60% in dollar terms, lifting the
region’s export earnings by more than 25%. The one quarter rise of transition
economies merchandise exports can also be attributed to the region’s fuel exporters
– the Russian Federation, Kazakhstan and Turkmenistan – whose exports surged by 40,
64 and 100%, respectively.
The further depreciation of the euro and other currencies in Western Europe vis-à-visthe
US dollar by about 13% in 2000 is the principal reason why the growth in the dollar value
of Western Europe’s exports and imports was by far the lowest of all the regions in 2000.
Nevertheless, even for Western Europe, the general observation that regional export and
import growth in 2000 exceeded that in preceding year remains valid. Expressed in euros,
Western Europe’s merchandise exports rose by 18% in 2000, following a 3.5% increase in
1999.
Last year Asia recorded export and import growth rates that exceeded the best year in
the 1990s. Asia’s vigorous import expansion in 2000 – up by more than one fifth to
1660 billion dollars – brought imports to a level which exceeded the pre-crisis peak of 1997
by more than 12%. However, the combined import value of the five countries most affected
by the financial crisis of 1997-98 remained slightly below the 1996 peak, despite a nearly
50% cumulative increase over the last two years.
8
By contrast, their merchandise exports of
442billion dollars in 2000 were 30% above the corresponding value in 1996 and exceeded
last year’s imports by 69 billion dollars.
More generally, Asia’s merchandise import growth expanded for the second year in a
row faster than its merchandise exports, reducing the region’s merchandise trade surplus
(f.o.b c.i.f.) to 167 billion dollars. Among the Asian economies, China continued to show
outstanding strong import and export growth. Despite its sluggish economy, Japan’s value
of imports (and exports) rose faster than those of North America, which can be partly
attributed to the strength of both the intra-Asian trade recovery and of trade in office and
telecom equipment. These two factors also contributed to the strong export and import
growth of the East Asian developing economies. Australia’s merchandise exports rose faster
than world merchandise trade while its imports rose by only 3%, the main explanation
being the combination of stronger export prices, weaker domestic demand and a
depreciating currency.
Latin America’s trade acceleration in 2000 can be traced to a combination of the
continuously buoyant growth of Mexico’s trade and a rebound in Central and South
America’s trade. Higher prices of fuels boosted Venezuela’s exports by two thirds while
higher metal prices contributed to the turnaround in Chilean exports. The export recovery
together with a sustained high level of foreign direct investment inflows allowed imports of
South and Central America to continue expanding. One of the main features of Latin
America’s trade not only in 2000, but also over the last decade, is the exceptional expansion
of Mexico’s trade, in particular with the United States. By 2000, the share of Mexico in Latin
America’s exports and imports exceeded 45%.
In 2000, North America’s imports continued to expand for the fourth year in a row,
significantly faster than world imports but also faster than the region’s exports. As a result,
North America’s share in world merchandise imports rose to 23%, its highest level in the last
century. Although North America’s exports have also increased faster than world
merchandise trade over the last years, the merchandise deficit rose more than 100 billion
dollars. For the United States alone, the $450 billion merchandise trade deficit (f.o.b f.o.b.) in
2000 exceeds the total exports of goods and services of Latin America, as well as the
combined merchandise trade of the Middle East and Africa, and corresponds to more than
7% of world merchandise exports. Various factors contributed to this exceptionally large
trade deficit. First, the outstanding investment and consumption boom in the United States;
second, the strength of the US dollar; and third, the large net-capital inflows which financed
the excess of United States expenditure over savings. While it seems unlikely that this trend
can be sustained, it is difficult to predict when the reversal will occur.
Merchandise trade developments by country showed very large variations in 2000. While
the dollar value of merchandise exports of some West European countries decreased slightly,
the exports of some oil-exporting countries surged by two thirds or more. Exporters of
manufactured goods in developing Asia, as well as developing countries in other regions,
recorded increases in the range of 15 to 22%. Excluding the major oil exporters, China
recorded the largest increase of all major traders in 2000 (Table II.3).
Growth in the dollar value of imports varied among countries by nearly as much, from
near stagnation to expansion rates of 35 to 40%. Imports rose by one third or more in
China, the Republic of Korea, Turkey and Indonesia. For the latter two, the import surge
represented a recovery from shrinking import values in the preceding year. The weakness of
the euro contributed largely to the stagnation or modest growth in the dollar import value of
13
8
Indonesia, the Republic of Korea, Malaysia, the
Philippines and Thailand.
14
West European countries. Outside Europe, import growth was sluggish in Australia and
stagnated in Argentina. Merchandise imports into the United States rose by nearly 19%,
further strengthening its position as the world’s largest importer.
Looking at developments in the 1990-2000 period, outstanding performance in export
and import growth is recorded for both China and Mexico which expanded their exports and
imports by about 15% annually or more than two times faster than the global average.
Malaysia, the Philippines and Hungary reported also a dynamic trade performance with
exports and imports up by more than 10%.
3.Commercial services trade
Stimulated by the high level of global economic activity, world trade in commercial
services is estimated to have expanded by 5% (to $1.4 trillion US dollars) in 2000, the
fastest annual growth since 1997. For the second year in a row, the value of commercial
services trade expanded less than merchandise trade, but for the 1990-2000 period its 6%
annual growth matched that of merchandise trade. Prices for internationally traded
Table II.3
Leading exporters and importers in world merchandise trade, 2000
(Billion dollars and percentage)
Exporters Value Share
Annual percentage change
Importers Value Share
Annual percentage change
1990-2000 1999 2000 1990-2000 1999 2000
United States 782.4 12.3 7 2 12 United States 1258.0 18.9 9 12 19
Germany 551.6 8.7 3 0 1 Germany 500.1 7.5 3 1 5
Japan 479.3 7.5 5 8 14 Japan 379.5 5.7 5 11 22
France 298.1 4.7 3 -1 -1 United Kingdom 331.7 5.0 4 2 4
United Kingdom 280.1 4.4 4 -1 4 France 305.4 4.6 3 1 4
Canada 277.2 4.4 8 11 16 Canada 249.1 3.7 7 7 13
China 249.2 3.9 15 6 28 Italy 233.3 3.5 3 1 6
Italy 234.6 3.7 3 -4 -1 China 225.1 3.4 15 18 36
Netherlands 211.7 3.3 5 0 5 Hong Kong, China 214.2 3.2 10 -3 19
Hong Kong, China 202.4 3.2 9 0 16 retained imports
a
35.4 0.5 1 -21 24
domestic exports 23.7 0.4 -2 -9 6 Netherlands 197.0 3.0 5 2 3
Belgium 184.1 2.9 - -1 3 Mexico 182.6 2.7 15 14 23
Korea, Rep. of 172.6 2.7 10 9 19 Belgium 171.2 2.6 - 0 4
Mexico 166.4 2.6 15 16 22 Korea, Rep. of 160.5 2.4 9 28 34
Chinese Taipei 148.4 2.3 8 10 22 Spain 153.5 2.3 6 12 3
Singapore 138.0 2.2 10 4 20 Chinese Taipei 140.0 2.1 10 6 26
domestic exports 78.9 1.2 9 8 15 Singapore 134.7 2.0 8 9 21
Spain 113.7 1.8 7 3 2 retained imports
a
75.6 1.1 6 18 16
Russian Fed. 105.2 1.7 - 1 39 Switzerland 82.5 1.2 2 0 3
Malaysia 98.2 1.5 13 15 16 Malaysia 82.2 1.2 11 11 27
Sweden 86.7 1.4 4 0 2 Sweden 72.6 1.1 3 0 6
Saudi Arabia 84.1 1.3 7 31 66 Australia 71.3 1.1 5 7 3
Switzerland 80.5 1.3 2 2 0 Austria 68.8 1.0 3 2 -1
Ireland 77.1 1.2 13 11 8 Thailand 62.0 0.9 6 17 23
Thailand 68.9 1.1 12 7 18 Brazil 58.6 0.9 10 -15 13
Austria 64.9 1.0 5 3 1 Turkey 54.0 0.8 9 -11 33
Australia 63.9 1.0 5 0 14 Ireland 50.2 0.8 9 5 7
Indonesia 62.0 1.0 9 0 27 India 49.8 0.7 8 4 11
Norway 58.1 0.9 5 13 29 Poland 49.3 0.7 16 -2 7
Brazil 55.1 0.9 6 -6 15 Denmark 44.6 0.7 3 -3 0
Denmark 49.2 0.8 3 3 -1 Russian Fed. 44.2 0.7 - -32 12
Finland 45.5 0.7 6 -3 9 Israel 38.1 0.6 9 13 15
Total of above
b
5489.4 86.3 - - - Total of above
b
5664.3 85.0 - - -
World
b
6358.0 100.0 6 4 12 World
b
6662.0 100.0 6 4 13
a
Retained imports are defined as imports less re-exports.
b
Includes significant re-exports or imports for re-export.
commercial services are scarce, but the limited information available points to a stagnation
or even moderate decrease. The decline of the euro vis-à-visthe dollar has most likely more
than offset higher prices in the transportation sector.
Almost all regions reported an acceleration of their commercial services exports and
imports, with the notable exception of Western Europe. The decline in Western Europe’s
commercial services exports and imports is largely due to the impact of the depreciation of
the euro. Expressed in euros, Western Europe’s commercial services exports and imports
expanded by 13.5 and 14.5%, respectively, which indicates an acceleration in both nominal
and real terms given the moderate rates of inflation prevailing in Western Europe. As
Western Europe accounts for 44% in world exports of commercial services, its lacklustre
performance in dollar terms slowed down considerably the expansion in the value of world
trade in 2000 (Table II.4).
15
9
The exception being Denmark for which
provisional official data on international
transport services point to a large increase in
total services trade.
Exports Imports
Value Annual percentage change Value Annual percentage change
2000 1990-2000 1998 1999 2000 2000 1990-2000 1998 1999 2000
World 1415 6 1 1 5 1400 6 2 2 5
North America 311 7 2 5 10 241 7 8 4 13
United States 274 8 2 4 10 199 7 10 4 14
Latin America 60 7 7 0 12 72 8 4 -5 13
Mexico 13 6 6 -3 15 16 5 7 10 18
Other Latin America 47 8 7 1 11 56 8 4 -9 12
Western Europe 629 4 7 0 -2 601 4 9 1 -1
EU (15) 560 4 7 1 -3 556 5 9 1 -1
Transition economies 48 9 1 -14 7 49 7 -2 -9 12
Africa 30 5 -1 10 38 4 0 -3
Middle East 33 7 4 9 43 3 -12 5
Asia 304 9 -13 4 13 359 7 -11 5 7
Japan 68 5 -9 -2 13 115 3 -9 3 1
China 30 18 -3 -1 25 35 24 -5 16 14
Hong Kong, China 43 9 -6 4 14 24 8 1 -1 3
Asia (5)
a
66 10 -22 0 7 85 11 -25 4 15
a
Indonesia, the Republic of Korea, Malaysia, Philippines and Thailand.
Table II.4
Growth in the value of world trade in commercial services by region, 1990-2000
(Billion dollars and percentage)
North America and Latin America recorded double-digit export and import growth in
services in 2000. In both cases, imports expanded somewhat faster than exports thereby
reducing the North American surplus and widening the Latin American deficit in commercial
services trade. United States commercial services which account for almost one fifth of world
commercial services exports showed particular strength in travel receipts. United States
commercial services imports recorded in 2000 their most robust growth since 1990, with
imports of transportation services being the most dynamic sector for the second year in a
row. Asian exports of commercial services rose by 13%, boosted by the marked acceleration
of services growth by Asia’s three leading exporters: Japan; Hong Kong, China and China.
The near stagnation of Japan’s services imports – which accounts for one third of Asian
regional total – was the principal factor in the subdued expansion of Asia’s commercial
services imports. Japan’s expenditure on travel, construction, financial and communications
services slowed not only last year but over the last three years, limiting its total commercial
services imports in 2000 to a level 10% below the 1996 peak level.
Stronger price pressures in transportation than in other services categories are believed to
be one of the factors contributing to the untypically uniform expansion of commercial
services across major categories. Exports of transportation services expanded on par with
that of travel and “other commercial services”, at about 4.5% in 2000, while for the last
decade exports of transportation services expanded by only half the 8% rate recorded for
the category “other commercial services” comprising, among others, financial,
communication, construction, computer services and licence fees.
Provisional country data on commercial services trade by country show that the West
European countries recorded, in general, a stagnation or even a decrease in exports and
imports.
9
Commercial services exports of the United States and Japan rose by 10 and 13%,
16
respectively, at a rate not only well above that of the preceding year but also much stronger
than over the last decade. Japan’s stagnating services imports contrast with its dynamic
export growth. United States imports of commercial services expanded almost three times
faster than the global average in 2000, lifting its share to a record 14.2% of world
commercial services imports. Asian developing countries with double-digit export and import
increases include China, the Republic of Korea, Singapore and Chinese Taipei. Mexico and
Israel had export and import increases between 15 and 30% (Table II.5).
Throughout the 1990-2000 period, amongst he leading traders in commercial services
the most dynamic with exports and imports growing at double-digit rates were China, the
Republic of Korea, India, Ireland and Malaysia.
Table II.5
Leading exporters and importers in world trade in commercial services, 2000
(Billion dollars and percentage)
Exporters Value Share
Annual percentage change
Importers Value Share
Annual percentage change
1990-2000 1999 2000 1990-2000 1999 2000
United States 274.0 19.3 8 4 10 United States 199.3 14.2 7 4 14
United Kingdom 100.1 7.1 7 3 -3 Germany 125.7 9.0 5 3 -5
France 77.3 5.5 2 -1 -7 Japan 115.1 8.2 3 3 1
Germany 75.1 5.3 4 0 -5 United Kingdom 82.3 5.9 6 6 0
Japan 68.0 4.8 5 -2 13 France 57.1 4.1 1 -4 -10
Italy 59.0 4.2 2 -9 -3 Italy 57.1 4.1 2 -9 0
Spain 52.1 3.7 7 8 -2 Netherlands 50.1 3.6 6 4 0
Netherlands 50.6 3.6 6 4 -4 Canada 41.8 3.0 4 3 9
Hong Kong, China 43.3 3.1 9 4 14
Belgium-Luxembourg
38.7 2.8 5 6 7
Belgium-Luxembourg
40.2 2.8 5 6 4 China 34.8 2.5 24 16 14
Canada 37.2 2.6 7 6 9 Korea, Rep. of 33.7 2.4 13 11 26
China 29.7 2.1 18 -1 25 Spain 30.0 2.1 7 11 0
Korea, Rep. of 29.2 2.1 12 4 13 Austria 28.4 2.0 7 2 2
Austria 27.9 2.0 2 3 -7 Ireland 27.1 1.9 18 -12 4
Singapore 26.6 1.9 8 25 13 Chinese Taipei 25.7 1.8 6 0 10
Switzerland 26.5 1.9 4 2 1 Hong Kong, China 24.0 1.7 8 -1 3
Denmark 20.3 1.4 5 10 21 Sweden 23.2 1.7 3 4 3
Chinese Taipei 20.2 1.4 11 3 18 Singapore 21.3 1.5 10 8 13
Sweden 19.3 1.4 4 11 -2 Denmark 18.3 1.3 6 -3 19
Turkey 19.1 1.3 9 -30 18 India 17.9 1.3 12 21 4
Australia 18.0 1.3 6 7 6 Australia 17.8 1.3 3 7 -1
India 16.4 1.2 14 26 18 Russian Fed. 16.9 1.2 - -21 31
Norway 15.2 1.1 2 0 9 Mexico 16.4 1.2 5 10 18
Ireland 14.5 1.0 16 -12 0 Brazil 16.0 1.1 9 -14 17
Malaysia 13.5 0.9 14 4 14 Norway 15.6 1.1 2 5 -2
Mexico 13.4 0.9 6 -3 15 Malaysia 15.5 1.1 11 13 6
Israel 13.3 0.9 11 13 30 Switzerland 15.4 1.1 3 5 -2
Thailand 12.9 0.9 7 11 Indonesia 14.3 1.0 9 -4 27
Greece 9.8 0.7 4 0 Thailand 13.4 1.0 8 13
Egypt 9.6 0.7 7 18 3 Israel 12.4 0.9 10 11 16
Total of above 1232.0 87.0 - - - Total of above 1205.0 86.0 - - -
World 1415.0 100.0 6 1 5 World 1400.0 100.0 6 2 5
4.Oil markets and international trade
One of the outstanding features of international trade in recent years has been the high
volatility of oil prices. Following the steep decline of oil prices in 1998, prices recovered
strongly and averaged in 2000 $28 per barrel, a level two times that of the trough in 1998.
As a consequence of these sharp price variations, the share of fuels in world merchandise
exports dropped to 6.5% in 1998, the lowest share in three decades, before recovering to
10.5% in 2000, matching the highest share in the last 12 years. In other words, within three
years oil prices recorded their highest and lowest levels in 15 years. While the oil price
recovery in 1999 can be attributed to the coordinated cutback of oil production, the reasons
for the further price increase in 2000 cannot be found in the basic market conditions, as
production increased faster than demand. Some observers have attributed the price
turbulences in oil markets to overreaction of consumers in the form of advanced purchases
and to imbalances in the oil future markets. Consumer reaction was partly provoked by
considerably overstated oil demand projections at the beginning of the year, made under the
influence of the prospects of strong global output growth. Consumer fears in respect to
physical availability might have also been affected by the successfully coordinated stop and
go in oil supply by the oil producing countries and the realization that the share of OPEC
countries in world crude oil output has increased again considerably.
10
Large imbalances in
the forward markets for crude oil have also contributed to the strengthening of spot prices.
11
The high oil prices in the range of $24 to $34 per barrel in 2000 also contrast sharply with
the prices in recent medium-term projections. These price assumptions seemed reasonable
given that the real price of oil remained in a narrow range of $15 to $20 throughout the
1986-97 period and showed even a moderate declining trend for the 1990-97 period.
Various energy market indicators supported the expectation of low oil prices in the medium
term. First, the share of oil in world energy consumption was markedly reduced from the
peak level in the early 1980s. Natural gas, coal and nuclear power increased their shares in
world energy production, although oil has remained the principal fuel, accounting for about
40% of total energy output in recent years. Second, several regions curtailed the share of
imported oil in their energy consumption by expanding domestic energy production. Third,
technological innovations had lowered the costs of finding and extracting oil.
In addition, developments outside the energy markets – in particular the change in the
global output to less material and energy intensive services sector promised to reduce the
importance of energy to the future global economic growth. The spectacular rise of the
information and telecommunications sector in recent years was expected to accelerate this
trend. Consequently, public debates on energy focused more on the environmental
consequences of the steady rise in global energy consumption, in particular the impact of
CO
2
emissions on global warming.
Oil accounts for about 80% of international trade in fuels, roughly twice the share of oil
in world primary energy consumption. Relative low transportation costs and limited up front
investment in infrastructure contribute to the greater dominance of oil over other fuels in
trade relative to production. Nevertheless, the share of gas did increase over the last
15 years while that of oil and coal decreased somewhat. In the second half of the 1990s,
Asia replaced Western Europe as the largest net-importing region. This development can be
largely attributed to the buoyant rise of fuels imports into the fast growing developing Asia.
The share of the Asian developing countries’ netimports in world trade of fuels rose from
less than 2 in 1990 to nearly 7% in 1999.
About 30 countries can be considered as significant fuel exporters, of which about two
thirds are developing countries. In 1999, fuels exports accounted for more than two thirds of
17
10
Since 1985 the share of OPEC countries in
world crude oil output recovered from 30 to
42% in 1998.
11
Throughout 2000 the open call options
exceeded the open put options, reflecting the
traders expectations of falling prices also
reflected by the fact that the future prices for
12 months ahead remained below the spot
crude oil prices. As prices remained high, the
holders of put options were forced at the end
of the contract to purchase oil and
paradoxically support oil prices in the spot
markets.
Chart II.5
Fuels: share in world trade and real oil price, 1970-2000
(Percentage and dollars per barrel at constant 1990 prices)
a
0
10
20
30
40
50
197072 74 76 78 80 82 84 86 88 90 92 94 96 98 2000
50
40
30
20
10
a Real oil prices are obtained by deflating the nominal oil price by the world export unit value index of manufactures.
Source:
WTO Secretariat.
Share (left scale)
Real oil prices (right scale)
Dollars
per barrel
Share
18
12
The regional economic growth rates are
adjusted to WTO definitions and based on IMF
projections.
merchandise exports in at least 14 countries and another 8 countries recorded a
corresponding share between one third and 60%. While the developing countries (and also
the LDCs) are – as a group – net fuel exporters, the majority of the developing countries are
net importers.
According to the World Energy Outlook 2000 of the IEA, the following trends will be
observed in international trade of fuels in the coming ten years. First, the share of imported
oil in oil and total energy consumption is likely to increase in the major net-importing
regions (Asia – in particular China and India, Western Europe and North America). Second,
the increased supplies will come largely from the traditional oil suppliers, in particular the
Middle East. The most dynamic trade growth will be seen between the Middle East and Asia
(as in the 1990s). Third, trade in gas will expand strongly, in particular in Europe and Asia.
Gas exports from Russia to Western Europe and intra-West European trade contribute to the
rise in Europe. Liquified natural gas imports from the Middle East will rise sharply. Fourth,
world trade in coal is unlikely to expand rapidly. Asia’s coal imports are expected to increase
while those of Western Europe are expected to decrease. Fifth, cross-border and intra-
regional trade in electricity is likely to increase substantially largely due to the liberalization
of the various national markets in the EU and the integration of European grids.
5.Outlook
In 2001, the world economy is retreating from the high growth path seen last year. All
major geographic regions will be affected with the exception, perhaps, of Africa which
recorded the weakest growth of all the regions in 2000. North America, the transition
economies and developing East Asia – other than China – are projected to experience a
sharp deceleration in GDP in 2001. Japan’s fragile economy is not expected to recover.
Growth rates in Western Europe and Latin America are expected to slow by about one half
of 1%.
12
While there is a broad consensus about a general slowing of economic growth –
reflected not only in revisions of national forecasts, but also by actions undertaken by
governments and, above all, by national monetary authorities – uncertainty remains about
the severity and form that the deceleration will take. The development of the United States
economy is considered to be the key element not only because of its weight in the global
output and trade but also due to its leadership in the “new economy”. The current
slowdown will therefore also be a test for the “new economy” which was one of the
principal driving forces in the expansion, not only of the United States economy and other
advanced economies, but also of international trade. The strength of United States
investment over the last five years stemmed largely from the expenditure on information
technology equipment and software not only in the “new economy” but also in the “old
economy”. The sharp correction of technology stock markets world wide since March 2000
have shattered the belief that the internet economy would be “business cycle proof”. A
cyclical cutback of IT-related investment expenditure could be quite significant and have
marked repercussions given the increased importance the IT sector has gained throughout
the 1990s in output, employment and trade. A related issue concerns the productivity rates
observed in recent years in the United States. It has still to be seen how permanent these
economy-wide productivity gains, which have been attributed to the advances in information
technology, will prove to be.
The rise of the “new economy” underpinned not only the expansion of the United States
economy and stock markets but also international capital flows (in particular FDI) and many
stock markets around the globe. The sharp correction in world stock markets indicates that
the perceptions on the near term outlook for the information technology sector has become
rather sober. In addition, the lower valuations of stocks have repercussions not only on
business investment but also on the consumer confidence, private wealth and in the end on
consumer expenditure.
A slowdown in the United States reduces its import growth, which will directly affect the
exports of those 20 countries for which exports to the United States market account for
more than one third of their merchandise exports. Canada and Mexico are particularly
concerned as their exports to the United States exceed 85% of their total merchandise
exports, but many countries in Central America and the Caribbean, as well as in Asia, also
rely heavily on the United States markets. With respect to product categories, the share of
United States imports in world trade is particularly important for office and telecom
equipment, automobiles and clothing.
The prospects for world trade in 2001 clearly have become more clouded in recent
months. The deceleration of global trade growth has set in during the final months of 2000
and is expected to continue for most of 2001. For the year 2001, the volume of world
merchandise trade is expected to grow by 7%, a marked reduction from the estimated rate
of 12% in 2000. A major uncertainty in the outlook is the economic activity and trade
growth in Western Europe. As Western Europe accounts for about 40% of world trade, a
stronger resistance to the United States slowdown than is projected could mean the world
trade would expand in 2001 by more than the 7% currently forecast. Downward risks are
primarily seen in the repercussions of severe stock market corrections on investment and
consumer expenditure in advanced economies.
19
20
Appendix Table 1
Leading exporters and importers in world merchandise trade (excluding intra-EU trade), 2000
(Billion dollars and percentage)
Exporters Value Share
Annual percentage change
Importers Value Share
Annual percentage change
1990-2000 1999 2000 1990-2000 1999 2000
European Union (15) 855.4 17.2 5 -2 8 United States 1258.0 23.9 9 12 19
United States 782.4 15.7 7 2 12
European Union (15)
959.2 18.2 5 4 13
Japan 479.3 9.6 5 8 14 Japan 379.5 7.2 5 11 22
Canada 277.2 5.6 8 11 16 Canada 249.1 4.7 7 7 13
China 249.2 5.0 15 6 28 China 225.1 4.3 15 18 36
Hong Kong, China 202.4 4.1 9 0 16
Hong Kong, China
214.2 4.1 10 -3 19
domestic exports 23.7 0.5 -2 -9 6
retained imports
a
35.4 0.7 1 -21 24
Korea, Rep. of 172.6 3.5 10 9 19 Mexico 182.6 3.5 15 14 23
Mexico 166.4 3.3 15 16 22 Korea, Rep. of 160.5 3.0 9 28 34
Chinese Taipei 148.4 3.0 8 10 22 Chinese Taipei 140.0 2.7 10 6 26
Singapore 138.0 2.8 10 4 20 Singapore 134.7 2.6 8 9 21
domestic exports 78.9 1.6 9 8 15
retained imports
a
75.6 1.4 6 18 16
Russian Fed. 105.2 2.1 - 1 39 Switzerland 82.5 1.6 2 0 3
Malaysia 98.2 2.0 13 15 16 Malaysia 82.2 1.6 11 11 27
Saudi Arabia 84.1 1.7 7 31 66 Australia 71.3 1.4 5 7 3
Switzerland 80.5 1.6 2 2 0 Thailand 62.0 1.2 6 17 23
Thailand 68.9 1.4 12 7 18 Brazil 58.6 1.1 10 -15 13
Australia 63.9 1.3 5 0 14 Turkey 54.0 1.0 9 -11 33
Indonesia 62.0 1.2 9 0 27 India 49.8 0.9 8 4 11
Norway 58.1 1.2 5 13 29 Poland 49.3 0.9 16 -2 7
Brazil 55.1 1.1 6 -6 15 Russian Fed. 44.2 0.8 - -32 12
India 42.4 0.9 9 9 17 Israel 38.1 0.7 9 13 15
Philippines 40.0 0.8 17 24 9 Philippines 34.6 0.7 10 3 6
United Arab Emirates
39.9 0.8 7 15 29
United Arab Emirates
34.3 0.7 12 6 6
Venezuela 32.8 0.7 6 15 65 Norway 33.8 0.6 2 -6 -1
Poland 31.6 0.6 8 -3 15 Indonesia 33.5 0.6 4 -12 40
Israel 31.3 0.6 10 12 21 Saudi Arabia 32.8 0.6 3 -7 17
Iran, Islamic Rep. of
30.2 0.6 6 32 74 Czech Rep.
b
32.2 0.6 - 0 15
South Africa 30.0 0.6 3 1 12 Hungary 32.1 0.6 12 9 15
Czech Rep. 29.0 0.6 - 2 10 South Africa 29.7 0.6 5 -9 11
Hungary 28.1 0.6 11 9 12 Argentina 25.5 0.5 20 -19 0
Turkey 27.3 0.5 8 -1 3 Chile 18.1 0.3 9 -19 20
Total of above
c
4509.9 90.7 - - - Total of above
c
4801.7 91.0 - - -
World (excl. intra World (excl. intra
EU trade)
c
4974.0 100.0 7 5 17 EU trade)
c
5275.0 100.0 7 5 17
a
Retained imports are defined as imports less re-exports.
b
Imports are valued f.o.b.
c
Includes significant re-exports or imports for re-export.
Chapter Three
O
VERVIEW
OFDEVELOPMENTS
INTHEINTERNATIONAL
TRADINGENVIRONMENT
1
Including flows between Member States of the
European Union.
22
For the WTO, the year 2000 was one of stiff challenge and significant opportunity. Stiff
challenge due to the events that took place at the Third Ministerial Conference in November
1999 – the failure of the WTO Members to reach a consensus on the launch of a new round
of multilateral negotiations, against a background of highly-publicized “anti-globalization”
demonstrations in the streets of Seattle – but significant opportunity to effect the changes
necessary to better meet the needs of the WTO Members and thereby strengthen the
foundations of the trading system.
The inability of WTO Members to reach a consensus at Seattle on the launch of a new
round was a reflection of significant differences of view, in spite of preparatory work
throughout 1999. One major difference of view concerned whether the launch of a new
round was propitious given the ongoing implementation of commitments assumed in
consequence of the Uruguay Round, which gave rise to problems or concerns for certain
developing country and transition economy Members. Even among the WTO Members that
were supportive of the launch of a new round, major differences of view were evident on
the scope of the agenda for the negotiations, beyond those on agriculture and services
which were called for in the respective Uruguay Round agreements. There were also
differences of view on the negotiations on agriculture and services. In the course of the
Ministerial Conference, questions of process also came to the fore as a number of
developing countries claimed insufficient participation in the proceedings.
In 2000, the WTO addressed these issues by:
-starting on schedule the mandated negotiations on agriculture and services, and
continuing to explore, at the political and technical levels, the possibility of reaching a consensus
on a negotiating agenda for a new round beyond that built-in to the Uruguay Round;
-establishing a mechanism to consider implementation-related issues and concerns;
-finding ways to ensure the fuller participation of all Members in the work of the WTO
and to improve consultative procedures;
-improving external transparency and outreach to civil society; and
-giving priority to the integration of LDCs and other low-income WTO Members into the
multilateral trading system to help them secure the benefits that can be derived therefrom.
Although the aftermath of Seattle was the outstanding trade policy event of 2000 in the
life of the WTO, its manifestation was mainly at the political level since the business of the
organization continued as usual. WTO Members maintained a busy schedule of regular
meetings of Councils, bodies and working groups on matters within its mandate (ChapterIV).
Dispute settlement showed, in particular, a high level of activity; although most disputes were
satisfactorily resolved, recourse to retaliation increased in 2000. In addition to assisting the
WTO Members in their activities, the Secretariat increased its provision of technical assistance
to WTO Members, as well as adding to its programme of outreach to civil society.
The WTO gained five new members in 2000 – Albania, Croatia, Georgia, Jordan and Oman
– to reach a total membership of 140, accounting for more than 90% of world merchandise
trade
1
, and Lithuania and Moldova were poised to accede. Significant traders that were still
outside the multilateral trading system, but in the process of accession to the WTO, were
China, Chinese Taipei, the Russian Federation, and Saudi Arabia, and another 23 accession
negotiations are engaged. China made considerable progress in 2000 to reach the final
stages of its accession negotiations by concluding bilateral market-opening agreements with
most interested WTO Members (only the bilateral with Mexico remains outstanding), still
leaving the technical matters of implementing certain multilateral commitments (notably
agriculture and trade defence measures) on the agenda of China’s working party.
While the situation of the WTO is generally satisfactory, a number of challenges lie ahead
for the organization. The expansion of the world economy was sustained in 2000 and was
broadly based across all regions, but the slowdown of economic activity in the United States
will have an impact on global output and trade trends in 2001. According to the IMF, the
world economic outlook is subject to greater downside risks. This should bring into sharper
relief the gains to be realized by consumers, producers and the environment from removing
the significant impediments to open markets that remain in place in virtually all Members.
Another key priority on the international agenda is helping LDCs up the development
ladder. This challenge is engaging the governments of LDCs, supported by the World Bank
and the IMF, as well as other governments, NGOs and citizens. The WTO also has a role to
Overview of developments in the international trading
environment
A.Introduction
play. Experience has shown that development is fostered in a domestic environment of
macroeconomic stability and market-friendly reforms, complemented by institution-building
that fosters developmental capacity and good governance, including more open and
transparent regimes for trade and trade-related policies. Countries poor in human and
financial resources, or lacking the requisite experience in administering or enforcing WTO
obligations, have asked for assistance in understanding their commitments and
implementing them domestically. Technical assistance activities are important in this regard,
but the ability of the WTO to respond is limited and sustained only by the generous extra-
budgetary donations of certain WTO Members. Increased funding for technical assistance in
the core budget of the WTO would create a more permanent basis for such activities, but
agreement of all WTO Members on this action has not yet been reached.
WTO Members have the opportunity to do more for LDCs. The Plan of Action for LDCs
launched at Singapore in 1996 gave priority to improvements in market access to remove
external obstacles to development, and led to the Integrated Framework for technical
assistance related to trade development. Since that time, a number of WTO Members have
improved the market access for LDCs through preferential programmes, and further actions
could be taken to achieve the goal of tariff-free and quota-free access for all trade of LDCs.
And, following a review of its operation, the Integrated Framework is to be improved as a
mechanism for the six participating agencies – the ITC, IMF, UNCTAD, UNDP, World Bank and
WTO – to deliver trade-related technical assistance to LDCs. Donor support is now needed.
As the WTO initiative on LDCs falls into place, its effects will reinforce others taken in 2000
to ease the plight of Africa, home to most LDCs, such as debt reduction to liberate domestic
resources to build human capital and alleviate poverty. These actions, taken together, will
help LDCs establish the basis for sustainable development and reverse their increasing
marginalization in the world economy.
WTO Members are rightly concerned by the misunderstandings of the public over
globalization and the role of the organization in this process. The anti-globalization protests
in Seattle were the most extreme manifestation of these misunderstandings, re-staged for
UNCTAD X in Bangkok in February, for the meetings of the World Bank and IMF in
Washington in April and in Prague in September, and for other high-profile gatherings. The
target is not the WTO per se, but all institutions, political parties or even individuals that
promote or support or do not openly condemn the policies considered to advance the
process of globalization.
Democratic societies legitimize and indeed encourage dialogue between citizens and
representatives on all topics of concern. Adjustment to globalization is a valid element of this
dialogue, while recalling that openness to trade is associated with growth and reduced
poverty over time. Within its mandate to help move trade flows as smoothly, predictably and
freely as possible, the WTO can assist the efforts of member governments to dialogue with
citizens by highlighting the benefits of open markets and trade rules. Understanding of the
WTO could be further enhanced through greater transparency in the day-to-day activities of
the organization. The Secretariat has already made considerable efforts in this regard within
the guidelines laid down by the Members in 1996.
This broad overview of the situation of the WTO, on which details are provided in the
body of this and other chapters of this Annual Report, points to the following key challenges
for the period ahead:
-addressing the issues and concerns on implementation;
-maintaining the momentum of liberalization through the mandated negotiations and
guarding against increased barriers to trade;
-ensuring the full participation of all Members in the WTO, notably the LDCs and other
low-income WTO Members;
-more effectively communicating to the general public the nature and activities of the
WTO and the benefits of the multilateral trading system; and
-considering the question of a broader negotiating agenda.
23
2
Work is ongoing on the negotiations to be
undertaken in the TRIPS Council under Article
23:4 of the TRIPS Agreement concerning the
establishment of a multilateral notification and
registration system for wines.
B.Developments in the multilateral trading system
1.Mandated negotiations begin and discussions on a new
round continue
The mandated negotiations on agriculture and services started on schedule in early 2000.
2
The negotiations under Article 20 of the Agreement on Agriculture are to continue the reform
process set out in the agreement, which brought into the multilateral rules, largely for the first
time, the policy instruments used by many WTO Members to support domestic agricultural