a new dataset in the making
Bạn đang xem bản rút gọn của tài liệu. Xem và tải ngay bản đầy đủ của tài liệu tại đây (426.02 KB, 47 trang )
1
Staff Working Paper ERSD-2011-10 Date: 16 June 2011
World Trade Organization
Economic Research and Statistics Division
The Design of Preferential Trade Agreements:
A New Dataset in the Making
Leonardo Baccini,
IMT Lucca
Andreas Dür
University of Salzburg
Manfred Elsig
University of Bern
Karolina Milewicz
Universities of Bern & Lucerne
Manuscript date: June 2011
Disclaimer: This is a working paper, and hence it represents research in progress. This paper
represents the opinions of the authors, and is the product of professional research. It is not
meant to represent the position or opinions of the WTO or its Members, nor the official
position of any staff members. Any errors are the fault of the authors. Copies of working
papers can be requested from the divisional secretariat by writing to: Economic Research and
Statistics Division, World Trade Organization, Rue de Lausanne 154, CH 1211 Geneva 21,
Switzerland. Please request papers by number and title.
2
The Design of Preferential Trade Agreements: A New
Dataset in the Making
Leonardo Baccini, IMT Lucca
Andreas Dür, University of Salzburg
Manfred Elsig, University of Bern
Karolina Milewicz, Universities of Bern & Lucerne
Abstract
1
Since 1990 the number of preferential trade agreements (PTAs) has increased very rapidly.
This paper aims to contribute to this literature by presenting a new database on PTAs called
Design of Trade Agreements (DESTA). We identified a total of 690 negotiated trade
agreements between 1945 and 2009 of which we have coded 404 agreements for which treaty
texts and appendices were available. We aim to have a database for about 550 agreements by
2012. We have coded agreements for a total of 10 broad sectors of cooperation, encompassing
market access, services, investments, intellectual property rights, competition, public
procurement, standards, trade remedies, non-trade issues, and dispute settlement. For each of
these sectors, we have coded a significant number of items, meaning that we have about 100
data points for each agreement. The resulting DESTA database is – to the best of our
knowledge – by far the most complete in terms of agreements and sectors covered. This
dataset fills a crucial gap in the field by providing a fine-grain measurement of the design of
PTAs. Among others, we think that DESTA will be of relevance for the literatures on the
signing of PTAs; the legalization of international relations; the rational design of international
institutions; the diffusion of policies; the political and economic effects of trade agreements;
power relations between states; and forum shopping in international politics. This working
paper describes the DESTA data set and provides selected descriptive statistics. The overview
puts emphasis on variation in design over time and across regions.
Keywords: Preferential trade agreements
JEL Classification: F15
1
We acknowledge the support of NCCR Trade Regulation of the Swiss National Science Foundation
(www.nccr-trade.org). For research and coding assistance, we thank Johanna Bötscher, Martina Castro, Kristina
Hauser, Benjamin Hofmann, Theresa Kuhn, Salome Lang, Justin Leinaweaver, Julie Mandoyan, Martiño Rubal
Maseda, Claudia Meier, Irina, Mirkina, Katharina Niedermayer, Livio Raccuia, Maria Rubi, and Kathrin
Schwaller. We are grateful for comments and suggestions to Richard Baldwin, Roberto Echandi, Carsten Fink,
Andreas Lendle, Martin Malinuevo, James Melton, Joost Pauwelyn, Martin Roy, and Robert Teh.
3
Introduction
During the past twenty years, PTAs that liberalize trade between countries have proliferated.
Twenty new agreements were notified to the WTO in 2009 and thirteen in 2010. Every
member of the WTO (with the exception of Mongolia) is now a member of a PTA.
2
The
proliferation of PTAs shows no signs of slowing down in the near future. Many negotiations
are underway. Canada, for instance, is currently negotiating 12 PTAs.
3
The proliferation of
PTAs also is not limited to developed economies. On the contrary, many PTAs are concluded
between developing countries. The average African country belongs to four different
agreements, and the average Latin America country belongs to seven agreements. This
proliferation of PTAs has significantly altered the world trade regulatory landscape. Both
economic and political studies therefore have tried to identify the factors that explain this
rapid growth.
While research on PTAs is not short of theoretical arguments, there are still important
gaps in the collection of systematic data for the purpose of empirical testing. The objective of
this paper is to describe a new dataset on PTAs that will allow us to address a number of
empirical puzzles present in the literature on international cooperation and the design of
international agreements. In particular, the data could prove helpful to address research
questions on the formation of PTAs, the design of international agreements, and the impact of
PTAs on economic and political phenomena.
We have (so far) coded 404 agreements signed between 1945 and 2009. We have
coded these agreements for a total of 10 broad sectors of cooperation ranging from market
access to investments, services, intellectual property rights, competition, and dispute
settlement. Some of these sectors are divided into sub-sectors. We have used manual content
analysis and statistical techniques in order to check coders‟ reliability. To the best of our
knowledge, there is no other dataset that covers such a wide number of PTAs and that codes
such an extensive number of sectors.
The next section of this paper surveys previous attempts at coding PTAs. The third
section then outlines key scholarly debates that our data speak to. In the fourth section, we
map the population of PTAs since 1945. Section five then describes the coding scheme and
provides some graphical illustrations for selected factors coded. The final section provides
2
Soon all WTO members will participate in new regionalism as Mongolia is currently studying the feasibility of
a PTA with Japan and other states.
3
From the Foreign Affairs and International Trade Canada website: />agreements-accords-commerciaux/agr-acc/index.aspx.
4
some information as to planning and process of coding and focuses on the reliability of our
exercise.
Previous attempts at mapping PTA design
In political science, precedents of coding legal and political texts abound. Without the
ambition of providing a complete list, we identify four large coding projects that are
tangential to our work. First, there are several important attempts to measure ideological
position of parties by coding their manifestos. These attempts are implemented by using both
manual coding (Budge et al. 2001; Klingemann et al. 2006) and software (Benoit and Laver
2006; Slapin and Proksch 2008; Lowe et al. 2011). Second, in the 1990s several competing
studies have tried to come up with a reliable measure of central bank independence (Alesina
1988, 1989; Grilli et al. 1991; Eijffinger and Schaling 1992, 1993; Cukierman et al. 1994).
Third, Elkins et al. (2009) have manually coded all the constitutions signed between 1789 and
now.
4
Finally, Koremenos (2005, 2007) codes a large number of international treaties looking
at 375 provisions. This impressive study was carried out using manual coding. In sum, these
previous exercises have sharpened the discipline‟s attention to questions of reliability and
show the importance of gathering data from legal and political texts.
PTA coding is far from new. There exist several studies that have coded (parts of)
PTAs. These previous studies have not only helped us draw up our coding scheme, but also
allow us to check the reliability and validity of our results. The most comprehensive attempt
so far is Estevadeordal et al. (2009). The contributors to that volume coded around 50
agreements, with some variation across chapters. Many studies either limit themselves to a
small number of agreements (often from one region or signed by a few actors) or to a specific
sector. Table 1 provides an overview of a number of coding exercises.
4
5
Table 1: Previous research on the contents of PTAs
Study
Agreements coded
Sectors coded
Level of detail
Estevadeordal et al. 2009
Around 50 PTAs, with some
variation across chapters
Market access, trade
remedies, technical barriers
to trade, services,
investments, competition
Very detailed. For example,
the coding of investment
provisions comprises a total
of 30 items
Estevadeordal & Suominen
2007
12,247 international
agreement (including PTAs
and BITs)
23 domains under seven
broad categories
Fink & Molinuevo 2008
25 East Asian agreements
with a services component
Services
154 services subsectors
across four modes of supply
Haftel 2010
25 agreements
Scope, implementation,
institutional independence,
corporate bureaucracy,
dispute settlement, regional
institutionalization
Indicator that ranges
between 0 and 30
Heydon & Woolcock 2009
Series of agreements signed
by the US, EU, EFTA, Japan
and Singapore
All sectors
Differs, qualitative summary
Hicks & Kim 2009
57 agreements in Asia
Type, coverage (industry,
agriculture, nontariff
barriers, technical barriers to
trade), dispute settlement,
pace of liberalization
Considerable, especially for
dispute settlement and pace
of liberalization
Horn et al. 2009
28 EU and US agreements
Comprehensive
Presence or absence of
substantive provisions on
broad areas
Houde et al. 2007
20 deep agreements
Investments and services
Detailed
Kim 2010
8 US bilateral trade
agreements
Market access
Breadth, depth, and rate of
trade liberalization
Kono & Rickard 2010
All agreements notified to
the WTO
Procurement
Presence or absence of
substantive procurement
provisions
Kucik 2011
330 agreements (1960-2005)
Trade remedies
Measures of flexibility in
antidumping, countervailing
duties and safeguards
Lesher & Miroudot 2006
24 North-South agreements
Investments
25 investment provisions
Mansfield and Milner 2010
389 PTAs (1945-2005)
Investment clauses and
dispute settlement
Ordinal indicator
Mattoo & Sauvé 2007
App. 45 agreements
Services
MFN clause, national
treatment, market access,
coverage etc.
McCall Smith 2000
62 trade agreements signed
between 1957 and 1995
Dispute settlement
Along a scale with five
values
OECD 2002
App. 30, but varies across
chapters
Comprehensive
Detailed with respect to
services, qualitative
discussion for most other
sectors
Roy et al. 2007 (and
Marchetti & Roy 2009)
5
32 agreements with services
provisions
Services
Around 150 subsectors
across 2 modes of supply
UN Social and Economic
Commission for Asia and
the Pacific (2005-2010)
137 Asian and Pacific trade
agreements (including
framework agreements)
Comprehensive
Presence or absence of
major provisions
5
Some of the data are available at:
6
The theoretical backdrop to the project
The motivation to collect this data has been our belief that many strands of literature in
political science or economics would benefit from better data on the design of international
trade agreements. Among others, we think that our data will be of relevance for the following
bodies of literature:
The signing of PTAs
There is no shortage of explanations on why countries form PTAs. Regarding the economic
literature, the domino theory (Baldwin 1993) explains the proliferation of PTAs using a
political economy model that focuses on the cost - in terms of trade diversion - of being
excluded from PTAs. Furthermore, a more recent study emphasizes the role of economic size
and similarity among economies as important drivers in the formation of PTAs (Baier and
Bergstrand 2004). As regards the political science literature, there exist many different
explanations for why states sign PTAs, suggesting that states might aim to lock-in domestic
reforms, strengthen their position in multilateral negotiations, pursue import-substitution
policies at the regional level, address security concerns, or sign PTAs as a reaction to other
agreements (for an overview, see Ravenhill 2008). Recent studies investigate the role of
domestic institutions (Mansfield et al. 2002; 2008; Baccini 2011), interest groups (Mattli
1999; Chase 2005; Dür 2007), bureaucratic interests (Elsig 2007, Elsig and Dupont 2011) and
international shocks (Mansfield and Reinhardt 2003) in explaining the formation of PTAs.
The political science literature thus has the merit of showing that politics do matter in a state‟s
decision to establish a PTA. A major shortcoming of most previous research, however, has
been the failure to take account of important design variation across PTAs. Our dataset aims
to fill this gap in the field. For instance, it will provide the data to facilitate the further
exploration of what impact domestic institutions have upon the design of PTAs – in terms of
flexibility, for instance - and how interest groups‟ preferences affect the inclusion of specific
provisions in PTA treaties.
Legalization through international agreements
A growing body of literature has addressed the issue of legalization or judicialization
describing the range and variability of institutional forms in interstate relations (Stone Sweet
1999, Abbott et al. 2000). This strand of literature reflects the actual move in international
cooperation towards embracing more detailed and precise rules (degree of precision),
7
accepting more stringent commitments as well as compliance mechanisms (degree of
obligation), and agreeing on additional forms of rule enforcement (e.g., delegation to
international organizations and international courts). Some of the WTO agreements (e.g., the
Trade-Related Intellectual Property Rights Agreement) have served as prime examples of
highly legalized treaties (Abbott et al. 2000). More recently, legalization has been studied as
an explanatory variable analyzing how certain elements of legalization affect domestic
policies (Allee 2005) or compliance more generally (Guzman 2008, Zangl 2008). As regards
PTAs some work has been carried out on dispute settlement provisions (e.g., McCall Smith
2000). Yet, only little systematic research has been conducted on the variance in legalization
across PTAs and the dominating approaches to judicial forum choice.
The rational design of international institutions/agreements
Another research program that has emerged alongside legalization is the rational design
literature. A number of liberal scholars have postulated that design differences across
international agreements and/or institutions are not random and can not be explained by
simply drawing on realist arguments (Koremenos et al. 2001). The original contribution of the
rational design (RD) literature has been to conjecture a number of explanations to account for
particular design features of institutions and/or agreements (e.g., membership rules, scope of
issues covered, centralization of tasks, rules for controlling the institution, and flexibility of
arrangements). Key explanations in the RD tradition are drawn from game theory, in
particular cooperation problems that are characterized by distributional and enforcement
issues. Two additional explanatory factors are addressed: uncertainty and number of actors. In
particular, the latter should be an important factor accounting for different design features
through bilateral, regional or multilateral trade cooperation. While there exists some
systematic research on the design of bilateral investment treaties (Allee and Peinhardt 2010),
less attention has been paid to the design features of PTAs across regions and time. Finally,
some scholarship at the crossroad of the legalization and the rational design literature has
addressed the question of optimal institutional features that balance commitment and high
levels of delegation with necessities to allow for escape mechanisms or forms of “efficient
breach” (Goldstein and Martin 2000; Rosendorff and Milner 2001, Rosendorff 2005, Baccini
2009, Schropp 2010).
8
Diffusion
A large political science literature studies diffusion processes across borders. Among the
many policies, institutions, and events that spread across borders, previous studies have
looked at regulatory agencies (Jordana et al. 2011), international agreements (Elkins et al.
2006; Barthel and Neumayer 2010; Baccini and Dür 2011), tax policy (Swank 2006),
democracy (Gleditsch and Ward 2008) and conflicts (Buhaug and Gleditsch 2008). Data on
the design of PTAs will allow us to shed light on the conditions under which policies spread
across borders and the mechanisms through which policies spread (coercion, competition,
learning or emulation). Specific questions that can be addressed are: do provisions in PTAs
spread? If yes, in which sequence do different countries adopt these provisions? What does
this sequence tell us about the mechanism of diffusion?
Political and economic effects of trade agreements
The effects of PTAs on economic variables have been thoroughly studied by economists. A
vast body of literature explores the impact of PTAs on national and world welfare by looking
at the relative magnitude of trade creation and trade diversion (Viner 1950; Bhagwati 1993;
Krugman 1991; Summers 1991). Moreover, countless studies investigate the impact of trade
agreements on trade flows (Rose 2004; Goldstein et al. 2007) and foreign direct investment
(Büthe and Milner 2008) using a gravity model. Interestingly enough, the findings of these
studies often conflict with one another. We identify a poor operationalization of PTAs on the
right-hand side of the econometric equation as one of the main problems of such studies.
Looking at the content of PTAs would allow us to overcome some of these measurement
inconsistencies and provide a better understanding of the impact of PTAs on both trade flows
and FDI. Other recent studies explore the impact on political variables. Among these, some
studies (Pevehouse 2005; Pevehouse and Russet 2006) argue that certain IOs, including some
PTAs, increase the probability of democratization. Mansfield and Pevehouse (2000) show that
PTAs help countries to peacefully settle conflicts and mitigate the risk of such conflicts
escalating into full-blown war. Finally, others (Ethier 1998; Fernandez and Portes 1998) claim
that PTAs help developing countries to implement and lock in economic reforms. Future
studies could explore these arguments in more detail. Specifically, we could assess the impact
of PTAs on economic reforms looking at specific provisions – enforcement provisions, for
instance – in specific sectors, such as intellectual property rights. In addition, the design of
PTAs in combination with domestic institutions and leaders‟ preferences may shed new light
on why and when developing countries decide to implement economic reforms.
9
Power
How and when states exercise power in international politics is one of the key questions in the
field of International Relations (Baldwin 2002; Barnett and Duvall 2005). The design of PTAs
is indicative of power relations as preferences over the contents and institutional setup of such
agreements vary across states. In particular, developed countries are likely to prefer deeper
agreements than developing ones. To the extent that there is variation across North-South
agreements, this may be due to some developing countries having more power (issue specific
or structural) than others. Thus, the data will be useful in exploring to what degree and under
what conditions power asymmetry is reflected in the design of PTAs.
Forum shopping/overlapping regimes
Systematic analyses addressing the effects of overlapping regimes on the evolving politics of
forum-shopping are scant (Young 1996; Aggarwal 1998; Raustiala and Victor 2004; Alter and
Meunier 2007; Dupont and Elsig 2011). Drezner (2006) suggests that more powerful states
are better able to cope with overlapping jurisdictions and increased legalization. He argues
that (too much) legalization has empowered stronger states. This observation runs counter to
the conventional wisdom related to how legalization constrains the abuse of power (Grant and
Keohane 2005). Focusing on interaction across regimes, Shaffer and Pollack (2010) argue that
soft law regimes may be “hardened” through regime linkage, while hard law regimes may be
“softened”. Put differently, linking soft law regimes (other policy fields, bilateral economic
cooperation) with hard law regimes (WTO) may have important spill-over effects. Some
initial work on forum-shopping in the area of trade has focused on dispute settlement (Davis
2006, Busch 2007). Busch (2007) argues that forum shopping is not only about the likelihood
of the claimant‟s success, but is also about setting a precedent that is useful for case-law
development. Pauwelyn (2009) describes how the WTO and regional dispute settlement
mechanisms increasingly overlap, and offers rules on how to address sequencing and conflicts
arguing that the WTO cannot remain indifferent to forum exclusion clauses in PTAs. Yet,
there is little research on forum-shopping (Bernauer et al. 2011). Given the increasing number
of PTAs, we expect our data-set to be also useful in order to address questions emerging from
this research program.
10
Our sample of PTAs
Our objective has been to cover all negotiated trade agreements signed between 1945 and
2009 that include concrete steps, that is, potentially be covered by GATT Article XXIV, the
GATT Enabling Clause, or GATS Article 5, towards the preferential liberalization of trade in
goods or services.
6
By including “negotiated” in our definition, we exclude one-sided
preference schemes such as the Generalized System of Preferences. The term “concrete”
means that we did not consider agreements that only include vague provisions on objectives,
without specifying specific measures that will be carried out in a reasonable time frame. This
excludes framework agreements that often precede the conclusion of actual PTAs (for
example, the 2003 framework agreement between India and ASEAN) and partnership and
cooperation agreements (for example, EU-Ukraine 1998).
7
“Preferential” indicates that we
excluded agreements that extend steps to liberalize trade to third countries without asking for
reciprocity. Asia Pacific Economic Cooperation, for example, is a grouping that we do not
consider in this project. Moreover, we exclude agreements that simply extend most-favored
nation treatment to countries that are not members of the World Trade Organization. The
preferences can be one-sided as is the case for the European Union‟s Lomé agreements.
We used a variety of sources to identify the relevant trade agreements. Our main
sources were the list maintained by the World Trade Organization, the Tuck Trade
Agreements and McGill Faculty of Law Preferential Trade Agreements databases, and the list
collated by Gary Clyde Hufbauer.
8
After eliminating overlaps and some agreements that did
not fit our definition, and adding agreements especially from the Middle East, we ended up
with a database of 690 agreements.
9
So far, we have been able to code 404 of these
6
Importantly, we do not consider agreements that touch upon “trade and” issues such as competition policy or
movement of natural persons unless the same agreement also includes provisions that are directly aimed at
enhancing market access for goods and/or services. This excludes some very far-reaching agreements, such as
EU-Switzerland Bilateral Agreements II, which cover everything from taxation to free movement of persons.
7
We decided to include a few borderline agreements such as the Community of Sahel-Saharan States (CEN-
SAD), the Bay of Bengal Initiative for Multi-Sectoral Technical and Economic Cooperation, and the Protocol on
Trade Negotiations.
8
These databases are available at
and We also relied on other webpages, such as
www.bilaterals.org and to get a full list of agreements signed more
recently. For the Hufbauer list, see Hufbauer 2007.
9
To compare, as of October 2010 the WTO list of agreements, including those signed but not yet in force,
encompasses 419 agreements (both goods and services agreements). Our dataset also includes agreements
enlarging and deepening pre-existing agreements. For instance, for the EU we coded the Rome Treaty (1957),
the enlargement treaties, and the Single European Act (1986), the Maastricht Treaty (1992), the Amsterdam
Treaty (1997), the Nice Treaty (2001), and the Lisbon Treaty (2007). In contrast to the WTO list, we did not
11
agreements. We currently have not coded texts for the other agreements mentioned in these
sources because we were unable to find the full texts of some agreements and because of time
constraints. The agreements not yet coded introduce a certain bias, as many of them are older
agreements, partial agreements, and agreements among lesser developed countries.
10
Nevertheless, our sample contains virtually all the countries in the world and covers all the
types of agreements defined above. The following graphs give an overview of the agreements
that we have coded.
0 50 100 150
1945-1949
1950-1954
1955-1959
1960-1964
1965-1969
1970-1974
1975-1979
1980-1984
1985-1989
1990-1994
1995-1999
2000-2004
2005-2009
Number
All agreements
Coded so far
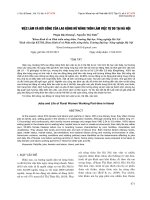
Figure 1: New PTAs over time
Figure 1 shows the number of agreements signed over time (including the percentage of the
agreements that we have coded so far). This figure confirms the common view of a stark
increase in the number of agreements signed in the 1990s. Currently, we only know the data
of signature of an agreement; our data on the date of entry into force still has some gaps at the
time of writing. As we do not know which agreements disappear over time, we cannot give
cumulative numbers. The oldest agreement that we include is the South Africa-Southern
include interim agreements and we separately counted services agreements only if the services agreement was
signed in a different year than the goods agreement.
10
We may also be missing (or may not have coded) some protocols that were added to agreements after they
were signed. Our strategy has been to include all protocols in the coding exercise that are referenced in the main
text of an agreement.
12
Rhodesia Customs Union from 1948 (Interim Agreement for the re-establishment of a
customs union between the Union of South Africa and Southern Rhodesia).
11
The trend sees a
peak in the period 2000-2004, when about 22 agreements were signed each year. Since then,
we have seen a slight decline in the number of PTAs signed, largely due to a decline in the
number of agreements among European countries.
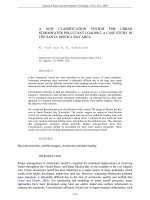
Figure 2a distinguishes between different types of agreement. We use the categories
bilateral, plurilateral, region-country, and inter-regional agreements to classify agreements.
Plurilateral are all agreements that include more than two countries, but do not fall into the
region-country or inter-regional categories. Inter-regional agreements are those signed
between two regional entities. 53 percent of the agreements in our database are bilateral and
only 3 percent of our agreements are inter-regional ones. The figure also shows that our
sample of coded agreements contains slightly fewer bilateral agreements than the
population.
0 10 20 30 40 50 60 70
Bilateral
Plurilateral
Region-country
Interregional
All agreements
Coded so far
Percentage
0 10 20 30 40
Europe
Asia
Africa
America
Oceania
Cross
All agreements
Coded so far
Percentage
Figure 2a & 2b: PTAs by (a) type of agreement and (b) region
In terms of geographical distribution, Figure 2b lists the agreements by continent, using the
United Nations classification to assign countries to a continent.
12
We define agreements
crossing regions as “cross-continent”. Some of the agreements falling under this category are
actually agreements between countries that are geographically close, such as Bulgaria
11
In fact, the origins of this agreement go back to 1910.
12
13
(Europe) and Turkey (Asia). The data confirms the conventional view that most agreements
have been signed among European countries, although the number of PTAs crossing regions
is not much lower. Again, figure 2b shows a small bias in our sample of coded agreements in
favor of European agreements and cross-continent agreements.
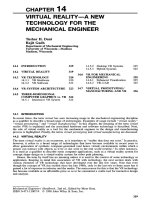
In Figure 3, we show the regional distribution of agreements over time. Two trends are
particularly evident from this graph: first, the sharp increase in the number of agreements in
the 1990s was driven by European countries. Second, more recently, cross-continent
agreements are the dominant form of PTAs.
Before 1960 1960s 1970s 1980s 1990s 2000s
Time
Number
0 20 40 60 80 100
Europe
Asia
Africa
America
Oceania
Cross-continent
Figure 3: Regional distribution of PTAs by time period
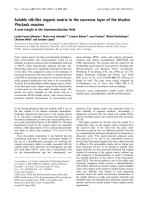
Finally, in Figure 4 we distinguish between North-North, North-South and South-South
agreements. North-North agreements are those among the United States, Canada, Western
European countries, Japan, Australia and New Zealand.
13
North-South agreements are those
signed between one or several of the above countries and all other countries. South-South
agreements are those excluding the above countries. The figure clearly shows that the number
13
Clearly, this list of “Northern” countries is debatable. Countries that can be considered developed at least for
parts of the period covered are Hong Kong, Taiwan, Singapore, South Korea, several Central and Eastern
European countries, and Israel. A better approach would be to classify agreements by comparing the Gross
Domestic Product per capita of member countries; however, this goes beyond what we could do at this stage of
the project.
14
of South-South agreements by far outstrips the number of North-North or North-South
agreements.
0 10 20 30 40 50 60 70
North-North
North-South
South-South
All agreements
Coded so far
Percentage
Figure 4: Agreements by level of development of member countries
We have coded the 404 agreements for a total of 10 broad sectors of cooperation. Some of
these sectors are divided into sub-sectors. The number of items coded varies from one sector
to another: from a minimum of six for the sector government procurement to a maximum of
30 for the sector market access.
The design of PTAs
In the following, we provide an overview of the sectors coded and some selected descriptive
evidence on the design of the PTAs (additional information on the coding strategy is found in
the penultimate section of the paper).
Market access
In terms of market access, we code general characteristics of tariff schedules, degree of
concessions, tariff peaks, exemptions, speed and depth (e.g., Hicks and Kim 2009). We focus
on the types of templates used: First, we code whether states work with the Harmonized
System (HS) or a national system, which particular HS references are used (as these have
15
been regularly updated; HS 1988/92 - very similar and therefore usually combined, HS 1996,
HS 2002 and HS 2007) and at which digit level concessions are listed. Second, the coding
differentiates whether the parties agree on a uniform (basket) approach or whether there are
areas that have a specific treatment (e.g., agriculture, fishery products, textiles, etc)
(Estevadeordal et al. 2009). This is usually reflected in a positive list approach, a negative list
approach or a combination of both. We further code whether there is an explicit stand-still
clause (that parties cannot increase tariffs during negotiations).
With respect to concessions (depth), we focus on the absolute and relative numbers of
tariff lines with concessions (and the number of tariff rate quota lines with concessions). We
also code exemptions (no concessions) and the treatment of tariff peaks (remaining,
decreasing, removed). We calculate average tariffs ex ante and ex post the transition period
(where available). To capture the speed of concessions, we code the pattern of liberalization
over the transition period for tariff lines and tariff quotas focusing on the degrees of early
liberalization, gradual liberalization and liberalization towards the end of the transition period.
Finally, we code whether agreements regulate export taxes. A first round of coding
will be finalized by December 2011.
Services
Several previous attempts have been made to code the services provisions in PTAs, all of
which have looked at a smaller number of PTAs (Stephenson 2002; Mattoo and Sauvé 2007;
Roy et al. 2007; Fink and Molinuevo 2008; Heydon and Woolcock 2009; Marchetti and Roy
2009). Other studies have concentrated on the comparison of the provisions for specific
services sectors (aviation, financial services etc.) or specific modes of supply (e.g., movement
of natural persons) across a number of PTAs (see, for example, some contributions in
Marchetti and Roy 2009). Our coding scheme builds on these previous studies, but refrains
from coding the liberalization commitment for each services subsector (the WTO‟s list
distinguishes more than 150 such sub-sectors, ranging from veterinary services to electronic
mail) across all four modes of services supply (cross-border supply, consumption abroad,
commercial presence, and movement of natural persons). We decided not to code at this level
of detail because 600 coding decisions
14
across more than 400 agreements went beyond what
we could feasibly achieve.
14
In fact, since commitments may not be completely symmetric across member states, the actual number of
coding decisions would be 600 times the number of member states. The study that comes closest to coding at this
level of detail is Roy et al. (2007) who code the commitments for 36 WTO members in the General Agreement
on Trade in Services and in PTAs across all 150 services subsectors for two modes of supply (cross-border trade
and commercial presence).
16
Our initial interest is simply whether an agreement includes any substantive provisions
on the liberalization of trade in services, or mentions this liberalization as an objective.
15
We
then distinguish between positive and negative list approaches to the liberalization of services
trade. Agreements with a negative list approach tend to be more far-reaching than those with a
positive list approach (Fink and Molinuevo 2008). In addition to this, we checked whether the
agreement explicitly included or excluded 11 broad services sectors (from business to
transport services). We also coded the presence or absence of MFN, national treatment, non-
establishment, and movement of natural persons clauses, with the latter two capturing two
modes of services supply. Finally, we coded whether or not the services chapter includes a
continuous review provision.
Figure 5a shows that less than a quarter of all agreements included in our coding
exercise have a substantial services chapter (23 percent). Another third, however, mentions
the liberalization of services trade as an objective, whereas 45 percent of all do not mention
trade in services. Importantly, some agreements that are coded as having no substantive
services provisions may still have chapters on specific services sectors, such as financial
services or transport services. Figure 5b makes a distinction between North-North, North-
South, and South-South agreements. Of the three, North-South agreements have the most far-
reaching and South-South agreements the shallowest services provisions.
No mention Objective Subst. provisions
Service provisions
Percentage
0 10 20 30 40 50
North-North North-South South-South
Level of development
Percentage
0 5 10 15 20 25 30
No mention
Objective
Subst. provisions
Figures 5a & 5b: Services coverage in PTAs by (a) scope and (b) level of development
As expected, the percentage of agreements with substantive services provisions has been
growing for the last couple of years. In fact, a large majority of agreements signed between
15
We use services chapter as a short hand for substantive measures, which may also be found in declarations
added to an agreement. Non-legally binding provisions (as those included in a declaration attached to the 1985
Israel-U.S. agreement) are coded as objective only, as are agreements that only write down an MFN obligation.
17
2005 and 2009 includes a service chapter. By contrast, before 1985 hardly any agreements
foresaw the liberalization of services trade. We also witness substantial variation across
continents in the depth of services provisions. The largest share of agreements with
substantive services provisions is to be found in the Americas, whereas we have only two
coded African agreements in the database with substantive services provisions. Also the large
majority of intra-European agreements either do not mention the liberalization of services
trade (especially the older ones) or do so only as an objective to be reached at a later stage.
When comparing types of agreements (bilateral, plurilateral, region-country, and region-
region agreements), no particular trend becomes apparent.
Europe Asia Africa America Oceania Cross
Region
Percentage
0 5 10 15 20 25 30
Positive approach
Negative approach
Europe Asia Africa America Oceania Cross
Region
Percentage
0 5 10 15 20 25 30
MFN clause no
MFN clause yes
Europe Asia Africa America Oceania Cross
Region
Percentage
0 5 10 15 20 25 30
National treatment no
National treatment yes
Europe Asia Africa America Oceania Cross
Region
Percentage
0 5 10 15 20 25 30
Continuous review no
Continuous review yes
Figures 6a-6d: Services sectors by region (percentages are calculated in relation to all
agreements that at least mention services liberalization)
16
Figures 6a to 6d provide evidence with respect to the more detailed items that we coded for
each services sector, always distinguishing by region. Clearly, most agreements with
substantive services provisions adopt a negative list approach. Interestingly, Asian agreements
are an exception to this rule. MFN clauses are rather rare in the agreements that mention at
least the objective of services trade liberalization, and are not used in European agreements.
16
The values shown in Figures 6a and 6c do not add up to 100 percent as coding the approach to liberalization
and national treatment provisions only makes sense for agreements with substantive services provisions.
18
Most agreements with substantive provisions on services trade liberalization include a
national treatment clause. Finally, across all continents many agreements include a continuous
review provision, which is a clause that stipulates further negotiations on the liberalization of
trade in services.
Investment
Our coding strategy focuses on eights sets of variables: 1) sectoral coverage; 2) scope of non-
discrimination provisions; 3) most-favored nation (MFN); 4) national treatment (NT); 5)
standards of treatment; 6) transfer of payments; 7) dispute settlement mechanism (DSM); 8)
temporary movement of business and natural people. Sectoral Coverage is the most important
variable in determining the scope of investment protection. First, in coding this variable we
distinguish among PTAs that do not include any investment provisions and PTAs that do.
Second, among the latter PTAs we categorize whether PTAs include a vague statement on
investment protection, rely on bilateral investment treaties previously signed by member
countries, contain investment provisions only in the service sector (GATS type), and PTAs
that have an ad hoc section on investment (NAFTA type).
The scope of non-discrimination provisions allows checking in which phase(s) (if at
all) of the investment procedure foreign investors are protected. In coding MFN and NT we
distinguish between negative list and positive list; the former one being a stronger form of
investment protection than the latter one. MFN and NT are contingent standards based on the
treatment afforded to other groups of investors, whereas the standards of treatment are based
on customary international law (Lesher and Miroudot 2006: 14). Regarding transfers of
payments, we code whether there are restrictions in transferring profits from the host country
to the home country. Regarding the DSM, we assess the presence of a dispute settlement
clause and also distinguish between an investor-state DSM and a state-state dispute DSM.
Finally, we code whether there are restrictions for movement of key personnel, e.g. managers
and chairmen of the board, and business.
19
no mention endeavors based on BIT services beyond services
Sectoral Coverage
Percentage
0 10 20 30 40 50
Figure 7: Investment coverage in PTAs
A third of the agreements included in our coding exercise do not mention investment at all
(Figure 7). 40 percent of the agreements mention investment protection as a general objective,
often in the preamble, without including any further provisions on how to realize and enforce
such protection. Moreover, only a handful of PTAs rely on provisions included in a bilateral
investment treaty previously signed by the same two countries (three percent). Similarly, only
two percent of PTAs regulate investment protection in the service sector. PTAs signed by the
EU with developing countries fall in this category. Finally, almost 20 percent of PTAs include
a separate chapter on investment protection. In sum, only a relatively low number of PTAs
contain strict regulations on investment.
As with other sectors, the percentage of agreements with investment protection
provisions has been growing over time (see Figure 8a) and it is a feature of new regionalism
(Ethier 1998). Interestingly, the majority of PTAs signed in the last five years include an
investment chapter, that is to say, double the number of PTAs that make no mention of
investment protection. Moreover, Figure 8b shows that bilateral agreements are the deepest
PTAs in terms of investment protection. Indeed, more than 40 percent of bilateral agreements
include a chapter on investment. Finally, developed economies tend to form PTAs that
include stricter regulation on investment than developing countries do. This does not come as
a surprise. Since they have the largest share of FDI outflows, highly industrialized countries
are particularly concerned in protecting their investments.
20
1945-54 1960-64 1970-74 1980-84 1990-94 2000-04
Time
Percentage
0 5 10 15
no mention
endeavors
based on BIT
only services
invest. ch.
Bilateral Plurilateral Region-country Inter-regional
Type of agreement
Percentage
0 5 10 15 20 25
no mention
endeavors
based on BIT
only services
invest. ch.
Figures 8a & 8b: Investment sectors by (a) time period and (b) type
Europe Asia Africa America Oceania Cross-region
Region
Percentage
0 5 10 15
no mention
endeavors
based on BIT
services
beyond services
North-North North-South South-South
Level of development
Percentage
0 5 10 15 20 25 30
no mention
endeavors
based on BIT
only services
invest. ch.
Figures 8c & 8d: Investment sectors by (c) region and (d) level of development
In terms of dispute settlement mechanisms, Figure 9 shows that only one third of PTAs has
either an investor-state DSM or a state-state DSM. This percentage is higher for north-south
PTAs relatively to north-north PTAs and south-south PTAs. Indeed, almost 50 percent of the
north-south PTAs include either an investor-state DSM or a state-state DSM. As for sectoral
coverage, the number of PTAs that include a DSM on investment has increased sharply in the
last decade (Figure 10). Overall, we can conclude that investments are still poorly protected
by PTAs, though there is evidence that countries have become more concerned with this issue
over the last ten years.
21
no DSM state-investor DSM state-state DSM
DSM
Percentage
0 20 40 60 80
Figure 9: Investment-related dispute settlement provisions
1945-54 1960-64 1970-74 1980-84 1990-94 2000-04
Time
Percentage
0 5 10 15 20
no DSM
state-investor DSM
state-state DSM
North-North North-South South-South
Level of development
Percentage
0 10 20 30 40 50
no DSM
state-investor DSM
state-state DSM
Figure 10a & 10b: Investment-related dispute settlement provisions by (a) time period and
(b) level of development
Intellectual Property Rights
Our coding strategy focuses on three sets of variables for intellectual property rights (IPRs):
1) general statement on IPRs; 2) IPR Conventions; 3) scope of IPR protection. Regarding
general statement on IPRs, the aim is to distinguish among PTAs that do not include any IPR
provisions and PTAs that do. Regarding IPR Conventions, we code whether PTAs include
22
specific deadlines for acceding to key multilateral conventions on the protection of IPR.
Regarding scope of IPR protection, we code whether there are provisions protecting IPRs in
specific sector (e.g., pharmaceutical industry). Moreover, we coded 1 when there are
provisions that require products to specify the geographical provenance. Finally, we coded 1
if there is a specific provision on the enforcement of regulations related to IPRs protection.
Figure 11 shows IPR coverage for all PTAs in the sample. Specifically, coders were
asked to answer 10 yes or no questions related to IPRs. High numbers imply strong coverage
of IPRs, e.g. a score of 10 implies that a coder answered yes, i.e. she coded 1, to every
question. More than forty percent of PTAs have no provision on IPRs and more that two
thirds have only weak IPRs coverage, i.e. IPRs total coverage scores lower than or equal to 2.
Roughly ten percent of PTAs have strong IPR coverage, i.e. IPRs total coverage scores at
least 7. EU and US bilateral trade agreements fall in this category.
0 1 2 3 4 5 6 7 8 9 10
IPRs Total Coverage
Percentage
0 10 20 30 40 50
Figure 11: Coverage of intellectual property rights.
17
Figure 12 shows that provisions on IPRs have been included in PTAs only in the last 20 years.
Against the background of the Trade-Related Aspects of Intellectual Property Rights (TRIPS)
agreement, signed by WTO members in 1994, there is evidence that (at least) some countries
do not find existing provisions included in this multilateral agreement sufficient and try to
regulate IPRs bilaterally. Moreover, this finding suggests that a small percentage of PTAs
include WTO-plus provisions on IPRs. Finally, and not surprisingly, north-south PTAs
include stronger IPRs protection compare to north-north and south-south PTAs.
17
10 yes (coded one) or no (coded zero) questions related to provision protecting IPRs. High numbers imply
strong coverage of IPRs.
23
1945-54 1960-64 1970-74 1980-84 1990-94 2000-04
Time
Percentage
0 10 20 30 40 50 60
Weak Protection
Medium Protection
Strong Protection
North-North North-South South-South
Level of development
Percentage
0 10 20 30 40 50
Weak Protection
Medium Protection
Strong Protection
Figures 12a &12b: Coverage of intellectual property rights by (a) time period and (b) level of
development
Government procurement
With respect to provisions governing public procurement, again building on previous studies
in this area (Heydon and Woolcock 2009), we first coded whether an agreement included the
regulation of procurement policies as a general objective or in form of substantive rules. We
also coded the presence or not of a national treatment clause, a transparency clause, and a
reference to the GATT/WTO rules on public procurement. Finally, we coded the scope of the
procurement provisions (if any) in terms of entities (government, sub-national governments,
state-owned enterprises) and type of purchase (goods and/or services) covered.
About 50 percent of the agreements have a reference to government procurement, but
only 14 percent include substantive procurement provisions (that is, provisions that go beyond
stating adherence to the WTO agreement on procurement or the desire to exchange
information in this area) (Figures 13a & 13b)
24
No mention Objective Subst. provisions
Procurement provisions
Percentage
0 10 20 30 40 50
North-North North-South South-South
Level of development
Percentage
0 10 20 30 40
No mention
Objective
Subst. provisions
Figures 13a & 13b: Coverage of government procurement provisions by (a) substance and b)
level of development
Again, as with the other sectors coded here, it is evident that over time the depth of integration
has increased with respect to government procurement (Figure 13c). Government
procurement provisions are virtually absent from African agreements; by contrast, the share of
agreements with substantive procurement provisions is highest for agreements in the
Americas (Figure 13d).
up to 59 1960s 1970s 1980s 1990s 2000s
Time
Percentage
0 5 10 15 20
No provision
Objective
Substantive
Europe Asia Africa America Oceania Cross
Region
Percentage
0 5 10 15 20
No provision
Objective
Substantive
Figures 13c & 13d: Coverage of government procurement provisions by (c) time period and
(d) by region
Basically all of the agreements with substantive provisions grant national treatment with
respect to government procurement. Throughout, they tend to extend this treatment to goods
and services; moreover, they apply not only to the national government, but also to
subnational governments and state-owned enterprises (although many agreements include
25
positive lists of such enterprises). More than half of all agreements that mention access to
government procurement at least as objective make a reference to the GATT/WTO agreement
on government procurement, whereas only a quarter include a transparency provision.
Competition
With regard to competition-related obligations, we first seek to capture the importance given
to this area by the contracting parties. We code whether competition is covered in a chapter or
single articles. We also record whether agreements have provisions related to subsidies,
coding whether these are allowed or out-ruled, and whether specific references to the
GATT/WTO agreement are made. Second, we compile information on the scope of areas
covered in an agreement (e.g., monopolies and cartels, mergers and acquisitions, state trading
enterprises, state aid (and as an extra category structural adjustment provisions)) (see also Teh
2009) and the degree of cooperation measured by the forms of cooperation (general obligation
not to distort competition, exchange information, notification, establish national competition
authorities, establish working groups, coordination among authorities of partner countries,
creation of common competition authority).
Chapter General provision
Percentage
0
20
40
60
80
North-North North-South South-South
Chapter
General provision
Level of development
Percentage
0
10
20
30
40
Figures 14a & 14b: Provisions on competition by (a) scope and (b) level of development
Figures 14a and 14b show descriptive statistics related to the existence of provisions in the
field of competition. The existence of a competition chapter indicates the importance
attributed to this area by the contracting parties. While only 24 percent have a chapter
dedicated to competition, more than 80 percent of PTAs have competition-related provisions.
Only after 1990 parties started to integrate full chapters on competition into agreements. In
terms of development, north-north and north-south agreements have a relative high number of
competition chapters (roughly 50 percent).