creating optimal service delivery strategy of long-term service agreements from risk management perspective
Bạn đang xem bản rút gọn của tài liệu. Xem và tải ngay bản đầy đủ của tài liệu tại đây (1.35 MB, 257 trang )
CREATING OPTIMAL SERVICE DELIVERY STRATEGY OF
LONG-TERM SERVICE AGREEMENTS FROM RISK
MANAGEMENT PERSPECTIVE
By
Chaipat Lawsirirat
A Thesis Submitted to the Graduate
Faculty of Rensselaer Polytechnic Institute
in Partial Fulfillment of the
Requirements for the Degree of
DOCTOR OF PHILOSOPHY
Major Subject: Decision Sciences and Engineering Systems
Approved by the
Examining Committee:
Dr. Aparna Gupta, Thesis Adviser
Dr. Srinivas Bollapragada, Thesis Adviser
Dr. Shekhar Jayanthi, Member
Dr. Charles J. Malmborg, Member
Dr. William A. Wallace, Member
Rensselaer Polytechnic Institute
Troy, New York
November 2007
(For Graduation December 2007)
UMI Number: 3299457
3299457
2008
UMI Microform
Copyright
All rights reserved. This microform edition is protected against
unauthorized copying under Title 17, United States Code.
ProQuest Information and Learning Company
300 North Zeeb Road
P.O. Box 1346
Ann Arbor, MI 48106-1346
by ProQuest Information and Learning Company.
CREATING OPTIMAL SERVICE DELIVERY STRATEGY OF
LONG-TERM SERVICE AGREEMENTS FROM RISK
MANAGEMENT PERSPECTIVE
By
Chaipat Lawsirirat
An Abstract of a Thesis Submitted to the Graduate
Faculty of Rensselaer Polytechnic Institute
in Partial Fulfillment of the
Requirements for the Degree of
DOCTOR OF PHILOSOPHY
Major Subject: Decision Sciences and Engineering Systems
The original of the complete thesis is on file
in the Rensselaer Polytechnic Institute Library
Examining Committee:
Dr. Aparna Gupta, Thesis Adviser
Dr. Srinivas Bollapragada, Thesis Adviser
Dr. Shekhar Jayanthi, Member
Dr. Charles J. Malmborg, Member
Dr. William A. Wallace, Member
Rensselaer Polytechnic Institute
Troy, New York
November 2007
(For Graduation December 2007)
c
Copyright 2007
by
Chaipat Lawsirirat
All Rights Reserved
ii
CONTENTS
LIST OF TABLES . . . . . . . . . . . . . . . . . . . . . . . . . . . . . . . . . viii
LIST OF FIGURES . . . . . . . . . . . . . . . . . . . . . . . . . . . . . . . . x
ACKNOWLEDGMENT . . . . . . . . . . . . . . . . . . . . . . . . . . . . . . xii
ABSTRACT . . . . . . . . . . . . . . . . . . . . . . . . . . . . . . . . . . . . xv
1. Introduction . . . . . . . . . . . . . . . . . . . . . . . . . . . . . . . . . . . 1
1.1 Problem Background . . . . . . . . . . . . . . . . . . . . . . . . . . . 2
1.2 Motivation of the Research . . . . . . . . . . . . . . . . . . . . . . . . 5
1.2.1 Challenges in Managing a Portfolio of LTSAs . . . . . . . . . 5
1.2.1.1 Product and Service Designs . . . . . . . . . . . . . 5
1.2.1.2 Service Infrastructure . . . . . . . . . . . . . . . . . 6
1.2.1.3 Service Contract Drafts . . . . . . . . . . . . . . . . 8
1.2.2 Risks of Managing a Portfolio of LTSAs . . . . . . . . . . . . 8
1.2.3 Motivation and Contribution . . . . . . . . . . . . . . . . . . . 9
1.3 Problem Statement . . . . . . . . . . . . . . . . . . . . . . . . . . . . 11
1.4 Outline of the Dissertation . . . . . . . . . . . . . . . . . . . . . . . . 15
2. Literature Review . . . . . . . . . . . . . . . . . . . . . . . . . . . . . . . . 17
2.1 Related Works for Challenges Faced by a Provider . . . . . . . . . . . 18
2.1.1 Related Works in Product Design . . . . . . . . . . . . . . . . 18
2.1.2 Related Works in LTSA Service Delivery Management . . . . 19
2.1.2.1 An Overview of After Sales Service Management . . 20
2.1.3 An Overview of Product Warranty Services . . . . . . . . . . 23
2.1.3.1 An Overview of Maintenance Management . . . . . . 25
2.1.4 An Overview of Risk Management in Long-Term Service Agree-
ments . . . . . . . . . . . . . . . . . . . . . . . . . . . . . . . 27
2.1.4.1 Risk Assessment and Management for Products and
Service Delivery . . . . . . . . . . . . . . . . . . . . 28
2.1.4.2 Financial Risks . . . . . . . . . . . . . . . . . . . . . 31
2.2 Optimization Models Related to Management of LTSAs . . . . . . . . 37
2.2.1 Maintenance Scheduling Problems . . . . . . . . . . . . . . . . 38
2.2.1.1 Perfect Repair or Replacement Models . . . . . . . . 39
iii
2.2.1.2 Minimal Repair Models . . . . . . . . . . . . . . . . 41
2.2.1.3 Minimal Number of Failures Repair Mo dels . . . . . 43
2.2.1.4 Repair Models with Age-dependent . . . . . . . . . . 44
2.2.1.5 Repair Models with Systems’ Deterioration . . . . . 45
2.2.1.6 Repair Models under Shocks . . . . . . . . . . . . . . 46
2.2.1.7 Imperfect Repair Models . . . . . . . . . . . . . . . . 47
2.2.2 Condition Based Maintenance Models . . . . . . . . . . . . . . 48
2.2.2.1 Multi-Component System Repair Models . . . . . . . 48
2.2.3 Machine Replacement Problem . . . . . . . . . . . . . . . . . 51
2.2.3.1 Serial Replacement Analysis in Finite Horizon . . . . 51
2.2.3.2 Serial Replacement Analysis in Infinite Horizon . . . 53
2.2.3.3 Parallel Replacement . . . . . . . . . . . . . . . . . . 54
2.2.4 Inventory Pooling Models . . . . . . . . . . . . . . . . . . . . 58
2.3 Conclusions . . . . . . . . . . . . . . . . . . . . . . . . . . . . . . . . 60
3. Anatomy of risks in the Service Delivery of Long-Term Service Agreements 61
3.1 Introduction . . . . . . . . . . . . . . . . . . . . . . . . . . . . . . . . 61
3.2 Dimensions of Risks in the Service Delivery of LTSAs . . . . . . . . . 62
3.2.1 Product Design . . . . . . . . . . . . . . . . . . . . . . . . . . 63
3.2.2 Manufacturing and Installation . . . . . . . . . . . . . . . . . 65
3.2.3 Contract Setup and Specification (Service Design) . . . . . . . 66
3.2.4 Physical Service Infrastructure . . . . . . . . . . . . . . . . . . 67
3.2.5 Knowledge-based Infrastructure and Management . . . . . . . 69
3.2.6 Sales and Marketing . . . . . . . . . . . . . . . . . . . . . . . 71
3.2.7 Financial Resource Management . . . . . . . . . . . . . . . . . 71
3.2.8 Government Regulations . . . . . . . . . . . . . . . . . . . . . 72
3.2.9 Legal Issues . . . . . . . . . . . . . . . . . . . . . . . . . . . . 73
3.3 Conclusions . . . . . . . . . . . . . . . . . . . . . . . . . . . . . . . . 74
4. Designing Optimal Service Maintenance Strategy of Monitoring-Enabled
Multi-Component Systems from Product Risk Perspective . . . . . . . . . 76
4.1 Problem Background and Motivations . . . . . . . . . . . . . . . . . . 77
4.2 A Multi-Component Deterioration Model . . . . . . . . . . . . . . . . 78
4.2.1 A Continuous Deterioration Model . . . . . . . . . . . . . . . 79
4.2.1.1 Jumps in a Single Component Deterioration Model . 80
4.2.2 A Multi-Component Deterioration Model . . . . . . . . . . . . 81
iv
4.3 A Multi-Component Deterioration Model with Maintenance Actions . 83
4.3.1 Repair or Replace Model . . . . . . . . . . . . . . . . . . . . . 83
4.3.2 Enumerating the Maintenance Actions . . . . . . . . . . . . . 84
4.4 Simulation Based Optimization Problem . . . . . . . . . . . . . . . . 86
4.4.1 Optimal Search Algorithm . . . . . . . . . . . . . . . . . . . . 89
4.5 Numerical Example . . . . . . . . . . . . . . . . . . . . . . . . . . . . 91
4.5.1 Analysis of the Optimal Solution . . . . . . . . . . . . . . . . 93
4.5.2 Assuring Robustness of the Optimal Solution . . . . . . . . . 94
4.6 Conclusions . . . . . . . . . . . . . . . . . . . . . . . . . . . . . . . . 98
5. Developing Optimal Service Delivery of Long-Term Service Agreements
Under Service Risks . . . . . . . . . . . . . . . . . . . . . . . . . . . . . . . 100
5.1 Introduction . . . . . . . . . . . . . . . . . . . . . . . . . . . . . . . . 100
5.2 Overview of A Risk Assessment and Management Framework . . . . . 102
5.3 Building the Framework . . . . . . . . . . . . . . . . . . . . . . . . . 104
5.3.1 Engineering Reliability . . . . . . . . . . . . . . . . . . . . . . 105
5.3.1.1 A Continuous Deterioration Model with Jumps . . . 105
5.3.2 Maintenance . . . . . . . . . . . . . . . . . . . . . . . . . . . . 109
5.3.2.1 Identifying Trigger Events . . . . . . . . . . . . . . . 109
5.3.2.2 Enumerating Maintenance Actions . . . . . . . . . . 110
5.3.2.3 Estimating the Number of Components Involved in
a Maintenance Action . . . . . . . . . . . . . . . . . 111
5.3.2.4 Correction Factors for Maintenance Actions and Their
Variability . . . . . . . . . . . . . . . . . . . . . . . . 112
5.3.2.5 Maintenance Cost . . . . . . . . . . . . . . . . . . . 113
5.3.2.6 Times for Maintenance and Their Variations . . . . . 113
5.3.3 Service Infrastructure . . . . . . . . . . . . . . . . . . . . . . . 115
5.3.3.1 Monitoring System Model . . . . . . . . . . . . . . . 115
5.3.3.2 Inventory Model . . . . . . . . . . . . . . . . . . . . 116
5.3.3.3 Relationship between the Level of Inventory and De-
lay of Downtime . . . . . . . . . . . . . . . . . . . . 118
5.3.4 Contract Definitions . . . . . . . . . . . . . . . . . . . . . . . 118
5.3.4.1 Modeling Performance Measures . . . . . . . . . . . 119
5.3.4.2 Penalty Fee . . . . . . . . . . . . . . . . . . . . . . . 120
5.3.5 Finance . . . . . . . . . . . . . . . . . . . . . . . . . . . . . . 122
5.3.5.1 Revenue and Reserve Fund Models . . . . . . . . . . 122
v
5.3.5.2 Risk Measures . . . . . . . . . . . . . . . . . . . . . 123
5.4 Simulation Algorithm . . . . . . . . . . . . . . . . . . . . . . . . . . . 125
5.4.1 Analysis of Optimal Maintenance Action Obtained at the En-
gineering Level . . . . . . . . . . . . . . . . . . . . . . . . . . 127
5.4.1.1 Analysis of Optimal Inventory Policy . . . . . . . . . 128
5.4.1.2 Analysis of Revenue Parameters . . . . . . . . . . . . 129
5.5 Simulation Based Optimization . . . . . . . . . . . . . . . . . . . . . 130
5.5.1 Sensitivity Analysis of the Monitoring System . . . . . . . . . 137
5.6 Conclusions . . . . . . . . . . . . . . . . . . . . . . . . . . . . . . . . 138
6. Optimal Strategic Financial Management Minimizing Shortfall of Cash
Flow for the Provider of Long-Term Service Agreements . . . . . . . . . . . 140
6.1 Introduction . . . . . . . . . . . . . . . . . . . . . . . . . . . . . . . . 140
6.2 Problem Description . . . . . . . . . . . . . . . . . . . . . . . . . . . 143
6.2.1 Preliminary Analysis . . . . . . . . . . . . . . . . . . . . . . . 144
6.3 Asset Selection . . . . . . . . . . . . . . . . . . . . . . . . . . . . . . 148
6.3.1 Defining Shortfall . . . . . . . . . . . . . . . . . . . . . . . . . 149
6.3.2 Investment Definition . . . . . . . . . . . . . . . . . . . . . . . 150
6.3.3 Selecting Asset . . . . . . . . . . . . . . . . . . . . . . . . . . 151
6.4 Problem Formulation . . . . . . . . . . . . . . . . . . . . . . . . . . . 152
6.5 Simulation Based Optimization . . . . . . . . . . . . . . . . . . . . . 155
6.5.1 Optimal Search Algorithm . . . . . . . . . . . . . . . . . . . . 158
6.5.2 Results . . . . . . . . . . . . . . . . . . . . . . . . . . . . . . . 160
6.5.2.1 Sensitivity Analysis of Exercise Price of Put Option . 164
6.6 Conclusions . . . . . . . . . . . . . . . . . . . . . . . . . . . . . . . . 166
7. Optimal Part Replacement in a Management of a Portfolio of LTSAs . . . 168
7.1 Introduction . . . . . . . . . . . . . . . . . . . . . . . . . . . . . . . . 168
7.2 Problem Description . . . . . . . . . . . . . . . . . . . . . . . . . . . 169
7.2.1 Numerical Examples . . . . . . . . . . . . . . . . . . . . . . . 170
7.3 Notation . . . . . . . . . . . . . . . . . . . . . . . . . . . . . . . . . . 171
7.4 Flow Formulation . . . . . . . . . . . . . . . . . . . . . . . . . . . . . 173
7.5 Heuristic Solutions . . . . . . . . . . . . . . . . . . . . . . . . . . . . 176
7.5.1 Myopic Heuristic . . . . . . . . . . . . . . . . . . . . . . . . . 177
7.5.2 Iterative Search Heuristic . . . . . . . . . . . . . . . . . . . . 177
vi
7.6 Computational Study . . . . . . . . . . . . . . . . . . . . . . . . . . . 179
7.7 Conclusions . . . . . . . . . . . . . . . . . . . . . . . . . . . . . . . . 181
8. Conclusions and Future Works . . . . . . . . . . . . . . . . . . . . . . . . . 182
8.1 Conclusions . . . . . . . . . . . . . . . . . . . . . . . . . . . . . . . . 182
8.2 Discussions . . . . . . . . . . . . . . . . . . . . . . . . . . . . . . . . 185
8.3 Future Works . . . . . . . . . . . . . . . . . . . . . . . . . . . . . . . 187
8.3.1 Strategic Business Management . . . . . . . . . . . . . . . . . 187
8.3.2 Strategic Operations Management . . . . . . . . . . . . . . . . 189
LITERATURE CITED . . . . . . . . . . . . . . . . . . . . . . . . . . . . . . 191
APPENDICES . . . . . . . . . . . . . . . . . . . . . . . . . . . . . . . . . . . 220
A. Validating The Deterioration Model With Jumps . . . . . . . . . . . . . . 220
A.1 Failure Time Distribution of a Sample Gas Turbine . . . . . . . . . . 221
A.2 Component Causing Failures . . . . . . . . . . . . . . . . . . . . . . . 224
A.3 Failure Profile of a Product . . . . . . . . . . . . . . . . . . . . . . . 225
A.4 Summary . . . . . . . . . . . . . . . . . . . . . . . . . . . . . . . . . 226
B. Mapping the Deterioration of a System From the Deterioration of Its Com-
ponents . . . . . . . . . . . . . . . . . . . . . . . . . . . . . . . . . . . . . 227
B.1 Mapping the System Model to the Component Model . . . . . . . . . 229
B.1.1 Mapping the Continuous Deterioration of the Component Model
to the System Model . . . . . . . . . . . . . . . . . . . . . . . 229
B.1.1.1 The Analysis of the Product of Component’s Con-
tinuous Deterioration . . . . . . . . . . . . . . . . . . 230
B.1.1.2 Analysis of the Product of Continuous Deteriora-
tions and Jumps in Deterioration . . . . . . . . . . . 233
B.1.2 Analysis of the Product of Component’s Jump Deterioration . 234
B.1.3 Mapping the Jump Deterioration Process . . . . . . . . . . . . 235
C. Assignment Formulation of the Optimal Part Replacement in a Manage-
ment of a Portfolio of LTSAs Problem . . . . . . . . . . . . . . . . . . . . 236
vii
LIST OF TABLES
1.1 Challenges in CBM . . . . . . . . . . . . . . . . . . . . . . . . . . . . . 7
2.1 Three primary steps toward risk management in safety . . . . . . . . . 29
4.1 Cost Matrix . . . . . . . . . . . . . . . . . . . . . . . . . . . . . . . . . 84
4.2 List of maintenance actions . . . . . . . . . . . . . . . . . . . . . . . . . 86
4.3 The interaction coefficients used in the illustrated problem . . . . . . . 91
4.4 The parameter used in the illustrated problem . . . . . . . . . . . . . . 91
4.5 A relationship between a failed component i and magnitude of deterio-
ration (F
i,t
) of the system . . . . . . . . . . . . . . . . . . . . . . . . . . 92
4.6 Maintenance costs and recovery values . . . . . . . . . . . . . . . . . . . 92
4.7 The table shows an initial solution and the optimal solution (OP T ) of
the problem . . . . . . . . . . . . . . . . . . . . . . . . . . . . . . . . . 93
4.8 The performance analysis of the optimal solution compares with other
two solutions . . . . . . . . . . . . . . . . . . . . . . . . . . . . . . . . . 94
4.9 Range of the threshold values for which the optimal solution (OPT )
stays optimal and the modifications when the threshold values are be-
yond the range . . . . . . . . . . . . . . . . . . . . . . . . . . . . . . . . 95
5.1 The threshold levels for trigger events . . . . . . . . . . . . . . . . . . . 110
5.2 Description of candidate maintenance actions . . . . . . . . . . . . . . . 111
5.3 Possible outcomes of correction factors of a maintenance action . . . . . 113
5.4 Possible outcomes of time for a maintenance action . . . . . . . . . . . 114
5.5 The table describes the CO P T
1
strategy . . . . . . . . . . . . . . . . . 128
5.6 A cost matrix of COPT
1
strategy . . . . . . . . . . . . . . . . . . . . . 128
5.7 A comparison between (s, S) and (Q, r) inventory policy of COP T
1
. . 129
5.8 The table describes the OP T solution . . . . . . . . . . . . . . . . . . . 134
5.9 A cost comparison between COPT
1
and OPT solutions . . . . . . . . . 135
5.10 A comparison between (s, S) and (Q, r) inventory policy of OP T . . . . 136
viii
6.1 The table compares important statistics between not investing, invest-
ing only in stock and investing only in bond . . . . . . . . . . . . . . . 147
6.2 Percentiles of τ
1
and D
1
. . . . . . . . . . . . . . . . . . . . . . . . . . . 151
6.3 Time to maturity of bonds and options . . . . . . . . . . . . . . . . . . 152
6.4 US treasury zero-coupon bond price as of Apr 11, 2007 . . . . . . . . . 152
6.5 The table compares important statistics between investing in the opti-
mal asset mix, investing only in stock and investing only in bond . . . . 163
6.6 The table presents the results of sensitivity analysis of put options . . . 165
7.1 Numerical examples of the maintenance schedule . . . . . . . . . . . . . 171
7.2 The number of variables and constraints of the test problems . . . . . . 180
7.3 The computational times and the results of the test problems . . . . . . 181
A.1 Parameters of the distribution of failure times when maintenance is
excluded . . . . . . . . . . . . . . . . . . . . . . . . . . . . . . . . . . . 222
A.2 Parameters of the distribution of failure times when maintenance is
excluded . . . . . . . . . . . . . . . . . . . . . . . . . . . . . . . . . . . 223
ix
LIST OF FIGURES
1.1 Infrastructure of LTSAs . . . . . . . . . . . . . . . . . . . . . . . . . . . 2
1.2 Effective management of LTSAs . . . . . . . . . . . . . . . . . . . . . . 10
2.1 Classification of service structure (Buzacott, 2000) . . . . . . . . . . . . 22
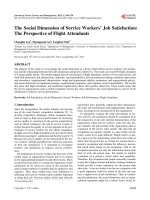
2.2 The industrial service profiling framework (Johansson and Olhager, 2004) 23
2.3 The figure presents the concept of ALARP zone (Marszal 2001) . . . . . 31
3.1 Risk assessment and risk management process . . . . . . . . . . . . . . 63
3.2 The relationship between setups and provider . . . . . . . . . . . . . . . 64
3.3 Process of monitoring systems . . . . . . . . . . . . . . . . . . . . . . . 68
4.1 Flow chart of a simulation of a deterioration process of a system . . . . 87
4.2 The confidence interval of the expected total cost of OP T when the
range of threshold values of the system is between 124 and 136 . . . . . 97
4.3 The expected total cost of OP T when the ranges of threshold values of
components are between 52 and 56 . . . . . . . . . . . . . . . . . . . . . 98
5.1 An overview of models development in the framework . . . . . . . . . . 103
5.2 A flow of model developments of risk assessment . . . . . . . . . . . . . 106
5.3 Flow chart of a simulation of risk assessment models . . . . . . . . . . . 126
5.4 The outline of optimal search procedure . . . . . . . . . . . . . . . . . . 132
6.1 The probability of the operational reserve less than zero . . . . . . . . 144
6.2 99% Value at Risk of the operational reserve over time . . . . . . . . . . 145
6.3 The profile of probability that the net worth of the portfolio is negative 147
6.4 99% Value at Risk of the net worth of the portfolio over time . . . . . . 148
6.5 The graph represents the flow of the net worth over time . . . . . . . . 153
6.6 Flow chart of the simulation algorithm of asset allocation . . . . . . . . 156
6.7 A graph plots the evolution of the value of objective function . . . . . . 161
x
6.8 A figure compares probability of shortfall of cash flow among various
investment strategy and the optimal asset allocation . . . . . . . . . . . 162
6.9 A figure compares 99% value at risk of net worth among various invest-
ment strategy and the optimal asset allocation . . . . . . . . . . . . . . 163
7.1 The graph represents the concept of Flow Formulation Approach . . . . 173
A.1 The Weibull probability plot of the field data (left panel) and the reli-
ability engineering model (right panel) . . . . . . . . . . . . . . . . . . . 222
A.2 Histogram of failure times with maintenance of the field data (left panel)
and the reliability engineering model (right panel) . . . . . . . . . . . . 223
A.3 Histogram of failures caused by each component of the field data (left
panel) and the reliability engineering model (right panel) . . . . . . . . 225
A.4 Histogram of failures occurred in each year of the field data (left panel)
and the reliability engineering model (right panel) . . . . . . . . . . . . 226
xi
ACKNOWLEDGMENT
Success is never trivial. It involves hard work, consistency, endurance, and persever-
ance. Besides all of these, it needs loves and supports from your loved ones, family,
friends, advisors, and coworkers. I wish to take this p ortion of my dissertation to
express my sincere thanks and deep gratitude to them though words can never fully
describe their wholehearted support and express my true feeling.
First and foremost, I would like to sincerely thank my thesis advisors, Professor
Aparna Gupta and Dr. Srinivas Bollapragada. I am mostly indebted to Professor
Gupta. Despite her busy schedule, she devotes some of her valuable time to meet me.
She always gives valuable advices, insights, and guidance on the problem, and shows
her kind compassion, extremely understanding, exceptional patience, and immense
supports, to her students. She always encourages, motivates, and challenges me to
constantly improve my research and communication skills. Her cares do not only
limit to research, but she also concerns with my family well-being and my future
career path. Over the years, it is my pleasure and privilege to be her advisee.
I am extremely grateful for Dr. Srinivas Bollapragada. Dr. Srinivas Bol-
lapragada introduced me to the area of long-term service agreements. Despite his
tight schedule, he always spares me his precious times for our meeting, consistently
suggests new methods to solve the problem more effectively, and shares his interest-
ing insights toward the problem as well as professional experience. I am also truly
thankful that he took a large burden to find me data for validating the deterioration
model. Without these data, the dissertation would not have had a solid foundation
and a strong impact. I would also like to express my gratitude to his family who
always welcomes me to their lovely home and prepares such delicious snacks during
our meeting.
I am most thankful for Professor William Wallace who challenges me to gear
my research toward bigger picture and the most important issues, provides me valu-
able insights, and allows me to benefit from his vast experience. He also shows his
kind interest in Thailand.
xii
My special thanks go to Professors Charles Malmborg and Shekhar Jayanthi
who accept to serve on my committee on such a short notice and take time to read
my dissertation. Their inestimable comments help improve overall quality of the
final version of the dissertation. I also wish to thank Professors Bimal Malaviya,
Ricardo Dobry, Ceceil Mars, and Henry Scarton. It is my honor to be their TAs
during a brief time of my doctoral study. It is a very fun and precious experience
working with them.
I wish to thank every DSES professor and staff who makes DSES such a loving
community and RPI who gives me an opportunity and beautiful experience. I am
also thankful for every teacher, lecturers, professors, and schools that have educated
me throughout my whole student life. Special thanks are due to my friends, Ruhi,
Alvin, Vanessa, Ella, Lepeng, Lingyi, Xin, Jing, Zhisheng, Ram, Kumar, and Rusty
who offered me friendship and assistance, and shared some fun during my study.
I sincerely thank to our small but loving and caring Thai community at RPI.
It is their support and help that settled me in Troy quickly. Over the years, we lend
our hands to help each other, and I am deeply touched by their warm hearts. My
deep gratitude goes to P’ Tek and P’ Sye who always care and look after me. P’
Tek always shows his calm, coolness and vast knowledge. P’ Sye always shows her
concerns and gives consolation when I am deeply in trouble. I also wish to thank
P’ Lek, P’ Ple, P’ Fluke, and On, who shared laughs and funs with me over their
minute but seemingly long time in RPI, and P’ Bam who took trouble organizing
Thai parties. I wish to thank N’ Chalee, N’ Tum, and, especially, N’ Charn and his
family who offered me to stay in his apartment during my final preparation for the
defense. With these young bloo ds, we always enjoy time for Friday dinners together.
I wish all of them to have bright future and eternal success.
I am thankful for my great friends who give me their wholehearted support
even though they are in Thailand or in other states. My gratitude is due to Dabu,
Somphop, O, Joe, N’ Thom, N’ Add, and, especially, MSN who provides us ways
for communication.
I am extremely indebted to my girlfriend, AM, who over the years has to en-
dure some of my burden. She always gives her kind heart, warm support, tender
xiii
love, unconditional understanding, extreme patience, and tremendous care. Every
moment with her is always an extremely joyful experience and a very precious mo-
ment.
I owe the most to Luang Por Sodd, Luang Puu Fueng, Por Than Klai, Pra
Ajan Punya and Khun Yai Tritha Niumkhum who always guide me spiritually and
give me my inner strength. It is through them that I learn how to mediate and
understand how beautiful and precious the inner peace can be. I would also like to
thank my parents’ friends at Wat Pak Nam who wholeheartedly support and care
for my study.
My dissertation would not be possible without my parents. Their uncondi-
tional love helps me through times of trouble. Their encouragement brings me
inspiration. Their consolation gives me strengths. Their support and understand-
ing fire my will to fight. I cannot imagine how this dissertation will be possible
without them, and I hope I bring them proud. I also wish to thank every member
of my family who always believe in me. Special thanks go to Aunt Nhing, N’ Unn,
and N’ Heart who constantly correspond with me via e-mails. I am also grateful for
my dear N’ Kaew and N’ Keng who kindly accompany and take care my parents
when I am not in Thailand. I would like to dedicate my dissertation to Khun Yai
Tritha and my loving parents.
It is not possible to thank everybody in such a tiny space, and I would like
to take this opportunity to thank whoever crossed to and came into my life but I
failed to mention.
xiv
ABSTRACT
Long-term service agreements (LTSAs) for the maintenance of capital-intensive
equipments, such as, gas turbines, medical equipments, aircraft and locomotive en-
gines, are gaining wide acceptance. A typical LTSA contract spanning a period of
5-20 years makes a provider be responsible for fully maintaining customers’ equip-
ments. Effective management of LTSAs is very important, since these equipments
are vital to the basic infrastructure and the economy of a country. This disserta-
tion develops a rigorous framework for effectively managing the service delivery of
LTSAs. Without a rigorous framework, the provider is exposed to extensive losses
and endangers end-consumers’ lives.
LTSAs combine several features of many problems, such as, service operations
management, maintenance management, scheduling management, inventory man-
agement, and financial management. These problems are very well known and are
studied extensively in the literature. However, these problems are often addressed
separately. Our dissertation attempts to bridge these various disciplines through the
perspective of risk management and assessment framework. The created integrated
risk management framework focuses on strategic risks of the service delivery from
the provider’s perspective, since the provider plays the most critical role in creating
the service. The framework allows us to develop an optimal service delivery strategy
which provides the most reliable and top quality of service, meets the customer’s
requirements, reduces potential losses and risks with minimal costs while constantly
looking towards improving profitability.
The framework begins by identifying potential sources of risks of the service
delivery. After thorough identification of risks, we find a strategically optimal main-
tenance strategy for a multi-component product focusing only on product risks.
Once we completely understand product risks, we integrate service risks into the
framework where we attempt to develop an optimal service delivery strategy for
LTSAs. We further enhance the framework by taking financial risks into account
and develop an optimal buy and hold strategy which minimizes financial risks while
xv
fulfilling customer’s requirements with minimal costs. Finally, we streamline deci-
sions made at strategic business level to vigilantly develop a maintenance schedule
for the equipments, a corresponding inventory plan, and a resource management so
the costs are minimized.
xvi
CHAPTER 1
Introduction
In today’s services oriented economy, providing better services to customers is unde-
niably proving to be one of the main strategies even for organizations traditionally
known to be manufacturers, such as, General Electric (GE) Company, United Tech-
nologies Corporation, etc. A particular service these traditional manufacturers are
providing is service agreements bundled with their high cost, high technology, and
long-lived products, e.g., locomotive engines, medical equipments, gas turbines, and
aircraft engines. Such an agreement is intended to give customers assurances and/or
ease of use of the products over an extended contract period running up to several
decades. Long-term service agreements (LTSAs) are also provided by third party
service companies, who do not necessarily be manufacturers of the products. We
collectively call companies delivering this particular service in this dissertation as
providers.
LTSAs offer a guarantee of the level of output generated from a product. For
instance, GE sells aircraft engines bundled with long-term service agreements to
United Airlines. United Airlines takes advantage of the service provided by the
provider to improve its flight service quality. Hence, the provider sells not only its
products but also the ‘functionality’ of the products. Bound by the contract, the
provider is entitled to maintain the product in order to deliver the required function-
ality. Thus, the physical product (e.g., aircraft engine) only facilitates the service
delivery. The provider fulfills its service delivery when the product functions at a
specified level defined in the contract. The dissertation mainly focus on developing
a framework to analyze the service part of the service delivery.
Practices as seen in Figure 1.1 are common in LTSAs. A customer purchases
a product bundled with an LTSA from a provider. The provider guarantees the
functionality of the product. The provider is responsible for maintaining and re-
pairing the product for the customer over a specified period of time in exchange
for a fee. The customer must accept constraints on how he can operate, allow real-
1
2
Figure 1.1: Infrastructure of LTSAs
time access to the product sensor data, and permit the provider to maintain the
product. In this dissertation, some important strategic management problems for
an efficient and effective delivery of long-term service agreements to customers from
the provider’s point of view are addressed.
1.1 Problem Background
Long-term service agreements are widely used and are gaining popularity
among several manufacturers and/or third party service companies. These ser-
vice agreements are either sold separately or bundled with products making the
provider be responsible for delivering the products’ functionality. Often the prod-
ucts under LTSAs are high cost, high technology, long-lived, vital to economy and
provide critical infrastructure to the country. Moreover, the product’s maintenance
cost is almost comparable to the product’s manufacturing cost. Products also need
significant knowledge base and infrastructure to support the service delivery process.
The service agreement offers a well-crafted contractual specification for a spe-
3
cific product with a specified price, leading to planned and/or unplanned mainte-
nance of the product by the provider. The agreement usually runs for 5-20 years.
The service generally includes all part replacements, repairs, equipment settings,
and labor costs. The long-term service agreement is also often stated as a guarantee
of products’ output per unit time and the expectation of near-zero downtime due
to failures under some specified conditions.
Many industries, e.g., airline business and car manufacturers, take advantage
of LTSAs to reduce their maintenance cost, increase customer’s satisfaction, and gain
competitive edge over its rivals. It is estimated in Davies [122] that maintenance,
repair and overhaul (MRO) for world wide airline business is worth $38 billion in
2005 compared to $34 billion in 2003. About 50% of MRO works for US commercial
airlines are being outsourced to domestic and international contractors. By 2013,
the North American MRO business is expected to grow in revenue by $21.5 billion
[300]. The FAA expects that by 2010 70% of MRO will be outsourced to third
parties [145].
United Airlines and Delta Airlines, among others, outsource their MRO pro-
gram to third party service companies. As reported in USA Today, Mar 30, 2005,
Delta Airlines expects to save $240 million over five years by outsourcing mainte-
nance of its 344 jetliners. AAR Corp. could generate up to $50 million annually from
providing regular maintenance for 137 of United’s Boeing 737 jets, as reported in
Crain Chicago Business, Mar 7, 2005. Meanwhile, commercial airlines have reduced
their mechanics and maintenance staff from 4400 in 2004 to 2600 in the beginning
of 2005. Not only are commercial airlines outsourcing their maintenance program to
third parties, government sectors are also outsourcing their maintenance program.
“Lockheed Martin [LMT] has been awarded a $6.5 million contract by the Brazilian
government to provide comprehensive logistics support services for its six navy A-4
aircrafts and ten J52-P408 engines. LMT will provide maintenance services such as
engine overhaul, flight line and deport level maintenance for the A-4s, and on the
job training for technicians from the Brazilian Navy.” (Potomac, May 10, 2005.)
The MRO in the aircraft business is mainly driven by following four factors
[300].
4
1. Increasing in demand for flights in a global marketplace.
2. Growth of low-cost airlines that outsource their majority of maintenance.
3. Refocusing core business by big and legacy airlines and, thus, sending more
maintenance work to third parties.
4. Overall aging of airline fleets.
Not only are manufacturers of aircraft engines offering long-term service agree-
ments for aircrafts, car manufacturers are also providing service contracts to cus-
tomers for maintaining their loyalty and increasing satisfaction. Autobytel.com
Inc., signed an agreement with Toyota Motor Corp., to make Toyota’s Extra Care
extended-service contracts on the Japanese car maker’s vehicles purchased through
Autobytel.com (Wall Street Journal, Jul 7, 1999). Ford Motor Co., (on Jun 10,
1999) agreed to buy Automobile Protection Corp., the administrator of Easy Care
Vehicle Service contracts sold mainly through dealerships, for 180 million dollar as
part of a push to keep customers after they buy a car or a truck (NY Times, Jun
11, 1999). Saturn uses its after service program to deliver better service and gains
more customer loyalty [116].
Besides these two industries, long-term service agreements are offered under
various names, forms, and types of products. For example, General Electric (GE)
Company now sells service contracts for products, such as, jet engines, medical-
diagnostic machines, and power systems. United Technologies Corporation’s Pratt
& Whitney offers service guarantees under the brand name “Fleet Management
Programs”, while GE sells its jet engines with a 10-15 year service agreement under
GE’s “Maintenance Cost Per Hour”.
According to the above news items, long-term service agreements are gaining
more popularity with the goal of being beneficial to both customers and providers.
The obvious benefits of LTSAs are:
• It reduces maintenance, repair, and spare part inventory costs for customers,
since an LTSA gives all responsibility to maintain a product to a provider.
5
• It hedges the customers’ risks of owning and using a product if they are not
specialists in maintaining the product.
• It attempts to maximize availability of a product for a customer’s usage.
• It generates a new stream of revenues for a provider.
• It establishes a long-term relationship between a customer and a provider,
thus, enhancing customer loyalty for the provider.
• It increases an entrants’ barrier to the provider’s business.
• Finally, it benefits the whole economy by increasing productivity and safety.
However, the above benefits are realized only if the service is delivered satisfactorily.
1.2 Motivation of the Research
While long-term service agreements (LTSAs) are being offered and are used
to gain a new and steady stream of revenues for a provider, the provider faces sev-
eral challenges and risks in order to effectively deliver the service and manage an
instant of an LTSA as well as a portfolio of LTSAs. These challenges include de-
signing appropriate products and services, creating proper infrastructure supporting
the delivery of LTSAs, developing operations and business strategies that are both
strategically and tactically efficient, and drafting a mutual service contract.
1.2.1 Challenges in Managing a Portfolio of LTSAs
1.2.1.1 Product and Service Designs
Long-term service agreements change the concept of design for reliability,
serviceability, and safety of products because LTSAs add the responsibility on a
provider for maintaining the product’s functionality. Moreover, the provider and
the customer usually co-pro duce maintenance service of a product together. The
design process needs to include interactions and communications between a manu-
facturer (provider) and a customer in order to effectively address and successfully
respond to the customer’s requirements and improvements.
6
There are two levels of customer’s involvement in the design process, i.e., a
standardized design and a unique design. A standardized design is when the provider
alone determines the product features with some possible but limited customer’s
specific modifications. Therefore, the provider can accurately estimate the future
performance of the product. As a result, a standardized design is less risky than a
unique design. A unique design is when the customer is completely integrated in
the realization of the product and service design process. In this case, the provider
cannot accurately estimate the performance of the product and may want to share
the risks involved in the service delivery with the customer.
The product only facilitates the service delivery. The provider completes its
service after the product functions and generates outputs as specified in the con-
tract. The provider has to design its service delivery process that effectively and
inexpensively delivers the required functionality of the product in order to create
successful and profitable long-term service agreements. The service delivery needs
to be consistent with the firm’s strategy, meet customer’s needs in a responsible
manner, and establish a strong relationship with the customer.
In general, the service delivery provided includes maintenance schedules, repair
specifications, operating conditions, and guidelines for operations and for failures
and breakdowns. The provider also needs to plan for logistics, labor, infrastructure,
and inventory in order to deliver the service efficiently. These plans depend largely
on the reliability of the product. Fault Tree Analysis (FTA) and Failure Modes
and Effects Analysis (FMEA) are among the techniques used at the design stage
to achieve improved reliability and serviceability of the product. Besides variety
of factors that product and service design needs to care for, the design of product,
service, and their pertinent service components must be a proper combination of
quality and cost.
1.2.1.2 Service Infrastructure
Service infrastructure supports the delivery of LTSAs. The service infrastruc-
ture includes a monitoring system, a maintenance system, and a supply chain man-
agement system. These three systems help the provider maximize the functionality
7
and the availability of the product, and respond to problems, e.g., product’s failure,
faster.
Once a product is installed at a customer site, the provider needs to monitor
its performance by performing diagnostic and prognostic tests. The performance
of the product depends primarily on the condition or the health of the product.
To observe the condition or the health of the product, sensors and Information
Technology infrastructure are put in place. A monitoring system, for example,
Health and Usage Monitoring Systems (HUMS) in aircrafts, is usually embedded
in the product so as to alert the provider if the product shows suspicious behavior
indicating proneness to failure [211]. The monitoring system helps the provider
better assess and/or identify the cause of suspicious behaviors more accurately.
A condition based maintenance (CBM) approach is widely implemented in
practice in order to correctly estimate the condition of a product. A condition based
maintenance system usually includes a sensor module, a signal processor module, a
condition monitoring module, a health assessment module, a prognostic module, a
decision support module, and a presentation module [62]. In order to successfully
implement CBM, issues corresponding to these modules, such as in Table 1.1
1
, must
be addressed.
Table 1.1: Challenges in CBM
Module Description Challenges
Sensor
Measure parameters such as • Lack of robust sensors
temperature, pressure, vibration, etc., • High false alarm
to determine the condition of a system
Signal Process
Manipulate and extract data for • Detection and characterization
the desired information of rare events
• Eliminating noise
Condition monitoring
Compare features against expected • Real-time processing limitations
value or operational limits and output
enumerated conditions.
Health assessment
Determine current health of • Lack of fusion models for CBM
system or components • Lack of synchronous data
Prognoses
Predict future health of system • Lack of predictive models
taking into account estimates of past
operations profiles
Decision Support
Automated decision making using patterns • Need to combine implicit
in the signal(s) or feather(s) and explicit reasoning
• Hierarchical reasoning
Presentation
Display information and results to users • Clear presentation that
is easy to understand
1