Tạp chí khoa học Công nghệ và Thực phẩm Tập 22 Số 2
Bạn đang xem bản rút gọn của tài liệu. Xem và tải ngay bản đầy đủ của tài liệu tại đây (19.96 MB, 165 trang )
TẠP CHÍ KHOA HỌC CƠNG NGHỆ VÀ THỰC PHẨM
Tập 22 - Số 2 (6/2022)
MỤC LỤC
1.
Vo Thuy Vi - Adsorption of methylene blue on wastes from
lemongrass leaves after essential oil extraction.
3
2.
Tran Hoai Lam, Nguyen Van Hoa, Tran Thi Thanh Truc, Truong
Tien Dung, Le Minh Hoa, Nguyen Phan Duyen Nu, Giang Ngoc Ha,
Nguyen Hoc Thang - Characteristics and phenol red adsorption
capacity in aqueous solutions of SBA-15 adsorbent synthesized from
the ash of brickyard.
11
3.
Tran Thi Thuy Nhan, Tran Thi Ngoc Mai, Truong Thi Dieu Hien,
Nguyen Thi Tra Mi, Nguyen Thi Thanh Thao - Assessment of GHGs
emission from different cow-pat treatment methods and
effectiveness of EM supplementation.
22
4.
Hoàng Vũ Thu Phương, Vũ Quang Mạnh, Nguyễn Phan Hoàng Anh,
Sakkouna Phommavongsa, Bùi Minh Hồng - Nghiên cứu bước đầu
về thành phần lồi và phân bố của nhóm động vật hình nhện
(Arachnida) ở thị trấn Tuấn Giáo, tỉnh Điện Biên.
31
5.
Nguyễn Vũ Hoàng Phương, Lê Minh Thành, Trần Thanh Tú, Nguyễn
Thị Thu Thảo, Bùi Thị Ngọc Hà, Huỳnh Thị Thanh Tuyết - Nghiên
cứu xử lý chất thải hữu cơ bằng ruồi lính đen (Hermetia illucens)
quy mơ phịng thí nghiệm.
41
6.
Đào Thị Mỹ Linh, Nguyễn Thị Quỳnh Mai, Bùi Thiên Kim Thu,
Nguyễn Đình Triều Vũ, Nguyễn Đăng Khoa, Sơn Thiên Nga, Kiều
Yến Vy, Trần Quỳnh Hoa - Nghiên cứu ảnh hưởng của các yếu tố
mơi trường ni cấy tới q trình sinh chitinase từ nấm mốc
(Aspergillus sydowii).
52
7.
Nguyễn Thị Thùy Dương, Nguyễn Ngọc Tuấn - Biến động một số
yếu tố khí tượng và hải dương học nghề cá vùng biển vịnh Bắc Bộ
giai đoạn 1/2019 - 6/2021.
63
8.
Phan Thế Duy, Nguyễn Thành Văn, Võ Thị Dâng Dâng, Đỗ Văn
Thanh - Đánh giá khả năng ứng dụng thiết bị sấy vi sóng chân khơng
dựa trên sự biến đổi các thành phần dinh dưỡng ở khoai lang tím.
75
1
9.
Nguyễn Thuần Anh - Đánh giá kiến thức, thái độ và thực hành vệ
sinh an toàn thực phẩm của hộ trồng rau ở Khánh Hịa.
83
10.
Trần Thị Anh Đào, Nguyễn Hồng Dâng - Xây dựng bảng cỡ số áo
polo shirt cho nữ sinh viên Khoa Công nghệ May và Thời trang HUFI
nhằm mục đích giảng dạy.
96
11.
Phạm Ngọc Nam, Nguyễn Thị Ánh Nguyệt, Lê Quang Nghĩa,
Nguyễn Hà - Nghiên cứu chế độ uốn gỗ cao su để sản xuất chi tiết
cong cho sản phẩm mộc.
107
12
Phạm Minh Nguyệt - Nghiên cứu khả năng hấp phụ chất khí của
borophene pha tạp nguyên tử kim loại: tính tốn mơ phỏng bằng
DFT.
117
13.
Lê Thể Truyền, Nguyễn Minh Huy, Nguyễn Tấn Ken, Mai Văn Nam
- Thiết kế các kích thước của rơ-bốt delta dựa trên khơng gian làm
việc.
124
14.
Bùi Văn Hiền, Trương Việt Anh, Dương Văn Khải - Giải pháp đa
tầng trong theo dõi điểm phát công suất cực đại toàn cục của hệ thống
pin quang điện trong điều kiện bóng che một phần.
136
15.
Nguyễn Thị Thu Tâm, Đinh Nguyễn Trọng Nghĩa - Ẩn tập phổ biến
dựa trên phương pháp quy hoạch tuyến tính nguyên kết hợp với biên
dương lý tưởng.
153
2
Journal of Science Technology and Food 22 (2) (2022) 3-10
ADSORPTION OF METHYLENE BLUE ON WASTES FROM
LEMONGRASS LEAVES AFTER ESSENTIAL OIL EXTRACTION
Vo Thuy Vi
Ho Chi Minh City University of Food Industry
Email:
Received: 6 January 2022; Accepted: 6 May 2022
ABSTRACT
In this study, a biosorbent from lemongrass leaf after the distillation of essential oil was
prepared by the alkali treatment with NaOH 10%. The removal of Methylene blue (MB) was
tested under the following conditions: adsorbent dose (0.02-0.4 mg), pH (2-10), and dye
concentration (20 and 100 mg/L). When the adsorbent dose and pH were raised, the percentage
removal and adsorption capacity of dye increased. The kinetic studies revealed that the MB
adsorption process complied with the pseudo-second-order model with a 30-min adsorption
equilibrium. The percentage removal and adsorption capacity of MB at a concentration of 20
mg/L were 90.9% and 6.30 mg/g at the adsorbent dose of 0.1g in 30 min. According to the
findings, alkali-treated lemongrass waste is an inexpensive and effective biosorbent in treating
dye wastewater.
Keywords: Biosorbent, lemongrass, adsorption, methylene blue.
1. INTRODUCTION
The textile and garment industry is a core industry in many economies, accounting for
7% of global export trade, worth $1400-1550 billion USD, and employing over 35 million
people worldwide [1]. Nevertheless, the textile industry also contributes significantly to
environmental pollution. Textile dyeing procedures use a lot of water throughout the
manufacturing process, and the wastewater generated varies between 12 and 300 m 3/ton of
cloth. Textile dyes are now available in over 10,000 types [1]. Methylene Blue (MB) is a
popular cationic dye that has been identified as being more harmful than other anionic dyes [2].
This is a synthetic dye that dissolves in water to produce a blue solution that is difficult to
remove. According to previous reports, dye-containing wastewater can block light and impede
photosynthesis, increase chemical and biological oxidation demands, impede organism growth
and reproduction, and have a negative impact on photosynthesis. Methylene blue can cause
skin allergies, nausea, and breathing problems [2, 3]. As a result, water pollution from dyecontaining wastewater and dye adsorption for wastewater treatment has gotten a lot of
attention.
Many techniques have been employed to remove these contaminants, including
nanofiltration, reverse osmosis, electrolytic deoxidation, aerobic treatment, and adsorption.
Adsorption, one of the most effective dye removal processes, has several advantages over
other methods, including a lower cost, a simpler process, and complete dye removal [4].
Agricultural wastes such as bagasse, corn cobs, orange peels, and coconut shells are commonly
utilized as adsorbents to remove dyes due to their inexpensive cost, abundance, high
adsorption capacity and speed, and selectivity [4-6].
3
Vo Thuy Vi
In the last two years, Coronavirus disease (COVID-19) has emerged as a global health
threat. Lemongrass (Cymbopogon citratus) contains 1-2% essential oil, 39.5% cellulose,
22.6% hemicellulose, and 28.5% lignin [7]. Lemongrass essential oil, which is a mixture of
volatile compounds, has antibacterial, antifungal, and antiviral properties. Due to its benefits,
lemongrass oil is used as a COVID prevention method, resulting in a significant amount of
lignocellulose-containing waste after distillation. The functional groups in cellulose fibers,
such as hydroxyl and carboxyl, participate in the formation of covalent bonds with the
chromogenic groups of dye molecules. Therefore, MB molecules were kept on the cellulose
surface. As a result of the good adsorption characteristics of cellulose materials, lemongrass
leaves are a viable choice for dye adsorption. Previous studies focused on MB adsorption by
activated carbon from lemongrass leaves using a 500 oC - 600 oC thermal treatment [8, 9].
However, this method necessitates a complex treatment process, resulting in a high price for
activated carbon. Furthermore, it is difficult to separate activated carbon from the water after
dye adsorption, posing a risk to many living organisms. In this study, cellulose-containing
lemongrass waste was chemically treated with a caustic soda solution to investigate methylene
blue adsorption in water. The goal is to introduce a simpler and more effective method of
treating biosorbents used in dye adsorption. This helps to reduce treatment time and increase
the reuse of agricultural waste. This alkali treatment of lemongrass leaves has been rarely used,
particularly in terms of methylene blue adsorption [8]. Furthermore, SEM and XRD
measurements were used to evaluate the surface properties and identify the crystallinity of
cellulose. To determine the adsorption mechanism, the adsorption kinetics and factors such as
adsorbent dosage, pH, and dye concentration were investigated.
2. MATERIALS AND METHODS
2.1. Adsorbent preparation
Lemongrass is cultivated on a farm in Taiwan's Tainan province. After distillation,
lemongrass leaves were dried overnight at 60oC to make the adsorbent. These lemongrass
leaves were alkali-treated to eliminate lignin. The elimination of lignin aids in increasing
cellulose concentration and improving the material's surface characteristics for improved
pigment adsorption [10]. The preparation steps of the biosorbent were described as follows.
Lemongrass leaves after distillation were powdered, milled, and sieved to obtain sizes ranging
from 250 µm to 1000 µm. Lemongrass leaves were stirred for 2 hours at 90oC in a vessel
containing a 10% NaOH solution. The ratio of lemongrass mass to the volume of NaOH
solution was kept constant at 1:25 (w/v). After alkalinizing, the lemongrass leaves were rinsed
many times with deionized water until the pH was neutral, then dried for 24 hours at 60oC.
Lemongrass leaves after alkali treatment were named TLG.
2.2. Absorbent characterization
The characteristics of TLG material before and after dye adsorption were examined using
a scanning electron microscopic (SEM) analysis and X-ray spectroscopy (XRD). The surface
morphology of absorbents was investigated by scanning electron microscopy (SEM) (Hitachi
SU8010). A small amount of adsorbent was placed on the specimen stub and coated with a
thin gold layer by a DC sputter coater (AGAR B7340, Agar Scientific, Stansted, UK). The
adsorbent was then imaged at a 110KV accelerating voltage with a 10 mm working distance
and magnifications of ×2500 were applied. XRD measurements were carried out with an
Ultima IV diffractometer (Rigaku Americas Corp., USA) equipped with a Cu-target tube at
wavelengthλ = 0.1540 nm. Diffractograms were collected at 2θ ranging from 5º to 65º with
a scan step of 0.02º. The crystallinity index (CrI %) of TLG was determined by Eq. (1) [11].
4
Adsorption of methylene blue on wastes from lemongrass leaves …
𝐶𝑟𝐼(%) =
𝐼002 −𝐼𝑎𝑚
𝐼002
× 100 (Eq. 1)
where I002 is the maximum intensity of the crystalline peak ((22° < 2θ < 23°) and Iam is the
scattered intensity of the amorphous peak (18° < 2θ < 19°) of the sample.
2.3. Preparation of MB adsorbate
The appropriate quantity of methylene blue (analytical grade, Sigma Aldrich 46465224)
was dissolved in distilled water to make a stock solution (1000 mg/L). Solutions of various
concentrations (1, 2, 4, 8, and 10 mg/L) were prepared by a serial dilution process of the initial
stock solution. For all experiments, the MB concentration was determined by a UV-visible
spectrophotometer (CT-2200 spectrophotometer, Germany) at a wavelength of 665 nm.
2.4. The influence of adsorbent dose and pH
The following steps were used to test the effect of the adsorbent dose. In Erlenmeyer
flasks containing 40 mL of 20 mg/L MB solution, different amounts of TLG adsorbent (0.02,
0.06, 0.1, 0.2, 0.3, and 0.4 gram) were added. The sample was shaken at 25 oC at 150 rpm and
then put into a thermostatic shaker. Aqueous solutions were obtained after two hours of
adsorption. The percentage removal H (%) and the adsorbed amount Q (mg/g) of MB on TLG
were calculated following Eqs. (2)-(4) [8, 9].
𝐻(%) =
𝐶0 −𝐶𝑡
𝐶0
𝑄𝑡 (𝑚𝑔/𝑔) =
𝑄𝑒 (𝑚𝑔/𝑔) =
× 100 (Eq. 2)
𝐶0 −𝐶𝑡
𝑚
𝐶0 −𝐶𝑒
𝑚
× 𝑉 (Eq. 3)
× 𝑉 (Eq. 4)
where Co, Ct and Ce (mg/L) are the liquid-phase concentrations of MB at the initial time, time
t, and the equilibrium state, respectively. V (mL) is the volume of the MB solution, and m is
the weight of the adsorbent (g). Qe and Qt (mg/g) are the amounts of MB adsorbed per weight
of TLG at the equilibrium state and at time t, respectively.
On the other hand, pH changes the charge on the surface of the adsorbent and thus affects
its dye adsorption capacity. The adsorption of 20 mg/L MB solution with pH values ranging
from 2.5 to 10.5 by TLG was investigated. The pH of the MB solution was adjusted using
sodium hydroxide (NaOH) and hydrochloric acid (HCl), both from Labscan (Thailand). A
properly weighed amount of TLG (0.1 g) was added to an Erlenmeyer holding 40 mL of MB
(20 mg/L) at the appropriate pH. The adsorption procedure was followed in the same way as
the experiment to determine the adsorbent dose. All experiments were performed in triplicate.
2.5. Kinetic studies
A fixed amount of TLG (0.1 g) was added to twelve Erlenmeyer flasks containing 40 mL
of dye. The effect of dye concentration on adsorption kinetics was investigated at 20 mg/L and
100 mg/L of MB. The Erlenmeyer flasks were firmly covered and held at a constant
temperature of 25 oC in a thermostatic shaker with 150 rpm. The absorbance of the MB
solution in Erlenmeyer was then measured between 0 and 180 min. The rate constants and
other parameters for the kinetic data were calculated using the kinetic equations of the first
and second-order reactions, as demonstrated in Eqs. (5) & (6) [12]:
5
Vo Thuy Vi
𝑙𝑛 (𝑄𝑒 − 𝑄𝑡 ) = 𝑙𝑛𝑄𝑒 − 𝑘1 𝑡 (Eq. 5)
𝑡
𝑄𝑡
=𝑘
1
2
2 𝑄𝑒
1
+ 𝑄 𝑡 (Eq. 6)
𝑒
where k1 (min-1) and k2 (g mg-1min-1) were respectively the adsorption rate constant of the
pseudo-first order and pseudo-second order models.
3. RESULTS AND DISCUSSION
3.1. Characterization of absorbents
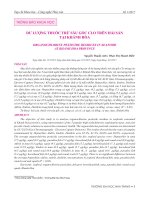
The surface shape of TLG before and after MB adsorption can be seen in Figure 1. Before
adsorption, the surface of the alkali-treated lemongrass leaves (TLG) was rough fibers with
cellulose-like characteristics. This observed behavior was similar to the findings of Putri et al.
[4]. These fibers formed thin layers by stacking them up in a disorderly manner. The irregular
rough structure and pores play an important role in dye adsorption [13]. After MB adsorption,
the surface morphology of TLG became rougher than before, and there was an aggregation of
MB particles on the surface of the material.
(a) TLG before adsorption
(b) TLG after adsorption
Figure 1. SEM images of adsorbent (a) before and (b) after MB adsorption.
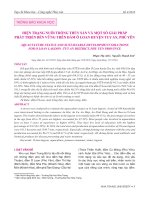
The X-ray diffractograms for TLG are shown in Figure 2. The diffraction peaks of TLG
at 2θ values of 15.9° (101), 22.5° (002), and 34.9° (040) are similar to cellulose characteristic
peaks [4]. From equation 2-1, TLG has a crystallinity index of 78%.
Figure 2. XRD patterns of TLG before and after adsorption
6
Adsorption of methylene blue on wastes from lemongrass leaves …
3.2. Effect of adsorbent dose and pH on adsorption
The adsorbent dose has a direct impact on the adsorbent's surface area and the number of
active adsorption sites. Figure 3 shows the effect of TLG doses ranging from 0.02 to 0.4 g on
MB adsorption at a concentration of 20 mg/L. As the adsorbent dose increased from 0.02 to
0.3g, the amount of MB removed increased. This is because more active adsorption sites
become available as the adsorbent's mass increases. The percentage removal of MB was nearly
unchanged with a dose increase from 0.3g to 0.4g at MB 20 mg/L, owing to the fact that the
number of free binding sites exceeded the number of MB molecules. The formation of
hydrogen bonds between the hydroxyl group of cellulose and the nitrogen atom of the MB
seems to contribute to the adsorption capacity. According to this finding, as the dose of TLG
was increased, the percentage removal increased and the adsorption capacity decreased.
Figure 3. Effect of adsorbent dose on the percentage removal and adsorption capacity.
The pH changed the surface charge of the adsorbent, causing changes in the adsorption
capacity of MB. Fig. 4 shows the adsorption capacity of the TLG toward MB at various pH
values (2.5, 3.5, 5.0, 6.5, 8.5, 9.5, and 10.5). A significant increase in MB sorption was
observed as the pH increased from 2.5 to 6.5, while further increasing the pH value from 6.5
to 10 resulted in a slight change in sorption. As illustrated in Fig. 4, the lowest removal
percentage was observed at pH 2.5 (9.30%) and the highest percentage of removal was 92.4%
at pH 10.5. The removal of MB dye from TLG was found to be pH-dependent, which is
consistent with previous studies [4, 8]. As the pH increased, the active adsorbent sites
deprotonated, promoting electrostatic interaction between the positively charged cationic
methylene blue molecules and the negatively charged surface of the adsorbent. In this study,
pH 6.5 was selected because it was the pH of the MB solution that did not need to be modified.
As a result, all subsequent adsorption studies were carried out at pH 6.5.
100
10
80
8
60
6
40
4
20
2
0
Q (mg/g)
H (%)
H (%)
Q (mg/g)
0
4
6
8
10
pH
Figure 4. Effect of pH on the percentage removal and adsorption capacity.
7
Vo Thuy Vi
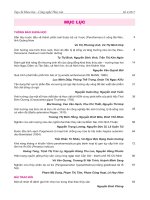
3.3. Adsorption kinetics
The effect of contact time on the adsorption of MB is shown in Figure 5. During the first
30 min, at both MB concentrations tested, adsorption increased swiftly and gradually. The
adsorption capacity achieved equilibrium after 30 min. The huge number of active sites on the
material surface caused a quick increase in the rate of adsorption at the first stage, resulting in
a high adsorption capacity. However, as the number of active sites decreased and the adsorbent
lost its ability to adsorb MB, the adsorption capacity was nearly unchanged, reaching 6.3 mg/g
and 18.6 mg/L, respectively, for MB concentrations of 20 and 100 mg/L. As the MB
concentration increased, the amount of MB adsorbed increased until the maximum adsorption
capacity of the biosorbent was reached.
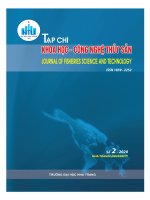
Pseudo-first-order and second-order models were demonstrated in these plots in Fig. 6
and values of Qe and rate constants were presented in Table 1. The computed findings revealed
that the coefficient of determination (R2> 0.995) in the second-order model was higher than
that in the pseudo-first-order model at all MB concentrations. Furthermore, the Qe values
calculated from equation 6 were closer to the experimental Qe value. Hence, pseudo-secondorder kinetic was the best way to describe the adsorption process. The chemical sorption occurred
due to the formation of hydrogen bonding between the hydroxyl group on the cellulose surface and
the nitrogen of MB [13]. Furthermore, the insignificant difference in the adsorption rate
constant at both MB concentrations in the pseudo-second-order models (k2) pointed out that
the adsorption rate depended on the number of adsorption sites available on the TLG surface
rather than the quantity of MB dye molecules adsorbed.
16
14
Q (mg/g)
12
MB 20 mg/L
MB 100 mg/L
10
8
6
4
2
0
0
20
40
60
80
100 120 140 160 180 200
Contact time (min)
Figure 5. Effect of contact time on MB dye adsorption capacity
5
6
MB 20 mg/L
MB 100 mg/L
(a)
4
3
4
2
t/Qt
ln(Q
e-Qt)
Q (mg/g)
MB 100 mg/L
MB 20 mg/L
5
1
(b)
3
2
0
1
-1
0
-2
0
5
10
15
20
25
Contact time (min)
0
10
20
30
Contact time (min)
Figure 6. Kinetic plots for MB adsorption (a) pseudo-first order, (b) pseudo-second order model.
8
Adsorption of methylene blue on wastes from lemongrass leaves …
Table 1. Kinetic parameters of MB adsorption onto TLG
Model
Parameter
Experiment
Pseudo-first-order
CMB(mg/L)
20
100
Qe (mg/g)
6.3047
13.8643
Qe (mg/g)
3.1267
25.9196
k1 (min-1)
0.1039
0.1889
0.9511
0.6217
6.6401
14.084
0.007
0.005
0.9954
0.9952
2
R
Qe (mg/g)
Pseudo-second-order
-1
-1
k2 (g.mg min )
2
R
In comparing the Qe value in this study to Ahmad's study [9], we recognized that, while
the Qe of the TLG biosorbent was low (13.864 mg/g at MB 100 mg/g), the adsorption
equilibration time was short, lasting only 30 minutes. In contrast, in Ahmad's study, the
adsorption of MB 100 mg/L on lemongrass activated carbon reached equilibrium with Qe at
43.931 mg/g after 24 hours [9].
4. CONCLUSION
A new biosorbent was successfully prepared from lemongrass waste after distillation of
essential oil. Lemongrass leaves are stirred for 2 hours at 90 oC in a vessel containing a 10%
NaOH solution. SEM and XRD results indicated that the functional groups of cellulose and
irregular rough surface of fibers contributed to the adsorption process. The removal of dye
from cellulose-containing lemongrass waste was 90.9%. The adsorption capacity is 6.30 mg/g,
which corresponds to the experimental conditions of pH 6.5, 0.1 g adsorbent dose, and 30-min
quick equilibrium time. The results show that alkali treatment with NaOH for lignocellulosederived materials is a simple method that requires no complicated equipment, has a short
fabrication time, and has a low adsorbent dose. Lemongrass waste has the potential to be a
low-cost, abundant and effective biosorbent source in environmental treatment.
REFERENCES
1. Chequer F. D., De Oliveira G. R., Ferraz E. A., Cardoso J. C., Zanoni M. B., & De
Oliveira, D. P. - Eco-friendly textile dyeing and finishing, chapter 6- Textile dyes: Dyeing
Process and Environmental Impact (2013) 151-176.
2. Choi H.-J., Yu S.-W. - Biosorption of methylene blue from aqueous solution by
agricultural bioadsorbent corncob, Environmental Engineering Research 24 (1) (2019)
99-106. />3. Gong R., Li M., Yang C., Sun Y., and Chen J. - Removal of cationic dyes from aqueous
solution by adsorption on peanut hull, Journal of Hazardous Materials 121 (1-3) (2005)
247-250. />4. Putri K. N. A., Keereerak A., and Chinpa W. - Novel cellulose-based biosorbent from
lemongrass leaf combined with cellulose acetate for adsorption of crystal violet,
International Journal of Biological Macromolecules 156 (2020) 762-772.
/>
9
Vo Thuy Vi
5. Saiful Azhar S., Abdul Ghaniey Liew A., Suhardy D., Farizul Hafiz K., and Hatim M. I.
- Dye removal from aqueouus solution by using adsorption on treated sugarcane bagasse,
American Journal of Applied Sciences 2 (11) (2005) 1499-1503.
6. Jayarajan M., Arunachalam R., and Annadurai G. - Use of low cost nano-porous materials
of pomelo fruit peel wastes in removal of textile dye, Research Journal of Environmental
Sciences 5 (5) (2011) 434. />7. Bekele L.D., Zhang W., Liu Y., Duns G.D., Yu C., Jin L., Li X., Jia Q., and Chen J. - Preparation
and characterization of lemongrass fiber (Cymbopogon species) for reinforcing
application in thermoplastic composites, BioResources 12 (3) (2017) 5664-5681.
8. Singh H. and Dawa T. B. - Removal of methylene blue using lemon grass ash as an
adsorbent, Carbon letters 15 (2) (2014) 105-112.
/>9. Ahmad M. A., Ahmed N. A. B., Adegoke K. A., and Bello O. S. - Adsorptive potentials
of lemongrass leaf for methylene blue dye removal, Chemical Data Collections 31 (2021)
100578. />10. Sari N. H., Wardana I., Irawan Y. S., and Siswanto E. - The effect of sodium hydroxide
on chemical and mechanical properties of corn husk fiber, Oriental Journal of Chemistry
33 (6) (2017) 3037-3042. />11. Sun J.X., Sun X.F., Zhao H., and Sun R.C. - Isolation and characterization of cellulose
from sugarcane bagasse, Polymer Degradation and stability 84 (2004) 331–339.
/>12. Lagergren S. K. - About the theory of so-called adsorption of soluble substances, Sven.
Vetenskapsakad. Handingarl 24 (1898) 1-39.
13. Douissa N. B., Bergaoui L., Mansouri S., Khiari R., and Mhenni M. F. - Macroscopic and
microscopic studies of methylene blue sorption onto extracted celluloses from Posidonia
oceanica, Industrial Crops and Products 45 (2013) 106-113.
/>
TÓM TẮT
NGHIÊN CỨU KHẢ NĂNG HẤP PHỤ METHYLEN BLUE BẰNG VẬT LIỆU
SINH HỌC TỪ BÃ LÁ SẢ SAU KHI CHƯNG CẤT TINH DẦU
Võ Thúy Vi
Trường Đại học Công nghiệp Thực phẩm TP.HCM
Email:
Trong nghiên cứu này, một vật liệu sinh học chuẩn bị từ lá sả sau khi chưng cất tinh dầu
được điều chế bằng phương pháp xử lý kiềm với NaOH 10%. Hiệu suất hấp phụ metylen xanh
(MB) được khảo sát trong các điều kiện sau: liều lượng chất hấp phụ (0,02-0,4 mg), pH
(2-10), và nồng độ MB (20 và 100 mg/L). Khi liều lượng chất hấp phụ và pH tăng lên, hiệu
suất hấp phụ màu tăng lên. Các nghiên cứu động học cho thấy rằng quá trình hấp phụ MB tuân
theo phương trình động học bậc hai với cân bằng hấp phụ sau 30 phút. Hiệu suất và dung
lượng hấp phụ tại MB có nồng độ 20 mg/L là 90,9% và 6,30 mg/g khi sử dụng 0,1 g chất hấp
phụ trong 30 phút. Kết quả nghiên cứu cho thấy bã lá sả sau khi xử lý kiềm là một vật liệu sinh
học rẻ tiền và hiệu quả trong xử lý nước thải nhuộm.
Từ khoá: chất hấp phụ sinh học, lá sả, sự hấp phụ, methylene blue.
10
Journal of Science Technology and Food 22 (2) (2022) 11-21
CHARACTERISTICS AND PHENOL RED ADSORPTION
CAPACITY IN AQUEOUS SOLUTIONS OF SBA-15 ADSORBENT
SYNTHESIZED FROM THE ASH OF BRICKYARD
Tran Hoai Lam1*, Nguyen Van Hoa1, Tran Thi Thanh Truc2,
Truong Tien Dung3, Le Minh Hoa3, Nguyen Phan Duyen Nu2,
Giang Ngoc Ha1, Nguyen Hoc Thang1
1
Ho Chi Minh City University of Food Industry
2
SGS Vietnam Ltd., Ho Chi Minh City
3
Kengta Technologies Ltd., Ho Chi Minh City
*Email:
Received: 16 December 2021; Accepted: 15 April 2022
ABSTRACT
The ash of brickyards or rice husk ash is a big problem for the environment, and it is
necessary to have good solutions to manage and utilize as a raw material for other industries.
In addition, the organic wastes with high solubility in water have been also causing many bad
consequences to human health, animals, and plants. Therefore, this study used the ash of
brickyard to synthesize SBA-15 materials known as adsorbents in removal of organic wastes
like as phenol red out of aqueous solutions. The experimental results showed that the
SBA-15-based nanomaterials had well-ordered hexagonal meso-structure and its pore
diameter was approximately 7.8 nm. The nano-adsorbents of SBA-15 had also high adsorption
of the phenol red. The experimental data on phenol red adsorption were evaluated based on
the Langmuir isotherm model and the pseudo-second-order model well with high regression
coefficients at R2 = 0.9995 and 0.9900, respectively. The phenol red adsorption efficiency of
SBA-15-based nanomaterials was really high at 98.8 % and its maximum adsorption capacity
reached to 19.77 mg.g-1.
Keywords: SBA-15, ash, phenol red, adsorption, and adsorbent.
1. INTRODUCTION
The Mekong Delta is the largest local on rice production in Vietnam with a total output
around 40 million tons per year, accounting for 90% rice of the country [1]. In addition to the
main product of rice, the rice harvest and processing have also generated a number of other
by-products such as rice husk and straw in very large quantities. This poses a challenge for the
local people to manage and re-use these by-products. In fact, there have been many solutions
such as using them to compost or burn to get fertilizer with low efficiency. The rice husk has
been used as a solid fuel in several agricultural drying kilns with high construction and
installation costs. More specifically in the Mekong delta, there are also many factories
producing burnt-clay bricks using fuelwood or coal for combustion. However, the prices of
these fuels are really high and continuously increasing. Therefore, these local facilities have
been used rice husk and straw to replace for traditional fuels during the burning process. The
burning processes has produced a lot of solid wastes, which are the non-combustible inorganic
components in rice husk or straw known as the ash of brickyard. Many production facilities
11
Tran Hoai Lam, Nguyen Van Hoa, Tran Thi Thanh Truc, Truong Tien Dung, Le Minh Hoa,…
have dumped the solid wastes on their farmland without any solution to reuse it. There have
been many studies shown that the ash of brickyard contains high silica of SiO2. Normally, after
burning, the ash has over 80% is silicon oxide with amorphous reactive silica [2]. Thus, this
is a potential resource, which has many different applications in fields of materials science.
The silica from rice husk ash has been used in rubber [3], adsorbents [4], filter materials [5],
etc. This study utilized the ash of brickyard as a raw material to synthesize nano-adsorbents
which aim to improve the environmental pollution and wastewater treatment. It is noted that
there is no study on nano-adsorbents based on silica from the ash of brickyard.
Phenol red or phenolsulfonphthalein exists as a red crystal with the aqueous solubility at
0.77 g.L-1. The phenol red solution was often used as a pH indicator in cell culture [6] and as
a dye. The eyes, respiratory system, and skin may be irritated after exposed to phenol red [7].
In addition, the phenol red is also able to cause inhibition of the growth of renal epithelial cells
[7]. It is toxic to muscle fibres and have mutagenic effects [8, 9]. Therefore, the impacts of
phenol red on the environment should be investigated and must have a good solution for its
treatment. There have been many investigations on using various materials to adsorb phenol
red such as the bottom ash and deoiled soya adsorbents [10]; and clinoptilolite [11]. In
addition, many reports also used the various models to evaluate adsorption capacity and
adsorption efficiency in wastewater treatment with the synthesized materials such as silica
material [12], modified bentonite [13], and others [14, 15].
The SBA-15 adsorbents have been researched with outstanding specifications such as
high surface area around 900 m2.g-1; high thermal and mechanical stability; inert and
environmentally friendly properties [16]. The SBA-15 materials are normally synthesized
from tetraethoxysilane (TEOS) as the silica source with high cost and complex TEOS
processes [17- 18]. This is motivation to enhance the development of alternative silica sources
known as the rice husk ash or the ash of brickyard. Thus, this study focused on two main
investigations included utilization of the brickyard ash as a raw material for synthesizing SBA15 nano-adsorbent and its experiments on the phenol red adsorption in aqueous solutions. It is
noted that the microstructural characteristics of SBA-15 nanomaterials were analysed using
Fourier transform infrared spectroscopy (FTIR), X-ray diffraction (XRD), transmission
electron microscopy (TEM), Brunauer–Emmett–Teller (BET). The absorption capacity and
absorption of SBA-15 nano-adsorbents were recorded during the removal of phenol red dye.
2. MATERIALS AND METHODS
2.1. The ash of brickyard
The raw material was from the local burnt-clay brick production facilities in Mekong
delta, Vietnam. The brickyard ash was prepared via the processes of drying, sieving to remove
the soil, sand, rock, and other contaminants, and grinding as reported in Nguyen (2019) [2].
2.2. Chemical reagents
This study used the chemical reagents of NaOH, HCl, Phenol red and Pluronic P123
(Amphiphilic triblock copolymer poly(ethylene oxide)-poly-(propylene oxide)-poly(ethylene
oxide, MW=5800) from Merck Vietnam Ltd.
2.3. Preparation of SBA-15 mesoporous materials
Figure 1 is a diagram of the experimental steps from the preparation of raw materials for
the synthesis of SBA-15 nanomaterials to the analyses of the microstructural characteristics
and the phenol red absorption efficiency in aqueous solution of the product.
12
Characteristics and phenol red adsorption capacity in aqueous solutions of SBA-15…
Figure 1. Preparation of SBA-15 nano-adsorbent with microstructural characteristics
and its phenol red absorption efficiency.
For each experiment, the ash with 10 g was soaked in 150ml of 3M NaOH solution and
stirred at temperature of 110 oC for 3 hours. Then, the sample was filtered using activated
carbon to obtain a colourless solution (solution A). In other work, the Pluronic P123 surfactant
was dissolved in an aqueous solution of 1M HCl at room temperature (solution B). The next
step, solution A was added on a drop-by-drop into solution B to form a precipitate. The whole
mixture was put into a glass jar and incubated at temperature of 105 oC for 24 hours to obtain
gel. And then, the white precipitate was filtered and washed with water to neutral and dried at
105 oC for 24 hours. The sample was removed surfactant by calcining at 550 oC with heating
rate at 10 oC/min in the atmostphere condition [19].
Finally, the nanomaterial of SBA-15 was characterized for microstructure and
morphologies using methods of FTIR, XRD, TEM, BET with nitrogen adsorption-desorption.
Both samples of P-SBA-15 without calcination and SBA-15 with calcination were
analysed to detect the functional groups of chemical bondings using FTIR (8400S Shimadzu
with KBr pellets).
The SBA-15 sample was characterized for the phase compositions using method of X ray
diffraction (XRD) with the diffraction angle of 2-Theta from 0.5 to 80o and a step size of 0.02.
The experiments were conducted at German-Vietnamese Technology Academy, Ho Chi Minh
City University of Food Industry (GVTA-HUFI) using Bruker D2 diffractometer and Research
& Experiment Center, Vietnam Petroleum Institute (REC-VPI) using Bruker D8 Advance
diffractometer with CuKα radiation (λ=1.54 Å).
The specific surface area and total pore volume of the SBA-15 nano-adsorbent sample
were analysed by nitrogen adsorption-desorption isotherms at 77 °K using Quantachrome
Nova 2000e meter.
2.4. Preparations for phenol red adsorption
A beaker was prepared with 200 mL aqueous solution of phenol red. And then, 2 g nanoadsorbent of SBA-15 was added in the beaker. The different adsorbent concentrations were
adjusted at 20 ppm, 30 ppm, 50 ppm, and 70 ppm. The sample was stirred for 180 minutes and
then the concentrations of phenol solution were determined using UV-Vis spectrophotometry.
13
Tran Hoai Lam, Nguyen Van Hoa, Tran Thi Thanh Truc, Truong Tien Dung, Le Minh Hoa,…
2.5. Interpretation of adsorption isotherm model
The Langmuir isotherm model was used to analysed the sorption equilibrium data for the
phenol red on SBA-15 nano-adsorbent [20, 21]. The relative coefficients of the model were
calculated using linear least-squares fitting.
The Langmuir sorption isotherm equation is known as follows:
and it is linearized to become:
𝑞𝑒 = 𝑄𝑚 𝐾𝐿 𝐶𝑒 ⁄(1 + 𝑘𝐿 𝐶𝑒 )
𝐶𝑒
𝑞𝑒
𝐶
1
𝑚 𝑘𝐿
= 𝑄𝑒 + 𝑄
𝑚
(1)
(2)
where, 𝒒𝒆 (mg g-1) and 𝑪𝒆 (mg L-1) are the equilibrium concentrations of phenol red in the
nano-adsorbent of SBA-15 and liquid phases, respectively; 𝑸𝒎 and 𝒌𝑳 are the Langmuir
constants which are related to sorption capacity and energy of sorption, respectively, and they
are calculated from the intercept and slope of the linear plot of 𝑪𝒆 ⁄𝒒𝒆 and 𝑪𝒆 .
2.6. Kinetic models
The pseudo-second-order were used to analyse the sorption kinetic data for cobalt on the
various adsorbents [22]. The pseudo-second-order equation was written into:
𝑑𝑞𝑡
𝑑𝑡
= 𝑘2 (𝑞𝑒 − 𝑞𝑡 )2
(3)
where, 𝒌𝟐 (g.mg-1.min-1) is the rate constant; 𝒒𝒕 and 𝒒𝒆 (mg g-1) are the amount of sorption at
time t (min) and at equilibrium, respectively.
The equation (3) is integrated and applied for the above conditions to become:
1
𝑞𝑒 −𝑞𝑡
= 𝑞 + 𝑘2 𝑡
𝑡
𝑞𝑡
2
2 𝑞𝑒
1
𝑒
(4)
After rearranged, the equation (4) changes into a linear form:
=𝑘
1
1
+𝑞 𝑡
𝑒
(5)
in which, 𝒌𝟐 and 𝒒𝒆 are obtained from the intercept and slope of the plot 𝒕⁄𝒒𝒕 and t,
respectively.
3. RESULTS AND DISCUSSION
3.1. Characteristics of the adsorbent based on SBA-15 synthesized from the ash of
brickyard
The FTIR spectra of samples are shown in Figure 2. The bands observed at wavenumbers
of 1080 cm-1, 804 cm-1 and 484 cm-1 corresponding to bend stretching vibrations of Si–O–Si
with symmetric and asymmetric, respectively. At the wavenumber of 960 cm-1, it was resulted
from Si–OH stretching band. The broad band of wavenumbers from 3000 to 3700 cm-1 is
vibrations of hydroxyl groups. The sharp peak at 3745 cm-1 is related to the vibrations of the
Si–OH. Figure 2a for the P-SBA-15 sample without calcination had the wavenumber at 2800
cm-1 detected to vibrations of C-H bonding. It is noted that Figure 2b for the SBA-15 sample
with calcination had no peak at wavenumber of 2800 cm-1. The results showed that the framed
organic fraction with Fluronic P123 was successfully removed by calcination at temperature
of 550 °C for 5 hours.
14
Characteristics and phenol red adsorption capacity in aqueous solutions of SBA-15…
Figure 2. Vibrations of the chemical functional groups in P-SBA-15 (a) and SBA-15 (b) using FTIR.
The XRD patterns of SBA-15 nano-adsorbent are shown in Figure 3. In Figure 3a, the
peaks of SBA-15 sample were detected at 2-Theta of 1.0o, 1.7o, and 1.9o characterized for
crystal planes (100), (110), and (200), respectively. The results are suitable to the previous
studies on SBA-15 based materials using TEOS as raw material in the synthesized processes
[16-18]. The peak with narrow and high intensity of crystal planes (100) of in SBA-15 sample
indicated a good mesopore ordering and the typical hexagonal channels of SBA-15 based
materials [17]. In Figure 3b, the wide angle XRD pattern of SBA-15 indicates that the
nanomaterial has high silica with major amorphous structure due to noisy and broad
background of the XRD pattern. There is a peak at 2-Theta of 22.5o which is diffraction of
silica crystals. This is a characteristic hexagonal structure of SBA-15 based materials as shown
in Figure 1.
Figure 3. XRD patterns of SBA-15 based nano-adsorbent at small-angle X-ray scattering (a)
and wide-angle region X-ray scattering (b).
The morphologies and microstructural characteristics of adsorbent based on SBA-15 was
observed by transmission electron microscopy (TEM) using a JEM JEOL – 1400 microscope
instrument (Japan) with an acceleration voltage of 100 kV. The TEM images showed that the
particles of SBA-15 have the sizes about 8 nm with the really uniform distribution as shown
in Figure 4. In addition, the TEM nano-graphs showed that the sample of SBA-15 had a long
order and uniform channel structures along to pores axes and hexagonal cross sections. This
is a really convincing scientific evident on the nanostructures of SBA-15 synthesized from the
brickyard ash. These results are consistent with that of the XRD patterns in Figure 3 and the
previous investigations on SBA-15 synthesized from TEOS raw material [16-18].
15
Tran Hoai Lam, Nguyen Van Hoa, Tran Thi Thanh Truc, Truong Tien Dung, Le Minh Hoa,…
Figure 4. Nanostructures of SBA-15 sample using TEM with normal to pore axis (a)
and along to pore axis (b).
The pore size distribution of SBA-15 is shown in Figure 5 with the analysis of desorption
branch of the isotherm by the BJH method. In which, the pore sizes have high distribution in
range of 50 Å to 100 Å equivalent to 5-10 nm. The surface area was determined at 772.224
m2.g-1, pore volume of 0.838 cm3.g-1, and pore diameter at 7.8 nm. These results are similar to
nanostructures detected by TEM in Figure 4.
Figure 5. The pore size distribution of the SBA-15 nanomaterial using BET with BJH method.
3.2. The phenol red adsorption in aqueous solutions of SBA-15 nanomaterial
3.2.1. The effect of time
In general, the adsorption capacity and adsorption efficiency of the adsorbent based SBA-15
significantly rose with increasing stirring time. As shown in Figure 6, the phenol red
adsorption of SBA-15 adsorbent rapidly increased in the first 20 minutes, and then it slightly
rose until 150 minutes. Finally, the phenol red adsorption capacity of the SBA-15
insignificantly slowly increased and the equilibrium was achieved at 180 minutes when the
adsorption sites were filled out.
16
Characteristics and phenol red adsorption capacity in aqueous solutions of SBA-15…
Figure 6. Effects of time on the phenol red adsorption of SBA-15 adsorbent
with the adsorption quantity (a) and removal efficiency (b).
The experimental data showed that the longer stirring time had, the more phenol red
adsorption increased. However, this is only suitable for stirring time less than 180 minutes.
The phenol red adsorption capacity and adsorption efficiency are not influenced or less
effected by the stirring time when it is over 180 minutes. The highest adsorption capacity
reached at was 19.77 mg.g-1 for the adsorption time of 180 minutes corresponding to the
adsorption efficiency over 98.84 % as shown Figures 6b and 7.
Removal efficiency, %
Quantity adsorbed, q mg.g-1
98,84
61,41
35,64
19.77
20
18.43
30
17.82
50
26,25
18,38
70
The initial concentration of phenol red, ppm
Figure 7. Effects of the phenol red concentrations on the adsorption capacity
and removal efficiency of SBA-15 adsorbent.
3.2.2. Effect of initial phenol red concentration to removal efficiency
The phenol red adsorption of SBA-15 adsorbent was carried out in the different
concentrations of 20 ppm, 30 ppm, 50 ppm, and 70 ppm with the stirring time at 180 minutes
as shown in Figure 7. The phenol red absorption has the highest values at 19.77 mg.g -1
corresponding to the removal efficiency of 98.84% with the concentration of 20 ppm. When
increasing the concentration of phenol red, the phenol red removal efficiency of SBA-15
adsorbent decreased sharply. Moreover, in this case, the adsorbed phenol red quantity changed
insignificantly. The results indicated that the phenol red adsorption process on SBA-15 nanoabsorbent is the physical adsorption.
3.2.3. Langmuir isotherm model for phenol red adsorption
The phenol red sorption isotherm of SBA-15 adsorbent at room temperature is shown in
Figure 8a. The sorption data were determined in term of Langmuir isotherm model. The results
and graphical isotherm showed the fit with the Langmuir model with R2 at 0.9995. The fitted
constants for the Langmuir model are qmax at 18.315 mg.g-1 and KL at 8.4 L.mg-1 as well as the
regression coefficient of R2 at 0.9995.
17
Tran Hoai Lam, Nguyen Van Hoa, Tran Thi Thanh Truc, Truong Tien Dung, Le Minh Hoa,…
In Table 1 below, we summarize the results of previously published studies relevant to
this topic. These results shown that, the phenol red adsorption capacity of SBA-15 materials
is higher other materials.
Table 1. The phenol red adsorption capacities of various adsorbents
No.
Adsorbents
The phenol red adsorption capacity,
qmax [mg.g-1]
References
1
SBA-15
18.315
This study
2
Activated carbon
6.756
[11]
3
Bottom ash
9.214
[10]
3.2.4. The kinetic for the phenol red adsorption of SBA-15 adsorbent
The experimental adsorption kinetic data were fitted to pseudo-second-order rates as
mentioned in Equation (5). The linear observation of lines in Figure 8b indicated that the
adsorption kinetic data are well represented by the pseudo-second-order model for phenol red
with the regression coefficient of R2 over 0.994. This was applied for all concentrations
conducted experiments in this study.
Figure 8. The phenol red adsorption of SBA-15 adsorbent responding to Langmuir sorption
isotherm model (a) and pseudo-second-order sorption kinetic model (b).
4. CONCLUSIONS
The adsorbent of SBA-15 was successfully synthesized from the ash of brickyard with
the microstructural characteristics responding to nanomaterial requirements. The results of
nitrogen adsorption/desorption and TEM nano-graphs illustrated the formation of cylindrical
pores and a well-ordered hexagonal array of SBA-15 adsorbent. In which, the nanomaterial
has the high specific surface area of 772.224 m2g-1, pore volume of 0.838 cm3.g-1 and average
pore size at 7.8 nm. The SBA-15 adsorbent has high ability to remove the phenol red in
aqueous solutions with the removal efficiency up to 98.84%. And the maximum adsorbed
phenol red quantity of SBA-15 nanomaterial is at 19.77 mg.g-1. The phenol red adsorption
process of SBA-15 adsorbent was the physical adsorption. The experimental data of phenol
red adsorption were satisfied well to the Langmuir isotherm model with high regression
coefficient of R2 at 0.9995. Moreover, the pseudo-second-order model also met to apply the
exchange kinetic data of the phenol red adsorption process with regression coefficient of R2
over 0.99. Future research will be carried out for improvements of SBA-15 adsorbent to
achieve the better output parameters in wastewater treatment. In addition, the adsorbent of
18
Characteristics and phenol red adsorption capacity in aqueous solutions of SBA-15…
SBA-15 based on the brickyard ash should be also conducted experiments related to the
adsorption of heavy metals in aqueous solutions to clean the polluted environment.
Data Availability: The data used to support the findings of this study are available from the
corresponding author upon request.
Conflicts of Interest: The authors declare that there is no conflict of interest regarding the
publication of this paper.
Funding Statement: This work was financially supported by Ho Chi Minh City University of
Food Industry (Project No. ĐTKHCNGV.017/2020).
Acknowledgments: The authors would like to thank to Labs of Faculty of Chemical
Technology (HUFI) supported for doing experiments in this research.
REFERENCES
1. />2. Hoc Thang Nguyen - synthesis and characteristics of inorganic polymer materials
geopolymerized from ash of brickyard, Materials Science Forum 961 (2019) 45-50.
/>3. Chang B.P, Gupta A., Muthurai R., Mekonnen T. - Bioresourced fillers for rubber
composite sustainability: current development and future opportunities, Green
Chemistry 23 (2021) 5337–5378., 2021. />4. Donanta Dhaneswara, Jaka Fajar Fatriansyah, Frans Wensten Situmorang, Alfina
Nurul Haqoh - Synthesis of amorphous silica from rice husk ash: Comparing HCl and
CH3COOH acidification methods and various alkaline concentrations, International
Journal of Technology 11 (2020) 200-208. />5. Madu J. O., Adams F. V., Agboola B. O., Ikotun B. D., Joseph I. V. - Purifications of
petroleum products contaminated water using modified rice husk ash filters, Materials
Today: Proceedings 38 (2021) 599-604. />6. Yolande Berthois, John A. Katzenellenbogen, and Benita S. Katzenellenboge - Phenol
red in tissue culture media is a weak estrogen, Proceedings of the National Academy
of Sciences of the United States of America 83 (1986) 2496-2500.
/>7. Walsh-Reitz
M. M., Toback F. G. - Phenol red inhibits growth of renal epithelial
cells, American Journal of Physiology 262 91992) 687-691.
/>8. Chung K. T., Fulk G. E., Andrews A. W. - Mutagenicity testing of some commonly
used dyes, Applied and Environmental Microbiology 42 (1981) 641–648.
/>9. Baylor S. M., Hollingworth S. - Changes in phenol red absorbance in response to
electrical stimulation of frog skeletal muscle fibers, Journal of General Physiology 96
(1990) 449–471. />10. Mittal A., Kaur D., Malviya A., Mittal J., Gupta V. K. - Adsorption studies on the
removal of coloring agent phenol red from wastewater using waste materials as
adsorbents, Journal of Colloid and Interface Science 337 (2009) 345–354.
/>
19
Tran Hoai Lam, Nguyen Van Hoa, Tran Thi Thanh Truc, Truong Tien Dung, Le Minh Hoa,…
11. Alebachew N., Yadav O. P., Lokesh - Removal of phenol red dye from contaminated
water using barley (Hordeum vulgare L.) husk-derived activated carbon, Science
International 5 (2017) 7–16. />12. Tran Hoai Lam, Nguyen Van Du, Quach Nguyen Khanh Nguyen, Nguyen Minh Thao
– Adsorption of Pb2+ và Cu2+ ions in aqueous solution by silica materials synthesized
from the ash of brickyard, Journal of Analytical Sciences 24 (2019) 8-15. (in
Vietnamese)
13. Nguyen L. M. L., Tran D., Hoang V. D., et al. - Phenol Red Adsorption from Aqueous
Solution on the Modified Bentonite, Journal of Chemistry 2020 (2020) ID 1504805.
/>14. Amar A., Loulidi I., Kali A., Boukhlifi F., Hadey C., Jabri M., - Physicochemical
Characterization of Regional Clay: Application to Phenol Adsorption, Applied and
Environmental
Soil
Science
2021
(2021)
ID
8826063.
/>15. Hoc Thang Nguyen, Dang Thanh Phong - Using Activated Diatomite as Adsorbent
for Treatment of Arsenic Contaminated Water, Key Engineering Materials 850 (2020)
16–23. />16. Hoang V.T., Huang Q., Eic M., Do T. O., Kaliaguine S. - Structure and diffusion
characterization of SBA-15 Materials, Langmuir 21 (2005) 2051-2057.
/>17. Ryoo R., Ko C. H., Kruk M., Antochshuk V., Jaroniec M. - Block-copolymertemplated ordered mesoporous silica: Array of uniform mesopores or
mesopore−micropore network?, The Journal of Physical Chemistry B 104 (2000)
11465–11471. />18. Zhao D., Sun J., Li Q., Stucky G.D. - Morphological control of highly ordered
mesoporous silica SBA-15, Chemistry Materials 12 (2000) 275-279.
/>19. Quach Nguyen Khanh Nguyen, Nguyen Thi Yen, Nguyen Duc Hau, and Hoai Lam
Tran - Synthesis and characterization of mesoporous silica SBA-15 and ZnO/SBA-15
photocatalytic materials from the ash of brickyards, Journal of Chemistry 2020 (2020).
/>20. Yu C., Fan J., Tian B., Zhao D. - Morphology development of mesoporous materials:
a colloidal phase separation mechanism, Chemistry Materials 16 (2004) 889-898.
/>21. Glasstone S. - Text book of physical chemistry, 2nd edition, Macmillan, India, 1981.
22. Ho Y.S., Mckay G. - Pseudo-second order model for sorption processes, Process
Biochemistry 34 (1999) 451-465. />
20
Characteristics and phenol red adsorption capacity in aqueous solutions of SBA-15…
TĨM TẮT
ĐẶC TÍNH VÀ KHẢ NĂNG HẤP PHỤ PHENOL ĐỎ CỦA VẬT LIỆU SBA-15
ĐƯỢC TỔNG HỢP TỪ TRO LÒ GẠCH
Trần Hồi Lam1*, Nguyễn Văn Hịa1, Trần Thị Thanh Trúc2,
Trương Tiến Dũng3, Lê Minh Hòa3, Nguyễn Phan Duyên Nữ2,
Giang Ngọc Hà1, Nguyễn Học Thắng1
1
Trường Đại học Cơng nghiệp Thực phẩm TP.HCM
2
Phịng Kiểm tra chất lượng quặng, Công ty SGS Việt Nam
3
Công ty Kỹ thuật Kengta Việt Nam
*Email:
Tro thải lò gạch hay tro trấu là một vấn đề lớn của môi trường, do đó cần phải có một
giải pháp tối ưu để quản lý và sử dụng nó làm nguyên liệu cho nhiều ngành sản xuất khác.
Hơn nữa, các chất thải hữu cơ tan trong nước nói chung và phenol đỏ nói riêng đã và đang gây
ra nhiều hệ quả xấu đối với sức khỏe con người, động vật và cây cối. Trong nghiên cứu này,
tro lò gạch đã được sử dụng để tổng hợp vật liệu SBA-15 và sử dụng làm chất hất phụ để loại
bỏ phenol đỏ ra khỏi dung dịch nước. Kết quả thực nghiệm cho thấy, vật liệu SBA-15 đã tổng
hợp thành cơng với đường kính lỗ khoảng 7,8 nm. Quá trình hấp phụ phenol đỏ của chất hấp
phụ SBA-15 tuân theo phương trình đẳng nhiệt hấp phụ Langmuir và phương trình động học
hấp phụ bậc 2 với R2 tương ứng 0,9995 và 0,9900. Dung lượng và hiệu suất hấp phụ tối đa của
phenol đỏ là 19,77 mg.g-1 và 98,84%.
Từ khóa: SBA-15, tro, phenol đỏ, sự hấp phụ, chất hấp phụ.
21
Journal of Science Technology and Food 22 (2) (2022) 22-30
ASSESSMENT OF GHGs EMISSION FROM DIFFERENT
COW-PAT TREATMENT METHODS AND EFFECTIVENESS
OF EM SUPPLEMENTATION
Tran Thi Thuy Nhan1, Tran Thi Ngoc Mai1,*, Truong Thi Dieu Hien1,
Nguyen Thi Tra Mi2, Nguyen Thi Thanh Thao1
1
Ho Chi Minh City University of Food Industry
2
Ho Chi Minh City Vocational College
*Email:
Received: 28 August 2021; Accepted: 16 March 2022
ABSTRACT
Greenhouse gas (GHGs) emission is a great concern in the agriculture industry. These
gases mainly consist of methane (CH4), carbon dioxide (CO2), and nitrous oxide (N2O). GHGs
might originate from rice farming, livestock, or manure storage. In countryside areas, there are
many approaches to archive manure, however, no evidence for GHGs emission evaluation has
been conducted. In this study, we aim to testify the GHGs emission among the common
cow-pat treatment approaches, including basking, and in-box inoculation with and without
surface lid. Furthermore, effective microorganisms (EMs) named Balasa No.1 and EM Balasa
No.5 were also deployed in this study to appraise their effects on cow-pat decomposition and
GHGs emissions. Results suggest that the basking method releases the least GHGs as
compared to in-box inoculation. In addition, the surface lid generates more CO2 than to group
without a lid for two weeks of observation. The amendment of EMs rises the temperature of
the chamber, preferably increasing CH4 emission in Balasa No.1 treatment while elevating
CO2 production in EM Balasa No.5 treatment. To compromise between decreasing GHGs
emissions and cow-pat decomposition/ fertilizer transformation, EM Balasa No.5 seems to be
the safe choice per this study.
Keywords: Greenhouse gases (GHGs), cow-pat, methane, carbon dioxide, effective
microorganisms EM.
1. INTRODUCTION
Agriculture activities create significant greenhouse gas (GHGs) emissions, accounting
for one-third GHGs released by human activities [1]. The GHGs are mainly methane (CH4),
carbon dioxide (CO2), and nitrous oxide (N2O). These GHGs partly come from ruminant
fermentation or during animal housing and manure storage. Many studies have been funded to
investigate and figure out the effective approaches in an attempt to reduce GHGs release [2].
It could be breeding to lower mortalities while gaining more cattle with higher resistance to
heat or disease and therefore decreasing an individual number of cattle. Another approach is
feeding efficiency. This approach mainly focuses on improving feed efficiency and cattle
performance via monitoring the materials of nutrients (eg., corn and legume produce less CH4
than grass) and keeping from overfeeding nutrients to reduce manure production. Moreover,
some additives such as ionophores and some oils are believed to lower CH4 emission and
aerobic manure management is also a considerable choice for lower CH4 production.
Interestingly, composting is a low-cost method to limit CH4 emission via encouraging aerobic
22
Assessment of GHGs emission from different cow-pat treatment methods…
fermentation while repressing anaerobic fermentation and therefore partly reducing GHGs
released. Therefore, attenuation of GHGs release in agricultural activity is possible and could
help minimize the negative impacts of climate change.
Microbes play an important role in either serving as GHGs generators or being able to
consume, recycle and transform GHGs into soluble nutrients for soil and organisms [3, 4].
Among them, effective microorganisms (EMs)-the mix of microbes, are believed to enhance
the turnover of organic waste during composting. Typically, EMs are consisting of three basic
types of microorganisms. First, lactic acid bacteria play an important role to maintain low pH
conditions, which inhibits pathogenic microbe growth and facilitates the survival of methaneproducing microorganisms. The second ingredient is yeast which allows the fermentation
initiation. Moreover, photosynthetic bacteria are also important for EM activity. These bacteria
metabolize both organic and inorganic substances and convert them into basic cellular
materials for amino acids, sugar, or nucleic acid synthesis [5]. With those advantages, EMs
might be a useful factor for the attenuation of GHGs in agriculture activity. In this study, we
aim to evaluate various local practices of cow-pat treatment, including basking, and in-box
inoculation with and without a surface lid. In addition, the amendment of EMs during in-box
inoculation is also appraisal. These data would benefit the prevention of GHGs released during
cow-pat treatment while suggesting the potential of EM Balasa No.5 in organic waste
decomposition.
2. MATERIALS AND METHODS
2.1. Materials preparation
Per the local practices of cow-pat treatment, the amount of 540 kg cow-pat was divided
into three different measures of cow-pat treatment, including basking, and box-inoculation
with and without lid. Each group was triplicate and each experiment was duplicated (Figure
1a). Group 1, basking, 60 kg cow-pat was basked in the square of canvas 2.8 x 2.8 x 0.1 m (L
x W x H) within 7 days and raked twice per day. Group 2, 60 kg cow pat was incubated in a
foam box and covered with a lid. The distance between cow-pat and lid is 50 cm and monitored
within 30 days. Group 3, 60 kg cow pat was incubated in foam box without lid within 30 days.
For the experiment to evaluate the contribution of effective microorganisms (EMs), 540 kg of
cow-pat was divided into three groups, cow-pat was mixed with EM Balasa No.1 or EM Balasa
No.5 or without EMs (Figure 1b). As the manufacturer's guide, EMs was pre-processed and
activated with rice bran as a ratio of 1 kg EMs:10 kg rice bran: 10 L of distilled water, and
anaerobically incubated within 3 days. During pre-processing, EM temperature was
maintained below 500C. Activated EMs were sprinkled into cow-pat evenly before proceeding
study.
EM Balasa No. 1 contains 04 main strains of microorganisms: Streptococcus lactis,
Bacillus subtilis, Saccharomyces cerevisiae, and Thiobacillus sp (NN3b). Meanwhile, EM
Balasa No.5 includes strains of microorganisms: Bacillus subtilis, Nitrosomonas, Nitrobacter,
Lactobacillus acidophilus, Saccharomyces sp, Thiobacillus sp.
2.2. Experiment model
To evaluate the GHGs in each group, the experiment was illustrated in Figure 1a.
Chamber is designed at dimension (3 x 3 x 2.5 m). On the top of the chamber, the Polyvinyl
chloride (PVC) pipeline (2.8 m, Φ60) was put on and there are 3 rows of holes (dimension 10
mm) and the gap between the holes is 10 cm. The PVC pipeline is connected with the
corrugated pipe (Φ34), which is jointed with another PVC pipeline (Φ60). This PVC pipeline
23
Tran Thi Thuy Nhan, Tran Thi Ngoc Mai, Truong Thi Dieu Hien, Nguyen Thi Tra My,…
serves as the GHGs collecting tube via two holes covered by rubber stoppers. On the other
end, the PVC pipeline is attached to the air vacuum (0.75 kW) and the gases are exhausted via
the pipe Φ34. The chamber face is covered by plastic PE to prevent the gases from leaking.
A
Air exit
Air
pump
Air sampling
points
Chamber &
basking sample
Dimension: 3 X 3 X 2.5 m
B
Basking
Foam box w/o lid
Chamber + box with lid
Foam box with lid
Balasa supplement
Figure 1. Model for green-house gas evaluating the experiment
2.3. Methods
2.3.1. Gases sampling and measurement
Criteria such as CH4 and CO2 were evaluated by the Institute of Animal Sciences for
Southern Vietnam as illustrated by Thompson et al. 2001 [6]. GHGs (CH4, CO2) were
measured as protocol below: once/a day in 7 first days, afterward once/3 days from day 8-30.
Different groups were put in the chamber with a fan and ventilating air-load was measured by
Extech SDL350 (24/24h auto-reader). Air samples were collected and measured by a Gasmet
FT-IR gas analyzer. Temperature in-door and out-door were recorded by a regular
thermometer at 100°C, immovably hanged inside and outside of the chamber daily at 13h. The
pH was determined directly using a pH meter.
2.3.2. Greenhouse gases release estimation
Quantification of total gases (including CH4 and CO2):
Whereas:
𝐴𝑖𝑟𝑓𝑙𝑜𝑤 (
1
𝑚𝑖𝑛
)=(
𝐷
2×1000
)2 × 𝜋 × 𝑉 × 1000 × 60 (1)
D: The dimension of PVC pipeline serving as gases collecting pipe (mm)
V: Velocity of releasing gases (m/s)
Released CH4 quantification
𝐶𝐻4 𝑐𝑜𝑤𝑝𝑎𝑡 (𝑝𝑝𝑚) = 𝐶𝐻4 𝑚𝑒𝑎𝑠𝑢𝑟𝑒𝑑 (𝑝𝑝𝑚) − 𝐶𝐻4 𝑓𝑟𝑜𝑚 𝑒𝑛𝑣𝑖𝑟𝑜𝑛𝑚𝑒𝑛𝑡 (𝑝𝑝𝑚) (2)
𝐶𝐻4 𝑟𝑒𝑙𝑒𝑎𝑠𝑒𝑑 (
𝑙
𝑚𝑖𝑛
𝐶𝐻4 𝑐𝑜𝑤𝑝𝑎𝑡 (𝑝𝑝𝑚) × 𝑉 (
)=(
1000,000
24
𝑙
min
)
) (3)