Cs224W 2018 76
Bạn đang xem bản rút gọn của tài liệu. Xem và tải ngay bản đầy đủ của tài liệu tại đây (8.53 MB, 10 trang )
Subrecommendit:
Recommendation Systems on a Large-Scale Bipartite
Graph
Yunhe (John) Wang, Alexis Goh Weiying, David Xue
{yunhe, gweiying, dxue}@stanford.edu
Abstract— With the massive amount of content on social
media platforms today, personalized recommendation systems
are crucial for identifying relevant content to continuously
engage users with. In this paper, we compare various graphical
approaches,
both
classic
and
recent,
for
large-scale
bipartite
graphs by testing their performance on subreddit recommendations for users on Reddit. We also investigate community
detection as a potential tool for recommendation. We show
that through taking into account user-specific preferences,
Collaborative Filtering and Mixed Similarity Diffusion performed the best on standard recommendation metrics, and
the Random Walk approach ran the fastest while performing
better than recommending the top subreddits. Our community
detection approach reveals both intuitive and non-intuitive
relationships between subreddits in communities up to a certain
size, shows stable communities of subreddits across time, and
offers direction for future recommendation systems.
I.
’subreddits”,
which
serve
as subcommunities
within
the overall Reddit community. A user may post new content
to individual
subreddits
(termed
“submissions”),
and
may
also participate in the community by upvoting, downvoting,
and commenting on other users’ submissions and comments.
In this paper, we implement various graphical recommendation approaches and compare their performance on
generating subreddit recommendations. Recommendation algorithms on large-scale bipartite graphs is a highly relevant
problem as personalized recommendations are crucial for
user engagement on social media platforms. Recommending
relevant subreddits is highly challenging considering the
volume and frequency of content posted on Reddit - in
November 2018 alone users posted over 14 million submissions and
To
119 million comments
tackle
this
question,
we
[4].
construct
the
user-subreddit
bipartite graph on Reddit data. Undirected edges between
user and subreddit nodes represent a user commenting on
a subreddit. Edges can be unweighted, or weighted by the
number of comments a user makes on the subreddit. We use
Reddit data generated over five months from January to May
2018 and a heldout dataset for June 2018.
We investigate three different approaches for recommendations on large-scale bipartite graphs:
1) Collaborative Filtering
2)
3)
Resource Diffusions
Random Walk
Further, we investigate the recommendation
task from the
perspective of community detection. Intuitively, community
structure on a projected unipartite subreddit graph can give
us insight into “clusters” of similar subreddits and form
the basis for subreddit recommendations. We generate the
folded one-mode subreddit graph, where edges between
subreddits represent that a user that commented on both subreddits,
INTRODUCTION
Reddit, often called “the front page of the Internet”, is an
online community where users share and discuss their topics
of interest. These entries are organized by areas of interest
called
As the above algorithms have never previously been applied to the user-subreddit graph, we contribute performance
findings. We show that by taking into account user-specific
preferences, Collaborative Filtering and Mixed Similarity
Diffusion perform the best on 3 standard recommendation
metrics, and the Random Walk approach ran the fastest
while still performing noticeably better than our baseline of
recommending the most popular subreddits.
and use the state-of-the art Leiden
Algorithm
[18],
an improvement over the Louvain Algorithm, for detecting
communities of subreddits. We apply an extension of modularity to address the resolution-limit problem, showing that
community detection reveals related subreddits at different
size scales of communities. We hypothesize and validate that
clusters of subreddits remain stable over time, i.e. new edges
between subreddits should appear in the same communitiy
clusters. This suggests that communities can offer valuable
information for community-based recommendation systems
and offers direction for future research.
Il.
RELATED
WORK
There are several areas of investigation on the usersubreddit bipartite network. Below we review the literature
on recommendation systems for bipartite graphs.
A.
Collaborative Filtering
Collaborative filtering techniques are common within the
recommendation system space. For example, York et al.
[19] employed such techniques to recommend products on
Amazon,
and
Resnick
et al.
[20]
on
News.
We
base
our
algorithm on Deshpande et al.’s [21] item-item collaborative
filtering technique, which they demonstrate to be effective
on 8 real datasets.
B. Resource Diffusion
Resource diffusion is a popular field of recommendation
algorithms for bipartite graph networks, first studied by Zhou
et al in 2007
Consider
[5].
item
nodes,
m
and
n
which
are
not
directly
connected. Resource diffusion describes the two-step process
where item m sends resources to n through their common
users.
In
the
first
step,
item
nodes
distribute
resources
amongst its users equally based on the items’ degrees. In
the second step, item nodes recover resources from the
users based on the users’ degrees. This process of resource
diffusion allows resources to be distributed from items each
user has collected (subreddits that they have commented on),
to items that share common users with them (subreddits that
they may be keen on).
In its simplest form, recommendations are only
with implicit feedback where edges between users
are unweighted. Wang et al. proposes a method
information from explicit feedback, the weight of
generated
and items
to utilize
the edges,
in the
known
mass
diffusion
process
[1].
The
method,
as
Mixed Similarity Diffusion, captures richer information from
the bipartite graphs as it accounts for users’ ratings on
items when diffusing resources. They demonstrate competitive results against other recommendation techniques on the
MovieLens dataset.
In this paper, we investigate the performance of both the
original Mass Diffusion and the Mixed Similarity Diffusion
algorithms on generating recommendations for the Reddit
bipartite graph.
C.
Random
Walk
Another approach to graphical recommendation systems
involves random walks with restarts. In this approach inspired by the PageRank algorithm [9], we simulate a user
who begins at a random node in a starting set of nodes S, and
at each step randomly traverses to a node adjacent to their
current node. In addition, at each step, the user may teleport
to a random node in S instead of moving to an adjacent node
(a “restart’”). This way, nodes closer to the starting set S are
visited more often.
Pixie [15] uses such
content (termed “pins”)
an algorithm to recommend new
to users of Pinterest. In order to
do so, Pixie simulates multiple random walks on a bipartite
graph of pins and “boards” (collections of pins), where the
starting set S is a set of pins that a user has interacted with.
On each walk, Pixie collects counts on how many times
a pin is visited, and aggregates the counts at the end in
order to recommend new pins. The authors demonstrate that
through biasing the walk using user preferences and various
other optimizations, Pixie achieves higher user engagement
than previous Pinterest recommendation systems while being
capable of recommending pins in real-time.
In this paper, we will extend the random walk recommendation system to the Reddit dataset, and compare it against
other recommendation systems.
D.
Community Detection on Bipartite Graphs
Community detection is a well studied problem for unipartite graphs. Since it was proposed in 2008, the greedy
Louvain
algorithm
[16]
has
been
found
to be
one
of the
fastest and best performing algorithms. However, the treatment of the problem on bipartite networks has been sparse.
Because edges connect vertices of two different types, the
classical definition of communities does not directly apply.
Most bipartite community detection efforts have extended
modularity [12], the classical community quality metric,
to
bipartite
networks.
In
2007,
Barber
[6]
developed
a
modularity-based algorithm called Bipartite Recursively Induced Modules
(BRIM).
BRIM
is an iterative algorithm that
employs a refined modularity matrix to accommodate for the
bipartite structure. In 2009, Liu and Murata [7] proposed a
hybrid algorithm called LPBRIM that uses the Label Propagation heuristic to search for a best community configuration,
and subsequently uses BRIM to refine the results. A pitfall of
most BRIM-based approaches, as acknowledged by Barber,
is that it only handles unweighted and undirected bipartite
networks. Like unipartite modularity, maximizing bipartite
modularity is an NP-hard problem [11]. Therefore, there is
no guarantee to achieve the best possible modularity which
makes it difficult to create or find an algorithm that performs
well on any network.
Projection-based approaches, where a bipartite network
is projected to a unipartite network, have historically been
used in recommendation systems. A key idea is the emphasis on one of the two node sets called the primary set.
These sets can be switched for different applications. The
primary strength of projection approach are that they allow
us to investigate bipartite networks using powerful one mode
algorithms. Empirically, Guimera et al. [10] have found no
difference in the node communities detected in P whether
they resulted from modularity maximization after projection,
or projection after bipartite modularity maximization. However, some papers have found sometimes the project resulted
in loss of the bipartite structural information
[5], [14].
In 2018, Traag et al. [18] proposed the Leiden algorithm
which they found to be faster than the Louvain algorithm
while yielding communities with proven guarantees to be
connected.
Furthermore,
this
work
has
incorporated
recent
work to extend the traditional quality function of modularity
to address the resolution limit. Modularity optimization algorithms are subject to a resolution limit in that the maximum
modularity community-wise partition can fail to resolve
communities,
causing
smaller
communities
to be
clustered
into larger communities.
In this paper, we investigate the Leiden algorithm [18] for
community detection on the folded subreddit graph.
Ill.
Reddit post and comment
DATA
data is publicly available
[4].
Each submission has information such as subreddit name,
user, submission content, and more. Each comment contains
attributes on subreddit name, text, upvote score, user, and
date. Each user contains information such as account creation
time, comment ids, last activity, and more. We examined a
subset of subreddits and users over the first six months of
2018 from January to June.
During
this entire 6 month
period, 9,731,646
users com-
mented on 162,242 subreddits. The number of unique comment edges was 68,138,004 and on average each user com-
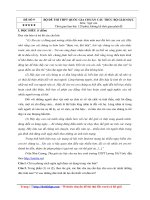
Number of New Users by Month
En
Fe
Mar
ber
Month in 2018
Number of New Subreddits by Month
Proportion of Users that Commented on N-Subreddits (Jan-May)
May
1 Subredalt(s)
jan
Fig. 3. Proportion of users who commented on N-subreddits from January
to June 2018. 39.45 percent of users only commented once (N < 1) during
this time period, 54.34 percent commented on one or two (N < 2), and
62.93 percent of users commented on three or fewer (N < 3).
In order to model
Fig. 1. New users (top) and subreddits (bottom) out of total monthly users
and subreddits from January to June 2018. The proportion of previously
unseen users and subreddits (i.e. new nodes in the graph) begins to level off
to a low value by May and June. This suggests that the graph node structure
begins to stabilize after a few months.
Number of New Comment Edges by Month
In addition,
Fig. 2.
New edges between users and subreddits out of total monthly
edges from January to June 2018. The proportion of new edges in the graph
remains fairly high even by May or June.
mented on 6.63 unique subreddits and made 49.4 comments.
Figure | illustrates how the graph nodes structure (i.e. users
and subreddits) stabilize by May or June while Figure 2
shows how the number of new graph edges (i.e. comments
on new subreddits by a user) remains fairly robust into later
months.
A. Preprocessing
Historical
Behavior,
we
build
a user-
subreddit bipartite graph in which an edge is drawn from
each user to a subreddit the user commented on, weighted
by the number of comments the user made to the subreddit.
This results in a graph with 8,876,403 users and 151,144
subreddits, which is computationally intractable given our
available resources. As Figure 3 demonstrates, a majority of
users commented on just one or two subreddits over this
time period. Users who commented on one subreddit do not
connect subreddits in the graph and thus do not contribute
to our graph based recommendation systems, and users who
commented on two contribute very little. At the same time,
making recommendations for these users with very little
information is known as the cold start problem and is beyond
the scope of our project, so we filter them out.
151,144
subreddits
is intractable
resources. As Figure 5 demonstrates,
subreddits have very few unique users
- about 90,000 were commented on by
Jan to May 2018. If we were to filter
however,
given
our
the vast majority of
commenting on them
at most 9 users from
these subreddits out,
we’d be unable to recommend
these subreddits to
new users. Figure 6 demonstrates the impact of such a filter all the subreddits commented on by at most 9 users from Jan
to May 2018 cumulatively gained about 50,000 new users in
June
2018
- this
means
for these
50,000
users
we
would
be unable to recommend one of the correct subreddits. This
is insignificant,
however,
new users gained by
The intuition is that
unpopular subreddits.
subreddits is efficient
applying both the user
since
if we
were
to add
up
the
all subreddits, we’d obtain 7 million.
we have little data on these new or
For these reasons, filtering out these
yet sacrifices minimal accuracy. After
and subreddit filters, we obtain a graph
We evaluate how well various recommendation systems
can predict user subreddit behavior by feeding the systems
“Historical Behavior” and seeing how well they predict “New
Behavior’. Historical Behavior refers to the number of times
each user commented on each subreddit from from January
users from Jan to May made at least 1 comment. This is far
too many users to feasibly evaluate on, and as the average
2018
user made
to
May
2018,
and
New
Behavior
refers
to
which
subreddits a user commented on in June 2018 that they did
not comment on between January and May 2018.
with 4,052,716 users and 54,204 subreddits. The node degree
distribution of our filtered graph is is shown in Figure 4.
For the month
users
with
addition,
of June,
comments
we
found
in 2.42 new
that 2,812,982
subreddits,
insufficient data to effectively
there
are
users
who
made
of the
also includes
evaluate
comments
in
on. In
over
a
Degree Distribution of Users and Subreddit Nodes
+ User Nodes
+ Subreddit Nodes
cumulative number of users in June
Sp rtion of Nodes with a Giv en Degree (log)
subreddit users in June vs. users in Jan to May
Fig. 4.
The final node degree distribution for users (blue) and subreddits
(red) after filtering out users and subreddits. Note the left-side has trailing
values due to our thresholding choices.
101
10?
103
10
number of users from Jan to May
users who
10°
commented
on the same
Reddits
in June 2018,
we’d
get v.
be subreddits, and define a similarity metric S(s,s2) that
is
greater
if s;
and
sz
are
6x10
10°
101
10
103
10%
number of users
10°
more
similar
to
|unique users who commented in sj ()s2|
S(s1,82) = |unique users who commented in sj Usp|
10°
Fig. 5. Cumulative subreddits by the number of users who commented on
them. Data is from Jan to May 2018 (Historical Behavior). Let (u,s) be a
point on the curve in the graph. This point represents that if we were to
count up all the subreddits commented on by at most wu users, we’d have s
subreddits.
Next, let W(sị;k) be the k-nearest neighbor subreddits to
subreddit s; as defined by similarity metric S(s,,s2), and
then given a query user u and set of subreddits S$, that u
commented on in the Input Graph, we score a subreddit s
using the following:
Score(s) =
thousand new subreddits, such as “CommonMisspellingBot”
- these are likely to be bots.
In order to have meaningful evaluations, we generated our
test set by randomly sampling 100 selected users out of
118,620
users
who
commented
on
between
10 to
100
subreddits.
IV.
For our baseline, we rank all the subreddits by number of
users. For each user u in our test set, we recommend
the top
n subreddits with the most users, excluding the ones
already commented on from January to May.
has
B. Item-Item Collaborative Filtering
item-item
a
method
collaborative
based
on
Deshpande
filtering technique.
S(s1,2)
Finally, we recommend the top n subreddits by highest score.
C. Resource Diffusion: Original Mass Diffusion
In this section, we use Greek letters for subreddits and
Latin letters for users for ease of readability in line with [1].
For user i, subreddit a, the adjacency matrix Ajq is given
by:
METHODS
A. Baseline: Popularity
use
3`
$1 Su 89 EN (513k)
We provide a brief theoretical outline of each approach
for recommendations.
We
considered
eachother. While Deshpande et al used Cosine Similarity
and Conditional Probability-Based Similarity, we use Jaccard
Similarity, which is independent of edge weights. This is
given by:
4x10
the
10
Fig. 6. Comparing user comments in June vs. user comments in the same
subreddits from Jan to May. Let (u,v) be a point on the curve in the graph.
This point represents that if we take all the subreddits that were commented
on by at most wu users from Jan to May 2018, and sum up the gain in new
cumulative subreddits by number users commented on
subreddits commented on by at most that many users
10°
et
al.’s
Let s;
and
[21]
sy»
Aia =
and
the degrees
0,
if user i comments on reddit @
1,
otherwise
.
for user
i and
subreddit
œ
are k; and
Œ)
kg
respectively.
The two-step process of Mass Diffusion is as follows:
Step 1: For target user i, we distribute resources from
subreddits that i has participated in to other users j based on
the subreddit degrees:
mm
fy=
n
œ=I
A.A;
iaA ja
ka
Step 2: For target user i, their resources
recovered by:
m
po
Sig
The
recommendation
on item f is
subsequently aggregated into the vector scores.
A.
IB
gr
k; Sij
a ),
j=l
We
“i
list for target user i is obtained
by
ranking the final resource vector; the subreddits that have
recovered the most resources are the recommended subreddits.
D.
Resource Diffusion: Mixed Similarity Diffusion
Based on the Mixed Similarity Diffusion introduced by
Wong. [1], we extend mass diffusion by utilizing the number
of comments made by users on subreddits as our explicit
feedback. In the first step, the resource distribution to users
is weighted by the similarity between the target user 7 and
other users j. We utilize the cosine similarity, where the
similarity between user i and 7 1s given by:
/
where
Rig
is the
š
et
Cos(i,j) =
RigRja
,
/
VXa=i RấvV Xe=i R7z
number
of comments
user
i makes
on
subreddit a.
The two-step process of Mixed Similarity Diffusion is then
as follows:
Step 1: For target user i, we weight the initial distribution
of resources from subreddits that i has participated in to other
users j by their cosine similarities:
fi;
—
y
J
AiaA
œ=I
jaCos(i,
j)
Vy Ak, Cos (i, k)
Step 2: For target user ¡, their resources
recovered by:
ro
Sip
m
_
»L
J=1
A;
JB
on item
¡is
gt
kẦkl~^* Fij
BS]
Random
Walk
We implement a basic version of the Random Walk
Recommendation System as shown in Algorithm 1. In brief,
given a user u, the Scores function returns a vector of
scores, one for each subreddit, and we recommend
the top n
subreddits by highest score that u has not already commented
on in Jan through May 2018. In order to calculate the
scores, we iterate through all subreddit neighbors s of u, and
perform random walks with restarts for N, total steps, with
the subreddit s being the only node in the starting set. The
length of each random walk is sampled from the geometric
distribution with parameter a, a distribution inspired by
PageRank[9] in which a user traversing the graph will have
probability œ of teleporting at each node. During the random
use Multi-Hit Boosting
as introduced
in Pixie[15]
in
order to aggregate subreddit neighbor s score vector scores;
into the final score vector scores; this weighs the scores so
that subreddits visited multiple times from different subreddit
neighbors are weighted higher than ones visited multiple
times from the same
subreddit neighbor. Pixie[15]
also uses
various other techniques, including scaling N, based on the
degree of subreddit neighbor s and biasing the random walk
using additional user preferences. We found the former to
be ineffective on our graph, while the latter difficult due to
lack of more data on Reddit user preferences in our graph.
The basic random walk serves as a good baseline for the
potential of the algorithm, and we comment on advantages
and extensions in the Results section.
Algorithm 1 Random Walk Algorithm
1: procedure SCORES(User u, Graph G, Real a, Int N)
5:
$§Ccores — 0
3:
4:
5:
6:
7
N; — N/|Neighbors(u,
G) |
for all s € Neighbors(u,G) do
scores, <- RandomWalk(s,G, a, Ns)
scores <— scores + ,/SCOreSs
return scores”
8: procedure RANDOMWALK(Subreddit s, Graph G, Real
a, Int N;)
9:
totalSteps <0
11:
while totalSteps < N, do
10:
scores, —0
12:
curSubred <— s
14:
for i from 1 to walkLength do
13:
15:
16:
17:
where A is introduced as an additional hyperparameter
between O and 1 to weigh for the relative importance of
the the users’ degree and the subreddits’ degree in this step.
Subreddits are ranked by amount of resources recovered.
E.
walks for subreddit neighbor s, we record the number of
times we visit each subreddit in the vector scores,;, which is
18:
19:
walkLength — GeometricDist()
curU ser < RndNeighbor(curSubred,G)
curSubred <— RndNeighbor(curUser,G)
scores;|curSubred] <— scoress|curSubred] + 1
totalSteps < totalSteps + walkLength
return scores,
F. Community Detection on the Folded Subreddit Graph with
the Leiden Algorithm
The Leiden algorithm [12] for community detection is
similar to the Louvain algorithm in many respects. The
Leiden algorithm consists of three phases: (1) local moving
of nodes, (2) refinement of the partition and (3) aggregation
of the network based on the refined partition, using the
non-refined partition to create an initial partition for the
aggregate network. We outline two of the key stages similar
to the Louvain algorithm while offering key refinements:
optimization and aggregation.
Phase 1: Local Node Optimization: We start by initializing a queue with all nodes in the network. The nodes are
added to the queue in a random order. We then remove the
first node from the front of the queue and we determine
whether the quality function can be increased by moving this
node from its current community to a different one. If we
move the node to a different community,
we add to the rear
of the queue all neighbours of the node that do not belong
to the node’s new community and that are not yet in the
queue. We keep removing nodes from the front of the queue,
possibly moving these nodes to a different community. This
continues until the queue is empty. After all nodes have been
visited once, Leiden visits only nodes whose neighbourhood
has changed, whereas Louvain keeps visiting all nodes in the
network. The pseudocode is shown in Algorithm 2.
Algorithm 2 Leiden Phase 1: Local Node Optimization
1: procedure MOVENODESFAST(Graph G, Partition P)
2:
OQ + QUEUE(V(G))
3:
while z0 do
> Continue until no more nodes.
4:
v + Q.remove()
5:
C' + argmaxcepyug AH p(v > C)
7:
8:
voc
N € {u|(u,v)
€ E(G),u¢C'}
6:
Algorithm 3 Leiden Phase 2: Aggregation (Refined)
PY bk
G, Partition P)
{(C,D)|(u.v) € E(G),u € C € 7„;,v€De€
mo
Pref}
return Graph(V,E£)
ees
iw
: procedure REFINEPARTITION(Graph
=
°
1
im
Q =z—}
Pref <- SingletonPartition(G)
G, Partition P)
for Ce P do
7; — MergeNodesSubset(G, 7„„;,
C)
return ?⁄/
2m
Bornholdt’s
a y linear reso-
kịk;
| (Aij—y—
ij r3)) 6(G,
(G¡, 0;Ø;)
V.
METRICS
FOR RECOMMENDATION
To present a comprehensive evaluation of the recommendation systems investigated, we utilize a number of wellknown recommendation metrics. Given a user u, we define
“recommended subreddits” as the ranked list of subreddits
our algorithm recommends for user , and “relevant subred-
dits” as the target list of subreddits, that is, the subreddits
that uw commented on in the month of June for the first time.
A.
Precision@n
subreddits,
Precision@n
is
the
fraction
of
|{relevant subreddit} M {retrieved subreddit}|
|{retrieved subreddit}|
We will be using n = 10 to evaluate our recommendation
systems.
B. Mean Reciprocal Rank
gives a good measure of how many
recommended subreddits are relevant, it does not take into
consideration the order in which we rank the recommended
subreddits. MRR, or Mean Reciprocal Rank, addresses this
by utilizing the reciprocal of the rank of the first relevant
subreddit in the recommendation list, averaged across all
users, defined as:
MRR=
y?
|U|
ucU
1
rank,
where U is the set of users and rank, is the rank of the first
relevant recommendation for user u.
Phase 2: Aggregation with Refinement:
Aggregation is
almost identical to the Louvain algorithm with a key difference. In the refinement phase, nodes are not necessarily
greedily merged with the community that yields the largest
increase in the quality function. Instead, a node may be
merged with any community for which the quality function
increases. The pseudocode is shown in Algorithm 3.
Lastly, note the Louvain and Leidag algorithms can be
optimized for any quality function. The vanilla modularity
quality function [12] is
1
O=_——
and
introduces
Note that this is identical to vanilla modularity when y= 1.
While Precision@n
V CC?
Ec
is Reichardt
which
lution parameter term to modularity
Precision@n=
Pref <- RefinePartition(G,P)
[22]
relevant subreddits, formally:
return P
1: procedure AGGREGATEGRAPH(Graph
function
model
recommended
Q.add(N — Q)
10:
quality
(RBP)
Precision@n is an important evaluation metric for ranking
predictions in recommendation systems. Given a list of n
if AH.p(v > C’) > 0 then
9:
Another
Potts
a
(41
kik;
— =)
ô(G;,Ø;)
where A is the adjacency matrix, k; is the (weighted) degree of node i, m is the total number of edges (or total
edge weight), sigma; denotes the community of node i and
6(0;,0;) = 1 if 6; = 0; and 0 otherwise.
C. Mean Average Precision
MAP, or Mean Average Precision, also takes into consideration the order in which we rank the recommended
subreddits. However, while MRR
only considers the rank of
the first relevant result per user, MAP considers the rank
of all the relevant results within the list of recommended
subreddits. The use case determines which metric is more
useful.
MAP is calculated by averaging the Precision@n values
for all relevant subreddits in the recommendation list per
user, and then averaging this value over all users, defined as:
1
1
MAP = —
` Ta
` Precision@ranks,
|U| ue|U|
Su
seSy
where S, is the set of relevant subreddits for user u and
rank,,, is the rank of subreddit s in the recommendation list
for user u.
VI.
A.
RESULTS
Quantitative Results
We generate a recommendation list for each user in our test
set of 100 users, using each of our algorithms, and evaluate
them
using
the 3 metrics,
Precision@10,
MRR
and
MAP.
The results are tabulated in Table I.
The investigated recommendation systems all performed
better than baseline on all 3 metrics. Intuitively, this is
because all other systems take into account user-specific
preferences, while the popularity baseline only takes into
account global subreddit preferences. In addition, Collaborative Filtering performed best on Precision@10, and Mixed
Similarity Diffusion performed best for MRR and MAP.
Collaborative Filtering performed well on all 3 metrics.
By representing subreddits as a vector of users, and taking
into account pairwise similarity over all subreddits, the userpersonalized recommendations from Collaborative Filtering
had the highest Precision@
10 = 0.141. However, it is also
the most computationally expensive algorithm presented
here. Finding the nearest neighbors of a subreddit involves
comparing against all other subreddits, and we’d have to
perform this action for all subreddits a user commented on,
for each user. This can take on the order of hours to days if
we had to recommend subreddits for many users. We can
potentially cache this information, but of course as users
post new comments, the nearest neighbors may change as
well. That said, there are also nearest neighbor approximation
techniques that can significantly speed up this approach, such
as Locality Sensitive Hashing.
By taking into account edge weights, Mixed Similarity
Diffusion showed significant improvements over the original
Mass Diffusion algorithm. Interestingly, Mixed Similarity
Diffusion performed best when the hyperparameter A = 0,
and
worst
when
A = 0.9.
Intuitively,
this
means
that
in
the second step of the diffusion, recovering resources based
on the degrees of similar users rather than the degrees
of subreddits generated more relevant recommendations.
Mixed Similarity Diffusion also performed best on both
MRR
= 0.385
(the first relevant result is ranked
the recommendation
implying that it was
rank the personalized
Another significant
is
the
runtime
2 to 3 on
list on average) and MAP = 0.0968,
not only able to retrieve, but also best
recommendations.
advantage of the diffusion algorithms
performance,
as
recommendations
can
be
generated modularly for each target user, without having
to perform calculations on the entire graph. The runtime to
generate recommendations for each user took an average of
15 seconds for Mass Diffusion and 25 seconds for Mixed
Similarity Diffusion, where the additional time was incurred
to compute the cosine similarity between target user and
connected users.
The basic Random Walk showed average performance
relative to the other recommendation algorithms. High degree
subreddits connect a very large portion of the graph (70,0001,000,000
users).
of subreddits
This
tuned
means
towards
that,
the
while
user
a starting
incorporates
set S
some
degree of individual user preference, a Random Walk without
biasing the edges is still likely to visit subreddits with high
degrees more. In addition, it is very likely for these very
high degree subreddits connect a diverse set of users, and
thus Random Walk will likely traverse to a user unrelated
to the original user from a high degree subreddit. We reason
that it is because of this that scaling N, (the number of steps
per subreddit neighbor s) with the degree of subreddit s, a
technique used by Pixie, did not perform well for our graph.
In addition, this means that global subreddit preference has
a heavier than desired influence on the Random Walk, and we
reason that biasing the Random Walk using additional user
preferences is crucial for good performance, as Eksombatchai et al.[15] indicated in their work on Pixie. Unfortunately,
our graph does not contain more information about user
preferences besides the number of comments (which did not
perform well), but biasing the algorithm would be interesting
future investigation. This is especially true considering that
this algorithm performed the fastest of all the algorithms we
tried (besides the popularity baseline), averaging at about 0.5
seconds per user.
B.
Qualitative Results
In order to better understand the performance of various
recommendation systems, we examine the top 10 recommendations
for
user
“Jxxxxxxx”
(full
userld
withheld
to
protect privacy). Results are tabulated in Table II. This user
commented on the following Pokemon themed subreddits in
the months of January to May (which we use to generate
recommendations):
CasualPokemonTrades,
PokemonPlaza,
Pokemongiveaway,
pokemontrades,
pokemon
Then, the user continued on to comment in 5 new Pokemon themed ones in the month of June (which we use as
our test set of relevant subreddits):
relaxedpokemontrades,
pokemonrng,
Pokemonexchange,
PokeMoonSun,
SVExchange
Our popularity baseline fared very poorly on this user,
recommending none of the relevant subreddits, intuitively
because this user has very specific tastes. Collaborative Filtering recommended the most relevant subreddits (correctly
recommending
4 of 5 relevant subreddits),
and none
of the
most popular subreddits, indicating a high degree of userspecific preference. This is followed by Mass Diffusion and
Mixed
Similarity Diffusion, which recommended
3 relevant
subreddits, and 2-3 of the most popular subreddits. Finally,
Random
Walk
recommended
2 relevant
subreddits,
and
5
of the most popular subreddits, indicating that indeed an
unbiased Random Walk is too heavily weighted towards
popular subreddits.
These results illustrate that the algorithms make a trade-off
in how much to incorporate global subreddit preferences into
user-specific recommendations. For user “Jxxxxxxx”, global
subreddit preferences are useless, but this does not mean
they are unimportant in recommendation systems. After all,
TABLE
OF VARIOUS
I
RECOMMENDATION
SYSTEMS
S
EVALUATION
TABLE
RECOMMENDATIONS
FOR USER
’JXXXXXXX’
II
(RELEVANT
RECOMMENDATIONS
ARE BOLDED)
aww,
friendsafari,
stunfisk,
PokemonCreate,
(A
= 0)
NintendoSwitch,
friendsafari,
, stunfisk
(N = 100000, a = 0.5)
friendsafari,
the popularity baseline fared decently on our quantitative
metrics, showing that users can be attracted to popular
subreddits regardless of individual preferences.
C.
Community Detection for Recommendation
Our folded subreddit graph contains 52,050 subreddit
nodes and 384,663,141 weighted edges (weighted by the
number
of users that commented
on both subreddits) in the
five months from January to May. The size of our graph
makes it imperative for our community detection algorithms
to run efficiently. We evaluate the Leiden community detection algorithm on the folded subreddit graph and tabulate the
quantitative results in Table III.
TABLE
EVALUATION
OF QUALITY
DETECTION
RB Potts (y=4.0)
III
FUNCTIONS
FOR LEIDEN
COMMUNITY
OPTIMIZATION
)
=8.0)
The modularity value from using vanilla modularity with
Leiden optimization was 0.0156. However, only 7 commuwere
detected
of sizes
36680,
13145,
2195,
11,
10,
5, and 4 where the largest community was 70 percent of
subreddits. Clearly we see the resolution limit issue, causing
smaller communities to be clustered into larger communities.
In previous work, Leskovec
et al. [13] found that above the
size scale of roughly 100 nodes the network community
profile plot gradually increases, and thus there is a nearly
inverse relationship between community size and community
quality.
Using Reichardt and Bornholdt’s Potts (RBP) quality function, with y= 8.0, we had an improved modularity score of
0.0264 and 7256 detected communities.
Notably, the vanilla
NintendoSwitch
modularity score improves even though we are optimizing
a modified quality function. The largest community was of
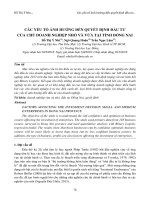
2495 subreddits. Figure 7 shows the distribution of community sizes using the RBP metric. We limited our exploration
of the resolution y values due to computational limitations.
To find an optimal range of values for y, however, one could
construct a resolution profile by bisectioning values of y.
Next, we qualitatively examined communities generated
by the RBP model in Table IV. While smaller communities
(< 100 like Community 3, 4, 5, or 6) can contain strong
recommendations they limit the number of possible recommendations. Only the other hand, subreddits in larger communities (> 200 like Community 1) are less clearly relevant
and may contain merged sub-communities. However, these
large communities may offer still less ‘direct’ recommendations. Interestingly, Community 6 contains many divorce
and infidelity reddits but also contains indirect subreddits
like ‘FindMeFood’ (‘A sub to help tourists or passersby find
places in the local area to eat good food with the help of
reddit.’) and "Memoir? (‘A place to share stories of your
life events
nities
news
or create
stories
for fictional
characters’).
This
suggests that some small communities may also be able to
offer indirect recommendations.
Lastly, we examine how well the community structure
we found from January to May translates to the month of
June. We construct a new projected subreddit graph from
comments made in the month of June. Recall that in a
projected subreddit graph, an edge between two subreddits
represent users have commented on both subreddits. Out of
the
107,362,861
edges
between
subreddits
in the month
of
June, we only consider edges with both subreddit nodes seen
in the previous months. This leaves 98,966,519 edges. We
recompute the modularity using the communities found by
the Leiden algorithm from January to May and find a positive
modularity of 0.0165 for our June subreddit graph. This
TABLE
EXAMPLE
Comm. |
Randomly
683
FifaMobileBuySell,
Size
Community
1
COMMUNITIES
Sampled
(n =
2
161
metalproduction,
GTA_Vinewood,
AbletonLive9,
SouthJerseyMusic,
DETECTED
BY LEIDEN
ALGORITHM
15) Subreddits
PokemonGolndia, culture, The_Italia,
Montages, GoldCoastTitans
Community
IV
OF SUBREDDITS
Analysis
reptilians,
cmake,
legalporno,
truecapitalistradio,
AdvancedProduction,
PittsburghLocalMusic,
inspiration,
FetishCouples,
ETL,
IsolatedVocals,
musicbusiness,
Frightfurs,
gamecomposers, |
FL-Studio,
handpan, |
wavesaudiophiles, chopping, presonus, MusicFeedback4All, MusicGear
Community
3
87
Community 4 || 64
Community 5
Community
6
35
22
wii, sm64hacks, MedalHeroes, metalslug, punchout, Gameboy, dawes,
gamecollectors, GoldenEye, AtariJaguar, nokia3310, SEGA, gamerooms,
retrogaming,
snes
clear
ECMAScript,
webaccess,
DCEUIeaks,
MichelleWolf,
MUBookClub,
DCcomics,
javascript
Cyclopswasright,
laravel,
elementor,
DC Cinematic,
AsOneAfterInfidelity,
Fables,
BMS,
batman,
Angular2,
website-design_info,
large
Music
com-
comicbookscirclejerk,
papergirls,
themed
munity.
| Game
themed
learn- |
relation-
ship (due to
comm. size).
javascript_jobs, Web_Development, reactjs, FullStack, loljs, Heroku, learnphp, angular, | Web
themed
console
community.
development
community.
arkhamgames, | Comic book themed
TrueComicBooks,
divergent, |
community.
Superboy
OnlineAffairs, Divorce, SingleParents, Islamic, DivorceHelp,
gleDads, Marriage, FindMeFood, adultery,
delity, naughtyfromneglect, Affairs
deadbedroom,
Distribution of Community Sizes
Custody,
addition,
e of Communities
3)
© 1000
500
suggests that using communities of subreddits identified from
January to May remain strongly connected into the month
of June. Users continue to comment on subreddits within
the same communities, including new subreddits that they
haven’t commented on before. This indicates that community
detection offers a basis for recommendation.
CONCLUSION
In summary, our key contributions for this paper are:
1) We implement and evaluate several graphical recommendation systems on a user-subreddit bipartite graph
in order to recommend new subreddits for users to
comment on. These systems include both classical
approaches and very recent approaches, most of which
have never been evaluated before on this graph.
2) We demonstrate that while all recommendation systems outperform our popularity baseline, each recommendation system makes trade-offs in recommendation
quality and runtime. In particular, while Collaborative
Divorce
and
delity themed
munity.
Inf-
com-
each
system
makes
trade-offs
in how
much
to consider globally preferred subreddits in making
recommendations.
We investigate the Leiden algorithm for community
detection on our folded subreddit graph, incorporating
the Reichardt Bornholdt Potts (RBP) quality function
to address the resolution-limit problem of modularity.
We show that this approach yields meaningful communities of subreddits at up to a certain size. We also show
preliminary results that indicate these communities can
produce relevant recommendations.
2 1500
Fig. 7.
The distribution of community sizes for Leiden algorithm using
RBP (y= 8.0). Large community (> 200) become uninterpretable while
small communities (< 10) are Interestingly, the cumulative distribution of
community sizes (not shown) appear to follow the power law, similar to
[24]. It is unclear why such a distribution should arise (sociology of user
interactions or dynamics of Leiden algorithm) but it is proposed as an area
of future research.
Sin- |
SurvivingMyInfi- |
Filtering and Mixed Similarity Diffusion perform the
best, the Random Walk approach ran the fastest. In
2500
VII.
| No
|
9
Our results indicate that implementing a personalized recommendation system on Reddit may improve new subreddit
discovery at the expense of incurred computational time. In
terms of future work, more work can be done in biasing the
Random Walk towards user-specific subreddit preferences.
For example, Reddit metadata such as user upvotes and
downvotes are valuable sources of information about user
preferences. The next step for community detection based
algorithms is finding ways to directly incorporate community
clusters into recommendation systems. In particular, subreddits belonging communities up to a certain size can offer
meaningful and interpretable recommendations. In addition,
we would like to investigate the performance of various
content-based recommendation algorithms, and perhaps incorporate them into our graphical approaches.
VIII.
LINK TO GITHUB
The code for this project is publicly available at:
/>REFERENCES
[1]
X.
Wang,
Y. Liu,
G.
Zhang,
Y. Zhang,
H.
Chen
and
J. Lu,
"Mixed
Similarity Diffusion for Recommendation on Bipartite Networks,”
in IEEE Access, vol. 5, pp. 21029-21038, 2017. doi: 10.1109/AC-
CESS.2017.2753818
[2]
in bipartite
S. Jamonnak, J. Kilgallin, C. Chan and E. Cheng, ”Recommenddit. A Recommendation
Service for Reddit Communities,’ 2015
[151
International Conference on Computational Science and Computational Intelligence (CSCI), Las Vegas, NV, 2015, pp. 374-379. doi:
10.1109/CSCL2015.64
[3]
Nguyen,
[4]
[5]
Zhou
[6]
[7]
[8]
[9]
[10]
[LH
[121
[13]
[14]
H., Richards, R., Chan,
CC.
et al. J Intell Inf Syst (2016) 47:
247. />Baumgartner, Jason. />T,
Ren
J,
Medo
M,
Zhang
Y-C
(2007)
Bipartite
network
projection and personal recommendation. Phys Rev E 76:046115.
M. J. Barber, Modularity and community detection in bipartite networks,
Physical
Review
E, vol. 76, no. 6, p. 066102,
Larremore,
D.
B.,
Clauset,
A.,
&
Jacobs,
A.
Z.
(2014).
Efficiently
E, 90(1), 012805.
Page, Lawrence, et al. The PageRank citation ranking: Bringing order
to the web.
Hu,
Y.,
Stanford InfoLab,
Chen,
H.,
Zhang,
P.,
Li,
M.,
Di,
Z.,
Fan,
Y.:
2015.
Mark
E. J. Newman
community
2004.
Leskovec,
structure
J., Lang,
and Michelle
in networks.
K.
Girvan.
Physical
J., Dasgupta,
A.,
&
Finding
Review
and
E,
Mahoney,
M.
W.
(2008,
April). Statistical properties of community structure in large social
and information networks. In Proceedings of the 17th international
conference on World Wide Web (pp. 695-704). ACM.
Yaozu Cui and Xingyuan Wang. Detecting one-mode communities
10
Mech. Theory Exp.
(2012).
Traag,
[19]
Linden,
[20]
Resnick,
[24]
69(2):026113,
A:
A system for recommending
3+
billion items to 200+ million users in real-time.” Proceedings of the
2018 World Wide Web Conference on World Wide Web. International
[18]
[23]
evaluating
et al. ’Pixie:
Physica
2016.
L. Waltman
Comparative
definition of community and corresponding identifying algorithm.
Phys. Rev. E 78(2), 026121 (2008)
Atsushi Miyauchi and Noriyoshi Sukegawa. Maximizing Barbers
bipartite modularity is also hard. Optimization Letters, 9(5):897913,
Chantat,
triangular.
457:307315,
{17]
[22]
1999.
bipartite clustering
World Wide Web Conferences Steering Committee, 2018.
V. D. Blondel, J.-L. Guillaume, R. Lambiotte, and E. Lefebvre, J. Stat.
[21]
inferring community structure in bipartite networks. Physical Review
Eksombatchai,
by
and its Applications,
[16]
2007.
X. Liu and T. Murata, Community detection in large-scale bipartite networks, in Proceedings of the 2009 IEEE/WIC/ACM International Joint Conference on Web Intelligence and Intelligent
Agent Technology - Volume 01, ser. WI-IAT 09. Washington, DC,
USA: IEEE Computer Society, 2009, pp. 5057. [Online]. Available:
/>
networks
Statistical Mechanics
V.,
10008, 6 (2008).
and N. J. van Eck, J. Am.
Waltman,
L.,
&
van
Eck,
Soc. Inf. Sci. Technol.
N.
J.
(2018).
to Leiden: guaranteeing well-connected communities.
arXiv:1810.08473.
Greg,
Brent
Smith,
ommendations: Item-to-item
computing 1 (2003): 76-80.
and
Jeremy
collaborative
Paul, et al. °GroupLens:
an open
York.
From
Louvain
arXiv preprint
”Amazon.
filtering”?
63, 2378
IEEE
com
rec-
Internet
architecture for collabora-
tive filtering of netnews.” Proceedings of the 1994 ACM conference
on Computer supported cooperative work. ACM, 1994.
Deshpande, Mukund, and George Karypis. ’Item-based top-n recommendation algorithms.’ ACM Transactions on Information Systems
(TOIS) 22.1 (2004): 143-177.
Reichardt,
J., &
Bornholdt,
S. (2006).
munity detection. Physical Review
RevE.74.016110
Statistical
mechanics
E, 74(1), 016110.
Traag, V. A., Van Dooren, P., & Nesterov, Y. (2011). Narrow
resolution-limit-free community detection. Physical Review
016114.
of com-
10.1103/Phys-
scope for
E, 84(1),
10.1103/PhysRevE.84.016114
Clauset, A., Newman,
M. E., & Moore, C. (2004). Finding community
structure in very large networks. Physical review E, 70(6), 066111.