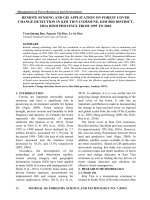
Application of geospatial technology to assess forest changes in cao phong district, hoa binh province
Bạn đang xem bản rút gọn của tài liệu. Xem và tải ngay bản đầy đủ của tài liệu tại đây (8.86 MB, 63 trang )
MINISTRY OF AGRICULTURE AND RURAL DEVELOPMENT
VIETNAM FORESTRY UNIVERSITY
STUDENT THESIS PROPOSAL
Tittle
APPLICATION OF GEOSPATIAL TECHNOLOGY
TO ASSESS FOREST CHANGES IN CAO PHONG DISTRICT,
HOA BINH PROVINCE.
Major: Advanced Curriculum in Natural Resources Management
Code: D850101
Student: Bui Nhat An
Student ID: 1254040579
Class: K57 -Natural Resources Management
Course: 2012 – 2016
Supervisor:
Assoc.Prof. Phung Van Khoa
Dr. Nguyen Hai Hoa
Ha Noi, 14/10/2016
ACKNOWLEDGMENT
First of all, I would like to express sincere gratitude to my mentors. Assoc. Prof. Dr.
Phung Van Khoa and Dr. Nguyen Hai Hoa have supported me in my studies and related
research, their patience, motivation and extensive knowledge. Thanks to the guidance of the
two people who helped me during the research and writing of this thesis.
I sincerely thank Mr. Cuong, Mr. Thang and Director Cao Phong FPU Mr. Hien. I am
extremely thankful and grateful to him for sharing experiences, and sincere and valuable
guidance and encouragement extended to me.
I also put on record, my feelings of gratitude to one and all who directly or indirectly,
has lent their hand in this venture.
Hanoi, October/ 2016
Bui Nhat An
TABLE OF CONTENTS
ACKNOWLEDGMENT
TABLE OF CONTENTS
LIST OF TABLES
LIST OF FIGURES
ABSTRACT .......................................................................................................................... 1
I, INTRODUCTION ............................................................................................................ 4
1.1. Overview of research issues: ........................................................................................... 5
1.1.1. Definition: .................................................................................................................... 5
1.1.3. Map the current status of forest resources: .................................................................... 9
1.1.4. Forest changes: ............................................................................................................. 9
II, GOALS AND (SPECIFIC) OBJECTIVES:................................................................. 11
2.1. Objective Research:....................................................................................................... 11
2.2. Research content. .......................................................................................................... 11
2.2.1. Research forest management situation in Yen Lap, Cao Phong district, Hoa Binh
province: .............................................................................................................................. 11
2.2.2. Research mapping forest status and fluctuations in Yen Lap, Cao Phong district, Hoa
Binh province: ..................................................................................................................... 11
2.2.3. Research fluctuations cause regional forest research: .................................................. 11
2.2.4 . The study recommended effective measures to improve forest management in Yen Lap: ... 12
III, STUDY AREA AND DATA:....................................................................................... 13
3.1. Study Area: ................................................................................................................... 13
IV. METHOD: ................................................................................................................... 15
4.1. Image classification method. ......................................................................................... 15
4.1.1 Image data research use. ............................................................................................. 15
4.1.2 Methods of visual image interpretation. ...................................................................... 15
4.1.3 Classification method using NDVI images. ................................................................ 15
4.1.4. Real investigative methods. ....................................................................................... 16
4.2. Method of mapping the forest area. .............................................................................. 17
V. RESULTS DISCUSSION 5.1 Current status of forest management in Yen Lap
Commune, Cao Phong district, Hoa Binh province : ....................................................... 18
5.2. Results forest changes through the years of research :.................................................... 19
5.2.1 Results of sample collected: ........................................................................................ 19
5.2.2 Construction image classification: .............................................................................. 26
5.2.3. Map of forest status through years of research: ........................................................... 27
5.3. Causes of regional forest change research : .................................................................... 35
5.3.1. Social and economic factors affecting forest management activities: .......................... 35
5.4. Research suggest solutions to improve the efficiency of forest management in Yen Lap: ....... 37
5.4.1. Management solutions for forest protection and forest fire prevention: ....................... 37
5.4.2. Solutions for scientific research and technological applications: ................................. 38
VI. RECOMMENDATION OF THESIS .......................................................................... 40
VII. CONCLUSIONS ........................................................................................................ 41
7.1 Conclusions................................................................................................................... 41
7.2 Recommendations for the research and assessment of forest change in Yen Lap
commune: ............................................................................................................................ 42
VIII. REFERENCE.
I. Vietnamese documents:
IX. APPENDICES
LIST OF TABLES
Table 1.1. sensors Features of Landsat 7 and Landsat 8 (LDCM). ........................................... 7
Table 1.2. The main application of Landsat. ............................................................................ 8
Table 4.1. Landsat data collected in the topic ........................................................................ 15
Table 5.2: Forest land area Yen Lap Commune over the years studied (ha). ......................... 27
Table 5.3 Assessing the accuracy of the maps in 2015. .......................................................... 31
Table 5.4 Assessment of the map precision, 1995, 2005 ........................................................ 31
Table 5.5. The forest change area stages from 1995 to 2005. ................................................ 31
Table 5.6. The forest change area stages from 2005 to 2015………………………….……..33
LIST OF FIGURES
Figure 3.1: Location of the Yen Lac commune in Cao Phong District .................................. 14
Figure 4.1. The steps to build maps of forest cover and change ............................................ 17
Figure 5.1: Results NDVI study area in 2015 ...................................................................... 26
Figure 5.2: Map the spatial distribution of forest status study area (Landsat 1995)................ 28
Figure 5.3: Map the spatial distribution of forest status study area (Landsat 2005)………....29
Figure 5.4: Map the spatial distribution of forest status study area (Landsat 2015)……... ...30
Figure 5.5. Map of forest cover in the period 1995 - 2005 .................................................... 32
Figure 5.6. Chart of YEN LAP commune forest changes in 1995 – 2005 ............................. 33
Figure 5.7. Map of forest cover in the period 2005-2015. ..................................................... 34
Figure 5.8. Chart of YEN LAP commune forest changes in 2005 - 2015 ............................. 35
ABSTRACT
1. Thesis: “APPLICATION OF GEOSPATIAL TECHNOLOGY TO ASSESS
FOREST CHANGE IN CAO PHONG DISTRICT, HOA BINH PROVINCE”.
2. Students implementation: Bui Nhat An
3. Instructors:
PGS Phung Van Khoa
T.S Nguyễn Hải Hòa
4. Research objectives:
Goal: Contribute to the scientific basis for the application of remote sensing and
GIS technology to propose solutions to improve the management of forests in Yen Lap
Commune, Cao Phong district, Hoa Binh province.
Objective:
- Assessing the current state of forests in Yen Lap
- Proposed solutions to effectively contribute to improving forest management in Yen Lap
5. Research content:
Research to assess the status of forest management in Yen Lap, Cao Phong district,
Hoa Binh province.
- Forest management activities in the buffer zone area of research.
- Forest area and distribution space research area.
- The forms of forest management with the participation of local people study area.
Studies assessing changes in forest area of Yen Lap
- Mapping forest cover changes over the years studied (1995, 2005 and 2015).
- Mapping forest cover changes over the study period.
- The rating change causes forest area over the period studied.
1
Studies assessing the factors affecting forest management
- Assessment of factors affecting forest policies to forest management activities the
study area.
- Evaluate the population, society: The development of population and population
density.
- Assessing the impact of infrastructure quality: The quality of roads, about the
roads to forest areas to distribution.
- Assessing the impact of scientific and technological factors, effective techniques
to forest management research areas.
Research suggest solutions to improve the efficiency of forest management at the
commune.
- Economic - social solutions group
- Group technical solutions, science and technology.
6. The results achieved:
Research results on the status of forest management in the area of the subject has
shown that the management of forest protection still faced many difficulties due to the poor
people's lives, people are not fully aware of the responsibility management and protection of
forest resources, not timely capture the policies of the Party and the State on forests and
forest land, or even indifferent, failing to take measures to prevent the exploitation of forest
products, hunting wild animals in an area of forests and forest land allocated.
From the application of remote sensing and GIS technology topics have
successfully built a database and maps of the forest in 1995, 2005, 2015, map changes in
forest resources and forest land 1995-2005, 2005 to 2015 for Yen Lap commune
By means of the application of remote sensing technology and GIS Landsat This
study evaluated changes in forest resources is faster, saves time, effort and ensures a
2
relatively high accuracy (82.3%). The study results showed that the study area is relatively
well preserved, the area of forest land have continuous forest, 1995-2005, 2005-2015 is
463.89 ha lost. The forest area is decreasing over the period. However, the results show
that there is still a part of the area of forest land has not been used.
Research results on the status of forest management in the area of the subject has
shown that the management of forest protection at the difficulties faced by poor people's
lives, people are not fully aware of the responsibility responsible for management and
protection of forest resources, not timely capture the policies of the Party and the state of
forests and forest land, or even indifferent, failing to take measures to prevent the
exploitation of forest products, hunting catch wild animals in the forest area and forest land
allocated.
Causes of decline forest research area is due to adverse effects of local people on
forest resources and by the economic policy - society does not work, has not improved the
lives of people .
From the results collected, investigations have shown the difficulties and
advantages in management, protection of forest resources at the same lifetime propose
appropriate solutions to management. On this basis, the project has set out some solutions
for a sustainable development of forest land areas of study include:
- Solution Management organization
- Management Solutions forest protection and forest fire prevention
- Solutions for scientific research and technological applications
- Solutions for Land Management
- Solutions to attract investment
3
I, INTRODUCTION
Forest is the extremely precious resources of each nation. The value of the forest
resources depends on the their function and proper use. Forest is gold if there are
management solution to protect and develop it effectively. This problem needs more
considerate, specially in this time, forest resources are being reduced seriously. It affects
our ecology and stable development. To protect our forest, Vietnam and worldwide issued
many politics, law, decree… and to make them become more and more effective, we need
more support in technique and technology.
Nowadays, the development of science and technology we need satellite images
and remote sensing GIS to support human in researching forest movements and propose
management methods about the environment and natural resources without direct contact.
Satellite data has multi time, multi spectral, cover vast area quality, which allow us to
update information and do research quickly, effectively. It also help us to save time and
labor. By using satellite images in researching current status and forest resource
movements proved prominent advantage in updating information and analyzing
movements. The using of high pixel satellite images in management resources is the new
step in planning natural forest resources.
Yen Lap commute, Cao Phong district, which locates in the south west of Hoa Binh
province, has various natural and economical condition. Besides, it has many eco-tourist
attractions and resorts. But forest area has been reduced in recent years for many objective
and subjective reasons. We can confirm that forest movements have impact on this local
resource management and protection.
At the present, there is no student thesis on application of landsat satellite images
and GIS in evaluating current status of forest resource in buffer zones of Yen Lap
commute, Cao Phong District, Hoa Binh province. Therefore, there is a limitation of space
and time data in this local area.
Application of landsat satellite images and GIS can provide local data for many
years. It will be scientific basis with high reliability. In researching and proposing
management methods to develop forest resources stably in buffer zones of Yen Lap
commute.
4
So, stable forest resource managements, using tools, modern methods such as
remote sensing and GIS with the high accuracy is necessary for today and the future. They
contribute to the forest resource recovery and development in this local area.
Because of this reasons I have above, titled “APPLICATION OF GEOSPATIAL
TECHNOLOGY TO ASSESS FOREST CHANGE
IN YENLAP COMMUTE, CAO
PHONG DISTRIC, HOA BINH PROVINCE” was made.
1.1. Overview of research issues:
1.1.1. Definition:
Remote sensing is the science and technology to obtain information about an object,
a region or a phenomenon through the analysis of documents obtained by the media. This
means there is no direct contact with the object, area or phenomenon under study.
Remote sensing employed to collect objective information about the Earth's surface and
atmospheric phenomena thanks to sensors installed on the aircraft, satellites, spacecraft or
orbital station located on the . Remote sensing technology to allow remote sensing
technology to record the change of environment and natural resources, has helped the
monitoring and inventory of natural resources and the environment more effectively.
Provides fast remote sensing digital image materials with high resolution, as basic data
for the establishment and adjustment of system maps and databases National Geographic.
Separation of remote sensing information can be classified into 5 categories:
- Classification is the process of split or consolidation of information based on the
universal nature, space and time given by the image of the object to be studied.
- Detection of fluctuation: the detection and separation of the volatility based on
multi-temporal image data.
- Separation of physical quantities: extraction of natural information such as
temperature, atmospheric conditions, the height of the object based on the spectral
characteristics of the image or stereoscopic parallax.
- Separation of the indicators: calculation determining the new index (NDVI
vegetation index ...)
5
- Identifying characteristics: determining disaster, the signs serve archaeological
search…
GIS (Geographic Information System) or geographic system is formed from three
geographical concepts, information and systems.
- Geographical concept relating to the characteristics of the space. They can be
physical, cultural, economic, etc ... in nature.
- The concept of information refers to data that is managed by the GIS. It is the
attribute data of the object and space.
- The concept of GIS systems are built from modules. The modules help create
favorable in the management and consolidation.
Remote sensing data is a source for the GIS database on the basis of the information
layers of different topics; use of overlapping functions or analysis of GIS to create a richer
results. Therefore, the coordination of remote sensing and GIS technology will become
very efficient integration to build and update spatial data serve many different fields.
1.1.2. Features and specifications of the Landsat image:
Landsat is the generic name for the satellite systems used exclusively for purposes
of resource exploration Earth. Landsat satellite system to date can be said is a satellite
system of international nature. The first satellite designed to monitor the Earth's surface,
Landsat-1, was launched by NASA in 1972. Initially called ERTS-1 (Earth Resource
Technology Satellite - Remote Sensing Technique Left probe land), Landsat was designed
as an experiment to test the feasibility of collecting data monitoring multi-spectral earth. Since
then, the program has collected extensive data from around the world from a Landsat satellite.
Subsequent generations 1975 Landsat 2, 1978 - Landsat 3. Two types of Landsat
MSS only equipped (Multispectral Scanner System - multispectral sensor systems: optical
sensor is designed to collect receiving radiation from the light spectrum sunlight strikes the
6
earth's surface under 4 different spectral channels, is integrated by the optical system and
sensors). Landsat 4 was launched into orbit in 1982 and Landsat 5 in 1984, both satellites
are equipped with sensors TM (Thematic Mapper), used to observe the Earth under 7
spectral bands ranging from visual spectrum see to infrared. Landsat 6 and 7 was launched
in 1993 and 1999 with new innovative sensor ETM (Enhanced TM). Landsat 8 satellite
was successfully launched to orbit dated 12.2.2013, with the task of monitoring changes in
forest ecosystems on Earth.
Table 1.1. sensors Features of Landsat 7 and Landsat 8 (LDCM).
Wavelength
Resolution
(µm)
(m)
Band 1
0.45-0.52
30
Band 2
0.52-0.60
30
Band 3
0.63-0.69
30
Landsat 7
Band 4
0.77-0.90
30
(Sensors ETM+)
Band 5
1.55-1.75
30
Band 6
10.40-12.50
60 (30)
Band 7
2.09-2.35
30
Band 8
0.52-0.90
15
Band 1- Coastal aerosol
0.433 - 0.453
30
Band 2- Blue
0.450 - 0.515
30
Band 3- Green
0.525 - 0.600
30
Band 4- Red
0.630 - 0.680
30
LDCM-Landsat 8
Band 5- Near Infrared (NIR)
0.845 - 0.885
30
(Sensors OLI and
Band 6- SWIR 1
1.560 - 1.660
30
TIRs)
Band 7- SWIR 2
2.100 - 2.300
30
Band 8- Panchromatic
0.500 - 0.680
15
Band 9- Cirrus
1.360 - 1.390
30
Band 10- Thermal Infrared (TIR) 1
10.3 - 11.3
100
Band 11- Thermal Infrared (TIR) 2
11.5 - 12.5
100
Satellite
Bands
(Theo Climategis.com)
7
Table 1.2. The main application of Landsat.
Landsat
Wavelength
Applied research shoreline, distinguishing plants
research applications
Blue
in many fields of
0,45pm -0,52pm
research from the
current state to
Green
Application
and soil, forest mapping and identification of other
objects
Used to measure the peak reflectance spectrum of
0,52pm -0,60gm
plant continent, identify vegetative state, identifying
monitor
other objects.
developments and are
Used to define zones help absorb chlorophyll
Red
most commonly used, 0,63 pm -0,69pm
botanical classification, identifying other objects.
at low cost, following
the statistical
Near
Infraredtopics
0,76pm -0,90pm
moisture.
Used to determine the moisture content of
of Landsat
applications in
1,55pm -1,75pm
Short-wave infrared
research:
Used to define plant types, status and biomass, soil
vegetation and soil, the study of mineral rock, snow
2,08pm -2,35pm
and clouds separated.
Spectrum channel
Used to determine when plant is shocked, soil
Thermal infrared
10,4pm -12,5 pm
moisture and temperature mapping.
With lower resolution and spectral continuity, this
Panchromatic
0,52pm -0,9pm
channel
channel's image is used to overlay with other photo
channels, thereby measuring the exact drawing
objects.
8
1.1.3. Map the current status of forest resources:
Map of forest status as thematic maps of forest resources is marginal draw on the
same terrain ratio, which shows full on and the exact location, the area of forest status type
matching results statistics, forest resource inventory periodically. By using colors and
symbols proper show forest conditions, terrain and different materials, it clearly shows the
distribution of the entire region.
Forest status maps and important documents necessary for the management and
development of forest resources and for the economic sector, other techniques are used and
exploitation of forest resources. Map of forest status was established for the purpose:
Demonstrate results statistics, forest resource inventory to the drawing; Basic building
materials for management and development of forest resources; Documentation for
construction Forestry planning options, plan rational use of forest resources, protection
plans, forest management, forest land and inspect the implementation of the forestry plan
was approved by regions and economic sectors.
Forest status map is built for each administrative level: commune, district,
provincial, national, and is a very important tool for assessing changes in forest resources.
1.1.4. Forest changes:
Forests represent our country the basic characteristics of tropical rainforest.
According to the Forest Inventory and Planning Institute, our country's natural forests in
the period 1976 - 1990 decreased 1.7% is 2.7 million ha / year. In recent years our
country's forest resources change is complex, difficult to control tightly. To have a reliable
basis to serve a strategy to protect and develop forest resources rationally and protect the
ecological environment. State to investigate the forestry sector assessment and monitoring
of changes in forest resources in cycles: the first cycle (1991 - 1995), second cycle (1996 2000), the third cycle (in 2001-2005) and fourth cycle (in 2006-2010). In particular,
9
investigate, assess forest changes are an important part of the program. Forest always
change over time under the influence of nature and man. If the positive impact of forest
will grow, whereas if you experience negative impacts will be degraded forests. So the
main forest resource volatility is a characteristic so fundamental review of its status. In
Forest Resources Assessment forest when people often use the two groups of indicators
are: fluctuations in quantity and quality fluctuations, including:
- Fluctuations in the number assigned to the following principal types of changes is
as follows:
+ Variation in the total forest area.
+ Variation in forest conditions.
+ Variation in metabolism between forest and other land.
+ Movements forest functions: production, protection and special use.
+ Movements forest management forms.
- Fluctuations in quality: variation in species composition, structural changes in the
forest ... the decline in forest quality is referred to as the degradation of forests. As a
change from closed forest to open forest, from forest to forest rich poor, from wood to
bamboo forest, from forest to barren land.
In subjects authors studied changes forest assessment methods volatility has a
combination of remote sensing and GIS. To assess changes in this manner, we need to
establish status maps at various times (1995, 2005, 2015) and then use the software to
overlay two layers Arcgis this situation we will have a map fluctuations between two
specific times. Among them in two maps of the time it is established based on the results of
integration between automatic image interpretation, visual image interpretation and
fieldwork.
10
II, GOALS AND (SPECIFIC) OBJECTIVES:
2.1. Objective Research:
Overall objective: To contribute to the scientific basis for the application of remote
sensing and GIS technology to propose solutions to improve the management of forests in
Yen Lap Commune, Cao Phong district, Hoa Binh province.
Detail goal:
- Assess the situation of forests in Yen Lap
- Proposed solutions to effectively contribute to improving forest management in
the buffer zone of Yen Lap
2.2. Research content.
2.2.1. Research forest management situation in Yen Lap, Cao Phong district, Hoa Binh
province:
- Forest area and distribution space research area.
- The form of local forest management research areas.
2.2.2. Research mapping forest status and fluctuations in Yen Lap, Cao Phong district,
Hoa Binh province:
- Develop key image classification
- Mapping of forest status over the years studied (year ...).
- Mapping of forest area changes over the study period.
2.2.3. Research fluctuations cause regional forest research:
- Evaluation of the factors affecting forest policies to forest management activities
the study area.
- Evaluate the population, society: The development of population and population
density.
11
- Assess the impact of infrastructure quality: The quality of roads, about the roads to
forest areas to distribution.
- Evaluate the impact of scientific and technological factors, effective techniques to
forest management research areas.
2.2.4 . The study recommended effective measures to improve forest management in Yen Lap:
- Solutions forestry policy towards restructuring of the forestry sector.
- Economical Solutions Group - social.
- Group technical solutions, science and technology.
12
III, STUDY AREA AND DATA:
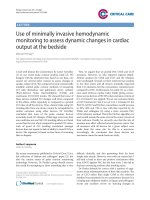
3.1. Study Area:
Yen Lac is a mountainous area commune of Cao Phong district. The commune is a
mixture of diverse land covers/land uses. Statistical report in web portal of Yen Lac
showed that Yen Lac have total 2.247 ha and The Commune has 508 households and 2147
inhabitants. Distributed in 7 villages are: Chầm, Quà, Đảy, Ngái, Thôi, Thang, Bạ which
accounted for 98.68% of Muong ethnic. Kinh accounted for 1.32%. Commune influenced
climate and weather are two distinct seasons, harsh but high humidity, good conditions for
crops and vegetation growth.
- The average rainfall is 2000 mm.
- The rainy season from May 4-10, 1800 mm rainfall.
- The dry season from November to April last year following the year of about 300
mm of rainfall.
- Hoarfrost usually occurs in December last year to January next year.
- Hot wind (wind pipe) usually occurs in June and July in the year.
13
Figure 3.1: Location of the Yen Lac commune in Cao Phong District
3.2. Data Source:
Source remote sensing data available for this study is not much. Only a few photos
on the Map Info system and some Landsat. The scene is stored in GeoTIFF format and
featured in a map projection UTM (UTM-48N, WGS-84 mark) and a map of where the
research department
14
IV. METHOD:
4.1. Image classification method.
4.1.1 Image data research use.
Topics using Landsat images of 1995, 2005, 2015 to track changes of forest area (Table 4.1).
Table 4.1. Landsat data collected in the topic
Years
Image code
Date
Pixel
Path/Row
1995
LT51270461995175BKT00
24/06/1995
30 x 30m
127/046
2005
LT51270462005314BJC00
10/11/2005
30 x 30m
127/046
2015
LC81270462015262LGN00
19/09/2015
30 x 30m
127/046
4.1.2 Methods of visual image interpretation.
For classification methods can be more effective testing, the subjects used more
methods visual image interpretation. This method is based on the experience of the analyst
and the document is available for image interpretation. The method uses a number of
support tools such as Google Earth, ... However, due to use of the subject is not high
resolution (30 meters), so this is the only method of support to help sorting method has
tested more effectively.
4.1.3 Classification method using NDVI images.
A large number of studies have mapped forest changes around the world from the
perspective of forest resource use and land cover change. However, information about the
area with actual forest resources are limited. There have been a number of studies to
develop a simple algorithm for rapid mapping of forests through the physical
characteristics of forest resources. Using vegetation index (NDVI) from satellite images to
study areas at different stages to analyze. The study area forest resource fluctuations can be
detected using one or two remote sensing channel. Thus, NDVI algorithms highlight the
vegetation cover in the study area and can help in mapping forest status and volatility.
15
NDVI vegetation index image is a special form of image ratio first suggested by
Rouse et al, 1973, to emphasize the negative carry on the photo. NDVI is a measure of the
difference in reflectivity between the oscillation wavelength. For Landsat, NDVI
vegetation index is usually calculated as follows:
NDVI = (NIR-Red / NIR + Red)
Where: NIR near infrared channel.
Red is red channel.
NDVI value between -1 and 1, with values from 0 to 0.5 is the region with sparse
vegetation 0.5 - 1 for the show dense vegetation and the value <0 indicates no vegetation squeeze.
NDVI vegetation canopy and dense clouds will tend to have positive values (0.3 to 0.8).
- Countries (such as oceans, seas, lakes and rivers) have a relatively low reflectance
in both spectral channels (at least as far from the coast) and thus lead to a very low value or
low NDVI.
- Land usually represents a spectral reflectance infrared has largely than red, and
therefore tends to generate positive NDVI value is quite small (0.1 -0.2).
- Very low value of NDVI (0.1 and below) correspond to barren areas of rock, sand,
or snow.
- Value moderate represent shrub and grassland (0.2-0.3),
- High values represent the temperate rainforests and tropical (0.6-0.8)
4.1.4. Real investigative methods.
To build key research object classification in 2015, based on the subject material and
advanced remote sensing to collect waypoints forest and non-forest with the help of GPS.
Through the course of the investigation, the subject was up 160 points to the object of
study, including 80 points and 80 points forests are other objects. The total number of
study sites distributed evenly across the entire study area.
16
GPS positioning points on the field, after synthesis and firing up the map with
ArcGIS 10.1. Through the interpretation methods, subjects identified forest developments
in the period.
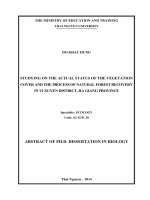
4.2. Method of mapping the forest area.
After determining the accuracy of the maps of each year, subject evaluation method
used after the classification changes to study fluctuations in forest area over the period.
Specifically, from the forest status maps 1995, 2005, 2015 overlay conducted to obtain the
map volatile periods forests periods 1995-2015 and 2005-2015.
Topics were calculated using ArcGIS software forests of years, build maps of the
corresponding Forest over the years. Once there is a map which shows the forest area,
conducting export data to process and complete data on excel.
Satellite Photos Of Years
1995, 2005, 2015
CLipping
Map of forest status in 1995,
2005, 2015
Image Area Research
Overlay
Map forest changes, phase
1995 – 2005 and
2005 - 2015
Data consolidation
Result
Data analysis
Figure 4.1. The steps to build maps of forest cover and change
17
V. RESULTS DISCUSSION
5.1 Current status of forest management in Yen Lap Commune, Cao Phong district,
Hoa Binh province :
The main source of income comes from farming, livestock and agro-forestry
operators such as bamboo shoots, cardamom, medicinal.
Farming practices: Settlement and agricultural production is key, however, local
production still practices shifting cultivation, slash and go to bed at night hunting. This is
also the risk of forest fires caused the burning pot when her children back new fields,
cooking, medication, fire when hunting, ... Also the grazing buffalo, cows and cattle of the
people on popular localities still lead to the protection of forests, especially plantations
under 3 years old were difficult.
In recent years a number of communes bordering neighboring Tien Thuong Kim Boi
district, Xuan Phong, Phong Dung Cao Phong District exploitation, deforestation, illegal
forest burning is not complicated as before but not so that the work is not considered
significant BVR.
- Overview of illegal deforestation for cultivation:
Once done the allocation of forest land under Decree 02, QD 672.- Then Forestry
forests and are home to the situation of illegal deforestation for cultivation has basically
ended.
However the state purchases of forest land and change of purpose arbitrarily to citrus
in the province very complex place. Besides the hunting, catching bees, reclamation, coal
combustion. In which form the focal forest fire potential in causing fire hazards.
- The implementation of agro-forestry combination, farming, afforestation.
Although there is a communal forest areas and forest land belonging to large type in
the communes of the district. Average size / average household is 3.18 ha / household, but
18
by the work of land allocation has been inadequate plus low intellectual level, so the
agroforestry model towards less farm , the application of scientific advances, the model on
sloping land cultivated in a sustainable way to bring high economic efficiency is not there.
Status of land use planning is not reasonable in most villages, the agricultural cultivation is
next to a natural forest blocks.
The area of forest plantations mostly domesticated species, mostly plants: Acacia,
Dendrocalamus membranaceus Munro, Bodhi, Chukrasia tabularis, …
5.2. Results forest changes through the years of research :
5.2.1 Results of sample collected:
Non ID
X
Y
NDVI
1 20.66158
105.37781
0.843
1
0
2 20.65992
105.38117
0.790
1
0
3 20.65027
105.39512
0.813
1
0
4 20.64705
105.39204
0.594
1
0
5 20.63826
105.39329
0.792
1
0
6 20.65210
105.38506
0.839
1
0
7 20.64313
105.39028
0.506
1
0
8 20.64174
105.39125
0.808
1
0
9 20.63954
105.36216
0.843
1
0
10 20.63750
105.36780
0.720
1
0
11 20.62979
105.37545
0.541
1
0
12 20.64321
105.35226
0.819
1
0
13 20.64049
105.34405
0.828
1
0
14 20.63525
105.34065
0.585
1
0
19
Forest
Foest