Khóa học elder traderviet english version
Bạn đang xem bản rút gọn của tài liệu. Xem và tải ngay bản đầy đủ của tài liệu tại đây (8.1 MB, 100 trang )
LÀM SAO ĐỂ TRỞ THÀNH
TRADER GIỎI HƠN
Copyright 2020 Dr Alexander Elder
TRADERVIET.COM
1
TRADERVIET.COM
2
Class outline
Time-tested
1.
2.
3.
4.
5.
6.
Psychology (individual and mass)
Basic charting
Computerized analysis (favorite indicators)
Trading systems
Basic risk management
Good record-keeping
New trading tools – for risk control and self-control
• How to place stops
• How to manage money in your account
Current markets review
All illustrated with current market examples
Q&A throughout
After the class: visit SpikeTrade.com
3
4
Individual psychology
• Open
• High
• Low
• Close
• Volume
Trading: intellectually simple …
Emotionally the hardest game in the world
5
Individual psychology of a trader
Why do intelligent people keep losing money?
Trading as entertainment
6
Individual psychology of a trader
Why do intelligent people keep losing money?
Trading as entertainment
7
Individual psychology - mindfulness
8
Mass psychology
• The tendency to huddle under stress
• Loss of independence in a group
• Market different from other social areas
TRADERVIET.COM
9
Mass psychology of the markets
– The tendency to huddle under stress
– Loss of independence in a group
– Market different from other social areas
Remedies:
Make decisions alone!
Do not ‘talk your book’
10
Trade Journal for DISCIPLINE
TRADERVIET.COM
11
TRADERVIET.COM
12
13
What is Price?
Charts are the footprints of bulls & bears
TRADERVIET.COM
14
Technical analysis is applied social psychology
Each price = a momentary consensus of value
among the crowd of market participants
The courage of the bid and the ask
The argument with the crowd
15
Classical charting is quite subjective
TRADERVIET.COM
16
Helpful patterns in classical charting
In classical charting I trust only:
Horizontal lines (support & resistance)
False breakouts, esp. Kangaroo Tails
17
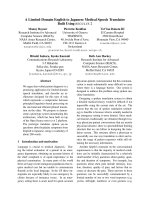
Classical charting – support/resistance, false breakouts, kangaroo tails
TRADERVIET.COM
18
Classical charting – support/resistance, false breakouts, kangaroo tails
TRADERVIET.COM
19
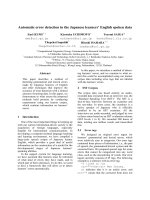
Crude Oil daily
TRADERVIET.COM
20
Classical charting vs. computerized analysis
In classical charting I trust only:
Horizontal lines (support & resistance)
False breakouts, esp. Kangaroo Tails
In computerized analysis
Carefully selected indicators (see below)
Combinations of indicators
21
22
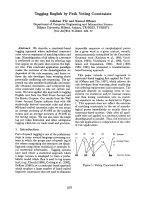
Less clutter – more clarity
TRADERVIET.COM
23
Five Bullets to a Clip
Moving Averages (exp.)
Envelopes (Channels)
MACD (Lines & Histogram)
Force Index
…………
24
A moving average is a composite photo
Exponential (EMA) is more objective
TRADERVIET.COM
25