Strategy report august 2008
Bạn đang xem bản rút gọn của tài liệu. Xem và tải ngay bản đầy đủ của tài liệu tại đây (2.18 MB, 51 trang )
Strategy Report
MayAug
20th,
2008
Tue,
5th
2008
Market turns.............can it last?
•
The market has double bottomed and with sentiment visibly improving
hopes are for a continuation of the current trading rally for a while.
COMPANY REPORT
•
A combination of short and medium term factors have helped to rekindle
investor interest; a stabilisation of the US$/VND unofficial exchange, and
improvement in both the trade deficit and CPI trends recently.
•
The market fell by 60% from its peak and some key stocks fell by up to 85%.
From a trading standpoint the market was oversold and due for a bounce.
•
However we still see some forward risks, macro growth will slow slightly in
the 2-H and FY2008 corporate earnings are likely to undershoot.
•
Valuations are reasonable but not absolutely cheap. The market is trading at
an adjusted forward P/E (top 25 stocks) of 16.5x based on our estimate of
a 28% decline in EPS this year. We exclude VIC from the list.
•
We may have bottomed but in our base case scenario we see potential
2-H downside risk of up to 25% from here. We also see upside of 15%.
•
Therefore we recommend investors to buy selectively over the next few months
especially if the market shows any weakness.
Fiachra Aodh MacCana
Managing Director Head of Research
•
We see a recovery in corporate profits and a return to trendline economic
growth in FY2009. Our medium term outlook is very bullish.
HCMC Securities Corporation
Level 1, 2 & 3 Capital Place Building,
6 Thai Van Lung St., District 1, HCMC
T: (+84 8) 823 3299
F: (+84 8) 823 3301
Hanoi office
6 Le Thanh Tong St.,
Hoan Kiem Dist, Ha Noi
T: (+84 4) 933 4693
F: (+84 4) 933 4822
E:
www.hsc.com.vn
1
Please refer to the disclosures of potential conflict of interest and the disclaimer at the end of this report
Trắc nghiệm kiến thức chứng khoán Mỹ tại : www.sachchungkhoan.net
Strategy Report
MayAug
20th,
2008
Tue,
5th
2008
Table of contents
Section
Page
COMPANY REPORT
The market turns - but for how long?
4
Macroeconomic snapshot - mixed fortunes in the 1-H
6
Dim sums - why balance of payments crisis was always very unlikely
8
The terrible twins - macro crisis is over but the micro fallout hasn’t hit us yet
10
Reasons to be cheerful - what’s driving the change in sentiment
11
(1) Currency stabilises
(2) Domestic gold market loses some of its allure
(3) Trade deficit peaks out
(4) CPI slows down
(5) Global conference call calms nerves
The macroeconomic response - Killing the inflation dragon without burning down the
whole village
23
(1) Turning off the credit fountain
(2) Clipping the wings of the SOE’s
(3) Cutting back on government expenditure
The flood waters ebb - Currency and money market forward view
29
Overview
Money markets and interest rates
Forex market
Bond markets
34
Equity view - Two things that still worry investors
(A) FY2008 corporate earnings still a concern
(B) Banking sector - the weak link
2
And two things that should comfort investors
43
2-H Market scenarios
46
Please refer to the disclosures of potential conflict of interest and the disclaimer at the end of this report
Trắc nghiệm kiến thức chứng khoán Mỹ tại : www.sachchungkhoan.net
Strategy Report
MayAug
20th,
2008
Tue,
5th
2008
Executive summary
Has the market bottomed? Yes we believe it has for the
time being. But that doesn’t mean we have seen the
long term bottom in this bear market yet. The stock market has bounced off the 370 level on the VN index twice
in mid June and has since rallied over 30%. Domestic
buyers have returned to the market and market turnover
REPORT in the past six weeks. The
has COMPANY
improved dramatically
technical selling in key blue chips stocks has come to
an end and foreigners have are more active in the market.
We also suspect that some money has shifted out of
gold and back into the stock market. These flows are
small and could easily be reversed.
The key to the market’s bounce is a return of some
stability to the currency and money markets. May/June
was a volatile time and the gap between the official and
unofficial VND/US$ exchange rates widened as much
as 18% in June. That gap has almost closed again.
This new mood of relative optimism has been fueled by
a dramatic fall in the trade balance and a peaking in the
monthly CPI numbers. The credit crunch has halted the
runaway economy and in the 2-H evidence of a slowdown is accumulating. Even the recent 31% hike in petrol prices won’t halt this trend for very long.
The macro problems that bedeviled the 1-H have started to subside and now all attention is focused on how
hard the landing will be. In our base case scenario we
forecasts a fairly soft landing with GDP growth of 6%
this year. Imports have already fallen sharply and credit
is hard to come by. Other indicators such as industrial
production and retail sales are likely to experience a
slowdown as the effects spread.
Now that the asset bubble has burst we await the microeconomic fallout as prices in the real estate and stock
markets have already fallen heavily. Given that much
of the country’s credit is anchored by collateral such as
property or in some cases stocks we expect to see a
rise in doubtful loans from now on.
Most sectors will be affected including banks, real estate companies and construction firms. However oil related, pharmaceutical and consumer goods companies
should do relatively better as they escape the worst
In addition provisioning against writedowns in equity
positions will place an additional burden on year-end
earnings. If current prices remain the same a 30% writedown of the value of a typical equity portfolio would
seem fair to us. Most companies have chosen to delay
this exercise until the audited results at the end of the
year.
We forecast that FY2008 corporate earnings will fall
-2% leading to a 28% drop at the EPS level. This is due
to the heavy dilution leftover from last year (using IAS
standard calculations for outstanding shares).
While the market has staged a good recovery from an
oversold position we think that in Q4 we may have to
test the bottom again as the investors price in slowing
earnings. In our opinion this will be the final downturn
in the current bear market and this would be the last
chance for medium to long term investors to buy in
close to the market’s lows. Hence we would be buyers
into any weakness.
As Vietnam is a relatively young market out stock picks
are focused on a best of breed strategy. There is a lot
of pent-up growth potential across most sectors which
will be released again as the economy starts to recover
next year. Companies with good management and solid
balance sheets will be best placed to benefit regardless
of the sector they are in.
The long term story is intact and indeed the current
weakness offers the opportunity to buy into it at very
reasonable valuations in the coming months. So while
the short term horizon does offer a few clouds, beyond
the clouds the sun awaits.
In addition the economic slowdown is leading to a
downtick in demand and putting pressure on core earnings. Margins are falling as input costs have been rising
faster than output prices. 1-H earnings did not see the
effect of this but in the 2-H core earnings are likely to
slow significantly.
3
Please refer to the disclosures of potential conflict of interest and the disclaimer at the end of this report
Trắc nghiệm kiến thức chứng khoán Mỹ tại : www.sachchungkhoan.net
Strategy Report
MayAug
20th,
2008
Tue,
5th
2008
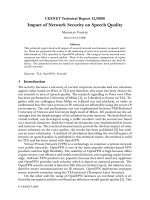
Chart 1- Bid/Ask
Chart 2- Bid/Ask spread
1900%
1400%
900%
400%
-100%
-600%
Bid offer spread
-1100%
COMPANY REPORT
29/7/2008
28/7/2008
25/7/2008
24/7/2008
23/7/2008
22/7/2008
21/7/2008
18/7/2008
17/7/2008
16/7/2008
15/7/2008
14/7/2008
11/7/2008
9/7/2008
10/7/2008
8/7/2008
7/7/2008
4/7/2008
3/7/2008
2/7/2008
1/7/2008
30/06/08
26/6/08
27/06/08
-1600%
Source - HSC
Source - HSC
The VN market has clearly turned around, for the
time being at least. What started as a rally amongst
small cap and OTC bank stocks in mid June, spread
to large caps before hitting a high of 489 on the VN
index by July 17th. Since then the index has corrected somewhat and now rests around the 450 level.
Blue chips, including DPM, SSI and STB led the charge.
Overall market breadth and trading volume has improved
dramatically from April/May when most of the volume
was being executed in the put-through sessions.
With hindsight we can conclude that one reason for this
sudden turnaround was that we had fallen a long way
already. The VN index had dropped 50% so far this year
and was 60% off its peak in March FY2007.
Putting it simply the market has changed direction because local buyers have returned. We can see this in
the improvement of daily turnover since June. The other
reasons we discuss in a later section. In our base case
scenario however the market may need to test the bottom one more time to confirm it before we can leave the
bear market behind us. This testing may occur in late
Q3 or Q4 as we approach the year-end results season.
(2)
The market turns - but for how long?
(3)
Gold and equity turnover has an inverse
relationship – When gold market turnover
soared at the beginning of the year it was at the
expense of equity market turnover. Now that
margin trading in equities is next to impossible,
the generous margin trading facilities offered
for gold traders have looked very tempting.
As a result some wealthy retail investors have
taken to switching back and forth between gold
and equities depending on which asset class
looks momentarily attractive.
(4)
Currency movement is the key to both the
gold and equity market movement – When
the spread between the official reference rate
for the US$/VND and the unofficial currency rate galloped apart back in May the stock
market reacted badly. After the famous global
conference call in June which calmed nerves,
the gap started to close and the stock market
turned around.
(5)
Foreigners are contrary indicators usually
buying on the down days usually – These
days when foreigners are net buyers usually the
market is falling and when they sell the market
is going up. Foreign investors have learned that
in a momentum driven and fairly illiquid market
it’s a lot easier to buy when there are a lot of offers about rather than chase prices higher.
The recent market rally has been characterised by several features worth noting
(1)
4
OTC bank stocks are leading indicators of
the VN index – some OTC bank stocks are
very liquid and trade without daily trading restrictions. And given bank earnings sensitivity
to both the currency market and the overnight
lending rates these stock prices follow both
very closely. Generally speaking when the gap
between the official and unofficial VND rates
narrows or overnight rates fall this is positive
for both OTC bank stocks and the market in
general.
Small caps and widening breadth are other
important leading indicators – usually a market bottom or top is signaled several days in
advance by changes in the market’s breadth.
Therefore it’s worth paying close attention to
the number of stocks falling and /or rising every
day. Small cap stocks usually bottom out first,
as much as two or three days before the market
as a whole. And the same trend can be seen at
the top of the market.
Please refer to the disclosures of potential conflict of interest and the disclaimer at the end of this report
Trắc nghiệm kiến thức chứng khoán Mỹ tại : www.sachchungkhoan.net
Strategy Report
MayAug
20th,
2008
Tue,
5th
2008
Chart 3 - VN-Index
Chart 4 - HASTC-Index
COMPANY REPORT
(6)
Source - HSC
Source - HSC
Market tops are usually characterised by big
volume days – With the momentum driven nature of the market a big volume day where bids
and offers are closely matched usually signals
a market top or bottom. We look closely at the
bid and offer spread every day and can track
sentiment changes based on the relationship
between them. A large increase in either the
bid or offer side against the trend of the market
usually signals a trading top or bottom.
Our forecasts assume a decline in margins due to falling
demand and rising output costs for most companies (except the PV group which operates in its own universe).
We also assume some provisioning for financial losses
although we take a generous view on OTC positions as
many companies may keep these on the balance sheet
at book cost. And of course we assume that banks will
have to add to their rather modest provisioning against
bad loans.
Valuations reasonable but not that cheap
Our team has come up with some rough forward earnings numbers for the top 20-25 stocks in both HCMC
and Hanoi. We see net profits in FY2008 net profit falling by 2% this year and EPS falling a further 28%. This
is far more bearish than company’s own forecasts for
FY2008 which call for a 27% increase in net profit but
EPS falling 12%.
Investors may be surprised by the dilution effect. We
use IAS standards to calculate average weighted outstanding shares in order to make EPS calculations. So
the full effect of the massive increase in share capital
last year will partly fall into this year’s EPS calculations.
We have the full capital history of the top 50 stocks
available on request.
Based on this even a modest dip in earnings leads to a
big drop on an EPS basis. The second problem is skewing. VIC has a huge P/E and this completely skews the
numbers. With VIC included in the top 25 forward P/E
(using HSC forecasts) comes out at 20.5 times which is
not cheap by any standard.
However if we strip out VIC then the adjusted forward
P/E falls to 16.5 times which is far more reasonable.
Normally we would take the aggregate P/E as it comes
but because the difference is so big its important to
point it out. We will use this adjusted number.
5
The result is a modest drop at the net profit level which
we feel is balanced. That is our base case scenario and
we also have a bull and bear case. The bull case assumes companies will meet their target forecasts while
the bear case takes a very unforgiving view on provisioning and assumes a hard landing for the economy.
In terms of probability we weight our base case at 50%,
the bull case at 30% and the bear case at 20%. Overall
we take the view that while the market is likely to test the
June bottom again and might even venture below it the
worst of the bear market is behind us.
However the microeconomic fallout from the credit
crunch will be reflected in year-end earnings and its debatable whether or not this is priced in yet. Our rule of
thumb is as follows. If the likely fallout is quantifiable
and fairly well-known then its quite easy to price it in.
Frankly the scale of the fallout is still only partly known
and we are groping in the dark on some key issues such
as provisioning. And as a rule markets can’t price in what
they don’t know. So we may have to test lower again in
order to firm up the foundation of the next rally.
The medium term case for corporate earnings is intact
and we see a strong double digit recovery in FY2009.
And with little dilution to worry about in most sectors,
much of this will go straight down to the bottom line.
With an adjusted P/E of about 16.5 (excluding VIC), and
good FY2009 earnings growth on top of that this would
set the stage for a good market recovery next year.
Please refer to the disclosures of potential conflict of interest and the disclaimer at the end of this report
Trắc nghiệm kiến thức chứng khoán Mỹ tại : www.sachchungkhoan.net
Strategy Report
MayAug
20th,
2008
Tue,
5th
2008
Chart 5 - Economic snapshot and HSC house view: 1-H and full year FY2008 forecasts by HSC
FY2007
FY2008e
1-H FY2008
2-H FY2008e Comment
GDP
8.5%
6.0%
6.5%
5.5%
slowing down slightly but may slow further in 2-H to 5.5%
Industrial Production
17%
16.25%
16.5%
16.0%
shows no sign of slowing yet but we expect some 2-H weakness
Retail sales
22%
27.5%
30.0%
25.0%
also very strong partly on inflation but likewise we see a slowdown coming
Import
US$60.8 bn US$79.7 bn US$44.5 bn
Exports
US$48.4 bn US$58.7 bn US$29.7 bn
REPORT
US$12.4 bn
US$29 bn
As the global economy slows export demand may slow somewhat in 2-H
US$21 bn
US$14.8 bn
US$6.2 bn
Trade deficit in 2-H will be down sharply. This target is very aggressive however.
US$21.3 bn
US$50 bn
US$31.6 bn
US$19.4 bn Registration at record high but large real estate projects may not be realised
US$5 bn
US$8 bn
US$5 bn
US$3 bn
8.3%
28%
18.4%
10%
COMPANY
Trade
deficit
FDI registration
FDI disbursement
CPI
US$35.2 bn Imports are falling sharply as letters of credit are hard to come by
Disbursement also at record highs and should continue for 2-H
CPI trend is moderating as food prices fall and y/y effect kicks in from October
Source - GSO, all forecasts by HSC
Forecasts are based on our most likely scenario.
Macroeconomic snapshot - mixed fortunes in the 1-H
The 1-H saw a slight drop in GDP growth due to a falling trade deficit and softness in the construction sector.
However most other indicators such as CPI, retail sales
and industrial production showed still showed signs
of robust growth. CPI growth for the first half was up
18.44% year to date.
In the H-1, Exports rose to $30.63 billion, up 35.87% y/y
while imports came to $44.84 billion, up 64.9% on year
Farm, forestry and sea-food export revenues topped
US$7.6 billion in the first half of this year, up 24.8% y/y on
soaring prices. Meanwhile textile and garment exports
were worth US$4.08 billion in the 1-H, up 17.7% on-year.
The authorities have taken notice. And the monetary
and fiscal measures taken so far have just started to
work their way through to the underlying economy and
we expect more evidence of a slowdown to emerge in
Q3. We especially look for more signs of a slowdown in
CPI, retail sales and industrial production to prove that
the government’s policies are having an effect.
Imports growth was even stronger, led by soaring demand for machinery, steel, cars and petroleum products. 1-H machinery imports rose 56% y/y, petroleum
rose 72% y/y and steel imports shot up 121% y/y. From
May however imports started to fall sharply led by a
sharp drop in steel and car imports.
Vietnam’s economy grew 6.5% to VND625.738 trillion
($39 billion) in the first half of this year, which compares
with growth of 7.91% in the 1-H of FY2007. Much of the
slowdown can be seen in the industry and construction
sector which has been starved of credit recently.
In 1-H, FY2008, the industry and construction sectors
were still the main engines of the economy, up 7% on the
year. But this growth rate is far slower than the 9.88%
rate recorded in the first half of last year. The service
sector grew by 7.6% on the year, the fastest growth rate
amongst any sector. And the agricultural, forestry and
fisheries sectors grew a more modest 3.04% on the year.
Investments are not slowing down however. Vietnam invested a total of VND265.4 trillion ($16.58 billion) in the
1-H, FY2008, up 21.1% on the year. The state sector
made VND106.1 trillion worth of investment, up 15.2%
on year, VND80 trillion worth was financed by the private sector, up 15.1% on year. And direct foreign investment came to VND79.3 trillion up strongly also.
6
Still in the 1-H we ran up a huge trade deficit. Vetnam’s
trade deficit almost trebled to an adjusted number of
US$14.8 billion. By comparison in 1-H, FY2007 the
trade deficit was $4.6 billion, while the full-year trade
deficit in FY2007 was $12.4 billion.
Some other parts of the economy namely retail sales and
industrial production are still growing very fast. Too fast
in fact. Total retail sales came to VND447.3 trillion, up
30% on year. This is accelerating largely due to higher
prices. While we are seeing some shift away from individual retailers to larger private sector stores and keener price competition the sector is still very inefficient.
And industrial production for the 1-H, was VND326.6
trillion ($19.8 billion), up 16.5% on the year. The June
number was VND56.77 trillion, up 17.1% y/y showing no
slowdown since the beginning of the year.
As for the breakdown, the private sector continued to
lead, posting a growth rate of 22.3%, the foreign-invested sector grew output by 17.4% and the state-invested
sector’s output rose 6.9% on year.
Please refer to the disclosures of potential conflict of interest and the disclaimer at the end of this report
Trắc nghiệm kiến thức chứng khoán Mỹ tại : www.sachchungkhoan.net
Strategy Report
MayAug
20th,
2008
Tue,
5th
2008
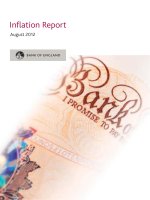
Chart 7 - Going strong still …..Exports - y/y and m/m trends
10.00%
Exports y/y trend RHS
FDI hit record highs for both registered and disbursed,
we saw more in the 1-H than all of last year. These days
the projects are larger and are getting approved more
quickly. We are also seeing more and more real estate
related projects. The Koreans are the largest investors
and two thirds of that money is being poured into real
estate projects worth a total of US$14.5 billion currently.
The largest single project approved recently is a resort complex in Ba Ria-Vung Tau with a registered
capital of $4.2 billion by Canada’s Asian Coast Development Ltd. Co. Arguably the quality and execution
chances of these big real estate projects are lower
than those for say a steel mill or a laptop factory, given
that they are driven by more subjective expectations.
So we have arrived at a turning point with some indicators seeming to slow and others still strong. What about
the 2-H?
2-H forecasts and assumptions
The table on page 5 shows our base scenario assumptions for the 2-H and also FY2008 as a whole. We see
full year GDP growth of 6%, due to a slower 2-H pace of
5.5%. This is based on a general slowdown in demand
and consumption as the credit crunch works its way
through the rest of the economy. This began in earnest
at the end of Q1 and now after four months or so the
effects are starting to be felt.
Since June the signs of a slowdown have accumulated.
The trade deficit tumbled on a sharp drop in imports.
Then food prices fell back as a bumper harvest and lowering international prices partly reversed the 1-H trend.
Apr-08
Jun-08
Feb-08
Oct-07
Source - GSO
Dec-07
Aug-07
Apr-07
Jun-07
0.00%
Feb-07
-40.0%
Oct-06
0%
Jan -04
Mar-04
May-04
Jul-04
Sep-04
Nov -04
Jan -05
Mar-05
May-05
Jul-05
Sep-05
Nov -05
Jan -06
Mar-06
May-06
Jul-06
Sep-06
Nov -06
Jan -07
Mar-07
May-07
Jul-07
Sep-07
Nov -07
Jan -08
Mar-08
May-08
-30%
Exports m/m trend
-30.0%
Dec-06
10%
20.00%
-20.0%
Aug-06
COMPANY REPORT
-20%
30.00%
0.0%
-10.0%
Apr-06
20%
Jun-06
30%
40.00%
10.0%
Feb-06
0%
-10%
20.0%
Oct-05
40%
50.00%
30.0%
Dec-05
10%
60.00%
40.0%
Aug-05
50%
y/y % RHS
50.0%
Apr-05
20%
60%
m/m %
Jun-05
30%
Feb-05
Chart 6 - Still robust ……Retail sales y/y vs m/m
Source - GSO
And the Ministry of Planning and Investment, felt comfortable enough to revise down the full year import target from US$83 billion to US$80.2 and then the trade
deficit forecast from US$30 billion to about US$20 billion. In our opinion this is a little too optimistic.
While the deficit shrank to a yearly low of US$736 million
in June (this is an adjusted number) we got a little help
from seasonal and other special factors that may not
continue. We think the full year number could be more
like US$24 billion. We will discuss this further later.
Both CPI and import growth will moderate in the 2-H
but investors shouldn’t expect a straight-line decline.
We will have good and bad months but the trend has
definitely turned in our favour.
We expect retail sales growth to moderate as food prices dip. However underlying sales are being supported
by powerful demographic forces so the decline will be
slight. And industrial production will also slow somewhat as both exports and domestic demand become
more sluggish.
Clearly the bubble has burst and the overheating
econnomy is cooling down rapidly. The question is will
we see a hard or soft landing?
Our base case assumes a soft landing for most of the
economy but there will be pockets such as real estate,
construction and some parts of the financial system
where the landing may get a little rough. Some companies are over-extended and some banks made loans
they now wish they hadn’t.
July CPI growth was just 1.13% m/m, the slowest month
since the recent spike began late last year. The government did spike petrol prices by 31% in late July but they
waited for signs of falling prices before doing so. Our full
year CPI target is around 30%, but we expect average
2-H monthly CPI growth to average 1.8%, well down on
the 1-H.
7
Please refer to the disclosures of potential conflict of interest and the disclaimer at the end of this report
Trắc nghiệm kiến thức chứng khoán Mỹ tại : www.sachchungkhoan.net
Strategy Report
MayAug
20th,
2008
Tue,
5th
2008
Chart 8a - Current account (in mn USD)
Chart 8b - Capital account (in nm USD)
0
2%
2003
(1000)
2004
2005
2006
2007
1Q08E
(2000)
0%
-2%
(3000)
-4%
(4000)
-6%
(5000)
-8%
(6000)
COMPANY
(7000)
REPORT
-10%
(8000)
-12%
Current Account
20000
18000
16000
14000
12000
10000
8000
6000
4000
2000
0
30%
25%
20%
15%
10%
5%
0%
2003
2004
2005
2006
2007
Capital Account
As % of GDP
1Q08E
As % of GDP
Source - State Bank of Vietnam
Source - State Bank of Vietnam
Dim sums - why a balance of payments crisis was always very unlikely
Some regional economists have been fretting about a
possible balance of payment crisis and the need for a
large currency devaluation to ease the pressure on the
VND. To bolster their case they pointed to the runaway
trade deficit and pressure on the VND back in May/June
as clear evidence of an emerging crisis.
They also wondered whether or not currency reserves
were sufficient to meet all eventualities. We think they
are sufficient and frankly they were looking in the wrong
place.
The Vietnamese economy does have some fragilities
but the balance of payments is not one of them. At least
not for the moment. The trade deficit is slowing down.
There are two reasons for this. Firstly end demand in
the over-heated economy is starting to come down fast.
And with the credit shortage, letters of credit (LC’s) are
hard to come by.
And this has forced importers to cut back on the volume
of inward trade as they can’t get banks to guarantee
payment. And while the trade account deficit has started to normalise the capital account surplus remains
quite robust.
So what of the capital account? In the 1-H, Vietnam’s
12000
16%
14%
10000
12%
8000
10%
6000
8%
6%
4000
4%
2000
2%
0
0%
2004
2005
2006
Balance of Payments
2007
1Q08E
As of % of GDP
Source - State Bank of Vietnam
8
We do have quality concerns with some big projects but
even if half of them were cancelled actual disbursement
would not be affected as the gap between registered
and disbursed flows is simply huge.
We understand that 1-H remittances are also very firm
although the number has not been disclosed yet. And
ODA disbursement in the first six months of FY2008
came to US$1.1 billion, equal to 58% of the FY2008
target. This included US$970 million in ODA loans and
US$130 million in non-refundable aid.
So the capital account looks pretty solid to us. But let’s
test out a few scenarios. What if the flow of FDI slows
down drastically? Could that trigger a problem? Actually
we think not. FDI disbursement is very closely tied to imports. FDI disbursements are largely spent on imported
machinery, cement and steel to fit out new factories. So
if FDI collapses, imports would also drop sharply.
And what of the other three categories on the capital
account; remittances, FPI and ODA?
Chart 8c - Balance of payment (in nm USD)
2003
newly registered and expanded FDI capital totaled
US$31.6 billion against US$21.3 billion for all of FY2007.
And at the same time FDI disbursements came to US$5
billion in the 1-H as against US$8 billion in FY2007. In
other words FDI disbursement has actually speeded up
and the flow of approved FDI investments also shows
no sign of slowing.
Remittances are the most critical segment as they are a
pure inward capital flow. These come from Vietnamese
living or working overseas and amounted to about US$7
billion in FY2007. So far this year we hear that remittances are running higher than last year.
We believe the risk of a sudden slowdown in remittances remains small although the international slowdown
could lead to a slight decline. We can live with that. ODA
is generally know six to 9 months in advance and with
agreements in place we know this number will be good
until the end of this year.
Please refer to the disclosures of potential conflict of interest and the disclaimer at the end of this report
Trắc nghiệm kiến thức chứng khoán Mỹ tại : www.sachchungkhoan.net
Strategy Report
MayAug
20th,
2008
Tue,
5th
2008
Chart 9 - Bound together …..Imports vs FDI disbursement
Chart 10 - Rocketing higher……FDI registration vs y/y change %
26.0
5.0
18,000,000
24.0
4.5
16,000,000
FDI registration
7000%
y/y change %
6000%
8000%
22.0
Imports
4.0
14,000,000
20.0
FDI disbursement (Bil USD)
3.5
12,000,000
5000%
3.0
10,000,000
4000%
16.0
2.5
8,000,000
3000%
14.0
2.0
6,000,000
2000%
12.0
1.5
4,000,000
1000%
10.0
1.0
2,000,000
8.0
0.5
0%
Dollar and other foreign currency reserves at the SBV
were disclosed at US$20.7 billion recently. This covers
the reserves at the SBV and may not be the total amount
of reserves controlled by the authorities. And that’s all
we are going to say about that. This official number covers 10 weeks of imports (taking the past three months
as an average).
In classical economic theory currency reserves should
be equal to the total amount of current dollar obligations
in the economy. That means dollar deposits plus short
term dollar debt. And the declared reserve amount covers both.
So what will happen to the BOP for FY2008?
We lay out our scenario for the balance of payments in
FY2008 and FY2009 at the top of page 7. A health warning to begin with. Getting balance of payment numbers
to balance in a developing economy is notoriously hard.
Leakages from the official to the unofficial economy are
legion and data capture is not the best. So forgive us for
this stab in the dark.
We see a moderating trade deficit will reducing pressure
on the BOP while on the capital side FDI disbursement,
ODA and remittances remain firm for the 2-H. These
components are more fixed than the trade account,
ODA is fixed a year in advance, remittances are driven
more by family relationships than economic cycles (although not exclusively so) while the huge amount of already registered FDI will ensure stronger disbursement
unless we see a very large flood of cancellations.
Apr-08
Jul-07
Nov -07
Oct-06
Source - GSO
Mar-07
Jun -06
Sep-05
Jan -Feb-06
Dec-04
May-05
Apr-04
Aug-04
Jul-03
Nov -03
Oct-02
-1000%
Mar-03
-
Jun -02
QII 2008e
QI 2008
QIV 2007
QII 2007
QIII 2007
QI 2007
QIV 2006
QII 2006
QIII 2006
QI 2006
QIII 2005
QIV 2005
QI 2005
QII 2005
COMPANY REPORT
Jan -Feb-02
18.0
Source - GSO
fidence then in the economy won’t triggered then by
macro indicators such as runaway inflation or a soaring
trade deficit.
As we mentioned above Vietnam does have other fragilities however that bear watching, the high level of SOE
indebtedness and the potential fragility of a financial
system going through its second boom and bust cycle.
These are micro rather than macro factors but then any
potential BOP crisis has its seeds in a general collapse
in confidence. It doesn’t much matter what the source is.
The authorities have always been very wary of any event
that might trigger domestic investors to rush out of VND
assets into gold or US$ assets. We saw a bit of this in
May/June and indeed in the frenetic buying of gold in the
1-H. This type of run could dwarf any change in money
flows in the capital account. And thats why authorities
moved very fast to restrict unauthorised forex trading
and won’t allow more gold imports for the moment.
Hence analysing the minutiae of the NDF market, tracking every steel shipment, FDI project or foreign sale of a
VGB won’t help much in predicting anything. If you are
looking to spot early signs of trouble its domestic capital
flows through informal channels that you must keep an
eye. The authorities figured this one out a lot quicker
than some out of town economists did. And successfully nipped it in the bud.
And so far we haven’t. FPI flows are a little harder to predict and we have seem money flow out of bonds, but at
the same time foreigners are still happy to buy equities.
The ingredients for a macro-driven BOP crisis just don’t
see to be there at the moment and this is reflected in
the way the currency and the very illiquid non deliverable forward market has behaved in the past month and
a half. And the trend is improving. Any crisis of con-
9
Please refer to the disclosures of potential conflict of interest and the disclaimer at the end of this report
Trắc nghiệm kiến thức chứng khoán Mỹ tại : www.sachchungkhoan.net
Strategy Report
MayAug
20th,
2008
Tue,
5th
2008
Chart 12 - No slowdown here….FDI disbursements vs FDI registration
-3000
-3500
Trade balance (RHS)
May-08
Jan -08
Mar-08
Nov -07
Jul-07
Sep-07
May-07
Jan -07
Mar-07
Nov -06
Jul-06
Sep-06
May-06
Jan -06
Mar-06
Nov -05
Jul-05
Sep-05
May-05
Jan -05
-4000
Mar-05
-3%
5.0
-
Source - GSO
QI 2008
CPI
COMPANY
REPORT
QI 2007
-2%
QIII 2007
-1%
10.0
QI 2006
-2500
QIII 2006
-2000
0%
15.0
QI 2005
1%
5.0
4.5
4.0
3.5
3.0
2.5
2.0
1.5
1.0
0.5
QIII 2005
-1500
QI 2004
2%
FDI disbursement (Bil USD) RHS
QIII 2004
-1000
QI 2003
3%
FDI registered (Bil.USD)
20.0
QIII 2003
-500
QI 2002
0
4%
25.0
QIII 2002
5%
30.0
QI 2001
500
QIII 2001
1000
6%
QI 2000
7%
QIII 2000
Chart 11 - Getting better……Trade deficit vs CPI m/m
Source - GSO
The terrible twins - macro crisis is over but the micro fallout hasn’t hit us yet
If you believe our base scenario then it’s fair to say that
the worst of the macro crisis is behind us. The credit
crunch has started to slow down an over-heated economy. CPI growth has moderated, imports have fallen,
GDP growth is down and banks don’t lend much anymore. Money supply growth has slowed from a sprint to
a crawl. After a slow start the government applied the
brakes very hard. And we are seeing some initial results. The stock market breathed a small sigh of relief.
However such a fast landing has micro consequences.
Firms have had little time to adjust to new circumstances. Liquidity is the life blood of business and the supply has been almost cut-off. Recently the SBV talked
of increasing the credit growth limit to 40% to provide
exporters with some badly needed working capital.
And over a sustained period of time lack of liquidity can
cause pain.
For now the economy lies somewhere between the
worst of the macro crisis and the micro fallout which
has yet to hit us.
We think the banking, real estate and construction sectors will feel the worst of it. Total lending in the economy
is around 90% of GDP and as of FY2007 NPL’s under
Vietnamese accounting standards (VAS) amounted to
around 2.2% of the total. But VAS is too generous to
banks and if NPL’s were recalculated under stricter IAS
standards they would at least be double what they are
now.
Under current legislation known as decision 493, Vietnamese banks can elect how they classify bad debts,
under article 6, which is equivalent to VAS standards,
or under article 7 which is much closer to the IAS standards. All banks chose article 6, no surprise there.
However from April, FY2008 they may have to start
switching to article 7. And unless the SBV gives them
10
a reprieve this will be reported by the end of the year.
And with real estate prices falling 30-50% in some
cases the value of the underlying collateral is declining
sharply. Once collateral falls below the value of the actual loan this triggers higher provisioning. The value of
collateral is usually checked once a year.
But what is the real estate exposure of the banking sector? The SBV estimates that the real estate related loans
amounts to about 10.8% of the total. Thats lowballed
in our opinion. A number in the range of 12-14% might
seem fairer based on our survey of selective banks.
And to that we would add NPL’s as they are effectively
real estate related once the collateral comes into play.
So currently we estimate the total exposure may be
around 14-16%. If NPL’s are recalculated under IAS
rules we think the current exposure might increase further to around 16-18%. And if NPL’s start to rise this
exposure may increase further.
As Q4 progresses we will face as number of headwinds
that might cause NPL’s to increase. The recalculation
under article 7 is just one issue. The current severe
downturn in the real estate market is another as this
erodes collateral and can trigger higher levels of provisioning. And the downturn itself is likely to take a turn
for the worst as many loans are due for re-setting in Q3
and Q4 at much higher interest rates. These loans were
taken out in the 2-H of FY2007 when credit growth was
at its strongest, with one year re-sets on interest rates.
Despite some moves to delay these re-sets will hit the
sector soon.
All of the above factors hitting the system at about the
same time will test the banks. The SBV is braced and
ready but we do expect some pain in the sector. And
at the very least credit growth recovery will be delayed
until next year.
Please refer to the disclosures of potential conflict of interest and the disclaimer at the end of this report
Trắc nghiệm kiến thức chứng khoán Mỹ tại : www.sachchungkhoan.net
Strategy Report
MayAug
20th,
2008
Tue,
5th
2008
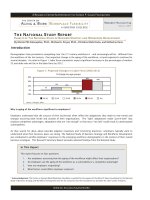
Table 12a - House view on the balance of payments surplus/deficit
House view- Current Account and Capital Inflows,
FY2006-9, (US$ bn)
COMPANY
2006 2007E
2008E
Jan - June
2008F
Jan - Dec
-18.9
-16.1
-2.1
8
-13
12
8
1
3
-17
-1
11
Trade balance*
Trade balance less gold imports**
Services and income
Remittances
Current
account balance
REPORT
Capital inflows
FDI (disbursement)
FPI
ODA and commercial loans
-4.8
-9.4
4.4
-2.5
5.5
-6.4
19.1
6.5
8.6
4
-13.32
-10.52
-1.5
3.5
-11.32
5.5
3.8
0.2
1.5
BOP surplus/deficit(-)
4.3
12.7
-5.82
-0.4
4.7
2009F
6
8
-3
14
8
2
4
Source - all estimates and forecasts by HSC, DC. Historic numbers from IMF, government
* Trade balance is done on a FOB basis therefore minus insurance and other charges (deduct 10%)
**Under IMF BOP guidance gold imports can be seen as capital investment and not a consumable. We include as it a consumable.
Reasons to be cheerful - what’s driving the change in sentiment?
seen as a safe haven for local investors the
breakdown has unnerved some investors. We
have identified a inverse relationship between
trading in the gold market and the stock market
with some investors switching from one to the
other. So we have seen some movement back
into stocks from gold recently.
So what has prompted the relative improvement in market
sentiment. As ever a number of factors have combined;
(1)
(2)
11
The currency has stabilized for now – the
unofficial rate spiked sharply downwards and
hit a low of VND19,450 in early June. The gap
between the official reference rate and the unofficial rate widened alarmingly. The authorities
have taken several steps recently to stabilize
the situation and the dong has strengthened
recently with the unofficial rate now trading at
VND17,000. These steps include widening the
official band from 1% to 2%, curtailing gold
shops, bringing other foreign currencies into
the trading band for the first time and monitoring the interbank forex market. They have also
provided more liquidity by selling US dollars to
banks to provide money for importers and exporters. We know they recently inject US$400
million into the system to do that. However
they have certainly done more than that. The
challenge is to stabilize the exchange rate and
provide enough dollars for business without
rewarding speculators. This is a tough balancing act and the future direction of the US$/VND
rate will reflect that duality.
Gold market loses investor interest - The gold
market dominated the 1-H, sucking money
out of equities and VND as investors ran for
cover. However the gold market had a bad day
at the office so to speak on Friday, June 20th
when the trading system on the Saigon Gold
Exchange failed due to an IT problem. Despite
switching to a back-up system trading was disrupted and some investors suffered. Because
the market is largely traded on margin and was
(3)
Trade deficit peaks out - the trade deficit has
peaked and in June saw a sharp decline m/m
as both seasonal and cyclical factors coincided.
This is the third straight m/m decline from March
which was the peak. The decline is due to both
a sharp decline in imports and, in June a sharp
rise in exports. Slowing demand and difficulty
in getting letters of credit clogged ports and led
to steady drop in imports. While we may see
some volatility in the deficit over the next few
months the trend is definitely lower. And that’s
what the market likes to see.
(4)
CPI upward trend slows down – We saw
a positive surprise in the July CPI numbers
which rose only 1.13% m/m, the lowest rise in
the current cycle. Rice, pork and steel prices
started to fall back last month after spiking in
May. This is the second consecutive month the
trend is lower after the 3.9% m/m increase seen
in May. However after the recent 31% increase
in petrol prices the August number is likely
to spike by an additional 0.6-0.7% on the increase. We expect the 2-H trend to moderate to
an average of 1.6% m/m per month, down from
3.06% m/m in the 1-H. The worst is over but we
will still have good and bad months as some
latent inflationary remains to be released.
Please refer to the disclosures of potential conflict of interest and the disclaimer at the end of this report
Trắc nghiệm kiến thức chứng khoán Mỹ tại : www.sachchungkhoan.net
Strategy Report
MayAug
20th,
2008
Tue,
5th
2008
(5)
Global conference call calms nerves - The
famous conference call in late June by the Finance minister and SBV governor has served
to calm international investor’s. The authorities
were candid and released a host of statistics including the important currency reserve number
(US$20.7 billion) and the markets welcomed
the newfound transparency.
COMPANY REPORT
Other factors have also contributed to the better mood.
There has been some movement on lifting foreign ownership limits. MOF has prepared a draft regulation on
foreign investors’ capital contribution and stake purchases which proposes no limitation for foreign ownership in non sensitive sectors. On June 9th, MOF opened
the draft regulation on foreign investors’ capital contribution and stake purchases for public opinion. And the
SSC held a meeting on Monday, 16th June and made
some encouraging noises.
12
The rally that followed came to an abrupt halt as the VN
index hovered below 500 and the market braced itself
for the petrol price increase. Despite the recent correction however the market mood is far better than it was
just two months ago.
And we have seen a small shift in capital flows out of
gold markets in the last month. Part of this can be traced
to the recent government moves to curb gold imports.
At the same time stock market volumes has expanded
slightly. But then this shift in capital flows is small and
could quite easily be reversed.
Please refer to the disclosures of potential conflict of interest and the disclaimer at the end of this report
Trắc nghiệm kiến thức chứng khoán Mỹ tại : www.sachchungkhoan.net
Strategy Report
MayAug
20th,
2008
Tue,
5th
2008
Chart 13 - VND vs USD, official band and unofficial rate
15,500
Chart 14 - Enough to go around……..Vietnam’s dollar Reserves
30
VND/$
100%
25
20
16,500
US$ reserves (billion)
80%
y/y (RHS)
60%
40%
15
COMPANY REPORT
17,500
20%
10
1-H 2008e*
2007
2006
2005
2004
2003
2002
Free Market
2001
18,500
2000
-40%
1998
Closing Price
-20%
0
1999
Target Rate
0%
5
19,500
12/3/2007
1/16/2008
2/28/2008
4/14/2008
5/27/2008
Source - GSO
(1)
Currency stabilises
In the first five months this year, the unofficial VND/
U.S. dollar rate depreciated from VND15,800 to even
VND19,500 before rising again, or a fluctuation of 24%.
Back in June the rate reversed direction following direct
and sustained intervention from the authorities. The intention was to reduce the spread between the official
or pegged rate and the unofficial rate that increased
alarmingly in April/May. This was successfully done.
The spread has now been almost closed so that the
unofficial market rate is now just above the upper end of
the widened trading band.
This stabilisation was achieved in a matter of weeks
and has involved a multi pronged approach; supplying
US$ liquidity to the banking system to satisfy legitimate
needs; increasing the trading band to 2% and enforcing
it more strictly; bringing third currencies into the trading
band to prevent the triangulation that has undermined
the VND/US$ rate in the past; and closely monitoring
forex operations between banks and gold shops which
had been the main bridge for speculation in the past.
The State Bank of Vietnam (SBV), the central bank, has
apparently sold $5 billion foreign currencies to commercial banks so far this year to help stabilize foreign
exchange market. And more recently injected $400 million. The central bank is likely to intervene further in the
foreign exchange market from time to time by selling
more dollars to banks to meet the domestic demand for
foreign currencies and restrain dollar hoarding for speculation. The SBV has eliminated the quotation of prices
in foreign currencies, illegal dollar trading and direct
payment of foreign currency in the domestic market.
Commercial banks are no longer allowed to buy and
sell VND and US$ via a third currency.
13
Source - GSO
7/9/2008
* this number is probably lowballed
The gold shops have been under pressure like never
before. Earlier in the year transaction values in the
gold shops grew exponentially as domestic speculators
sought to increase US$ exposure. They dealt actively
with some banks and for a brief period the spread between the official and unofficial rates expanded rapidly
as a result. The authorities sprang into action and effectively shut down this channel. Furthermore following
some investigations, the SBV in HCM city has recently
withdrawn the licenses of 20 foreign exchange counters for selling foreign exchange to the unofficial market
without proper authorisation. The total number of authorised foreign exchange counters in HCM city was 1,014.
And the others are now behaving.
To make sure they stay well-behaved the SBV has ordered them to re-apply for permits. Under Decision
No.21/2008/QD-NHNN which replaces Decision No.
1216/2003/QD-NHNN dated October 9, 2003, the SBV
has ordered 3,600 forex counters nationwide to re-apply for their licenses.
As a result the unofficial and official rates have converged and the spread has fallen to its lowest level this
year. However although many transactions do take
place liquidity in the system has dropped and the market might be fairly described as partially frozen for the
moment.
Banks that need foreign exchange on behalf of clients
have to apply to the SBV which is acting as a clearing
house almost for foreign currency transactions.
Please refer to the disclosures of potential conflict of interest and the disclaimer at the end of this report
Trắc nghiệm kiến thức chứng khoán Mỹ tại : www.sachchungkhoan.net
Strategy Report
MayAug
20th,
2008
Tue,
5th
2008
Chart 15 - Turnover falls….Gold price vs trading volume
Chart 16 - Vietnam - Gold price vs International Gold price spot price
700,000
20,000
1050
600,000
19,000
1000
18,000
17,000
16,000
13,000
650
13,000
600
12,000
Source - GSO
(2)
Domestic gold market loses some of its allure
Gold has been the asset class of the 1-H. The domestic
gold market dramatically expanded in terms of volume
traded so far this year. Since last November the average daily trading volume has expanded from 12,069
taels a day to 395,287 taels a day in June. Incidentally
one tael is equal to 37.5 grams. Domestic gold prices
have moved from VND12,750 per tael last summer to
a peak of VND19,980 in March. Recently the price has
returned to those highs.
In 1-H, this huge demand for gold led to imports of 90
tons worth about US$2.8 billion. The market quickly
absorbed the lot as investors sought to take cover in
the traditional inflation hedge. And as the equity market
died earlier this year liquidity switched to the gold market
which has always been easy to trade with ample margin capabilities. Turnover in the gold and equity markets
have established a kind of inverse relationship this year
with gold the main beneficiary since January.
7/10/2008
6/25/2008
6/10/2008
5/9/2008
5/26/2008
4/2/2008
4/21/2008
3-Mar-08
18-Mar-08
15-Feb-08
9-Jan -08
24-Jan -08
3-Dec-07
18-Dec-07
1-Nov -07
16-Nov -07
2-Oct-07
17-Oct-07
14,000
17-Sep-07
7/4/2008
6/17/2008
5/29/2008
5/12/2008
4/18/2008
28-Mar-08
11-Mar-08
21-Feb-08
9-Jan -08
28-Jan -08
14-Dec-07
8-Nov -07
27-Nov -07
3-Oct-07
22-Oct-07
14-Sep-07
8-Aug-07
27-Aug-07
3-Jul-07
20-Jul-07
12,000
14-Jun -07
0
700
30-Aug-07
COMPANY REPORT
100,000
15,000
750
14,000
31-Jul-07
200,000
16,000
800
15,000
15-Aug-07
300,000
17,000
850
16-Jul-07
400,000
18,000
International Gold price $/OZ
900
29-Jun -07
Price (VND thousand)
500,000
19,000
Price (VND thousand)
950
14-Jun -07
Volume (tael)
20,000
Source - GSO
In July daily turnover fell from the peak of over 395,287
taels per day hit in June to an average of 256,560 taels
per day. That’s a 35% drop in turnover. In this case we
care more about turnover than price however and the
volumes traded tell us capital flows are on the move
again to the benefit of equities.
After all the gold market dwarfs the equity market in
terms of daily turnover and a shift of 35% in flows to
equities makes a lot of difference. However these flows
can easily change direction and they will if the currency
market becomes more volatile.
Now that the currency market has stabilised and that
CPI has apparently peaked, the need to hold gold as
an inflation hedge has diminished for the time being.
Having said that domestic gold prices still broadly follow
international trends despite the import freeze and these
have moved higher recently.
One reason is that margin trading in the gold market can be up to 90% of the principal (banks such as
ACB are very active in this). Of course the repo and
margin positions (repo contracts covers OTC stocks
while margin contracts cover the listed stocks) in
the stock market have been unwinding since last
summer making it hard for speculators to operate.
But then recently turnover in the market has started to
fall again and some money has apparently shifted back
into the equity market.
14
Please refer to the disclosures of potential conflict of interest and the disclaimer at the end of this report
Trắc nghiệm kiến thức chứng khoán Mỹ tại : www.sachchungkhoan.net
Strategy Report
MayAug
20th,
2008
Tue,
5th
2008
Chart 17 - At the turn…Imports, Exports vs Trade deficit
Chart 18 - Down we go….Trade deficit y/y vs m/m
9000
1000
700%
8000
500
600%
7000
0
500%
m/m
6000
-500
400%
y/y (RHS)
5000
-1000
4000
-1500
3000
-2000
Exports
COMPANY REPORT
Imports
1200%
1000%
300%
800%
600%
200%
400%
100%
200%
0%
0%
(3)
Source - GSO
Trade deficit peaks out
In May the trade deficit fell 36.2% m/m. dropped a further 64.1% in June and rose slightly by 8.7% in July.
The decline came about as a combination of falling
demand for steel and cement, the effects of the credit
crunch, clogged ports, very strong exports and seasonal factors all combined to push it lower. July marked
the fourth consecutive month the trade deficit narrowed
and suggests that at least one of Vietnam’s two chronic
macroeconomic problems has hit a cyclical bottom and
started to improve.
The trade deficit has been widening steadily since MayJune of last year when the monthly deficit number first
broke above US$1 billion and reached a peak in March
2008 when the monthly deficit hit US$3.28 billion.
This improvement in the deficit was both import and export led. Seasonal weakness in imports is a partial explanation for the dramatic fall in the deficit. But seasonal
factors don’t explain the recent three month trend which
has seen a falling deficit every month. We believe the
numbers are turning around finally.
Behind the improvement lies a fall in imports at the time
when export growth was very strong. June import numbers are generally weak for seasonal reasons, but even
extracting the seasonal effect there is a definite downward trend in the deficit which is very welcome news
indeed. And this can be confirmed primarily by looking
again at the May numbers which fell against the normal
seasonal trend.
One of the key reasons is the availability of credit. In the
trade game you need letters of credit issued by a recognized bank to guarantee payment. No letter of credit
means no deal and pretty soon no imports. And with
the lack of credit in the market LC’s have become rare
commodities. And the number of recognized banks has
shrunk as some institutions are seen to be dodgy.
15
Jul-08
May-08
Jan -08
Mar-08
Nov -07
Jul-07
Sep-07
May-07
Jan -07
Mar-07
Nov -06
Jul-06
Sep-06
May-06
Jul-08
May-08
Jan -08
Mar-08
Nov -07
Jul-07
Sep-07
May-07
Jan -07
Mar-07
Nov -06
Jul-06
Sep-06
May-06
Jan -06
Mar-06
Nov -05
Jul-05
Sep-05
May-05
Jan -05
Mar-05
Jan -06
-400%
Mar-06
-300%
Nov -05
-3500
Trade balance (RHS)
0
Jul-05
-200%
Sep-05
-200%
May-05
-100%
-3000
Jan -05
-2500
1000
Mar-05
2000
Source - GSO
May if you remember was the month of clogged Southern ports, with about 32,000 containers stuck in port
(and 11,000 of these were there for over a month).
Importers blamed banks for failing to issue letters
of credit. And as we mentioned some banks’ LC’s
were not being recognised for credit quality reasons.
So importers can’t guarantee payment and to begin with
the stuff was piling up in the ports. That pile-up has now
eased and now some importers simply don’t bother importing. How to control a trade deficit in two easy steps.
Let’s walk through it. In May import growth fell 3.7%
m/m, fell a further 10.4% in June and then 1.6% in July
m/m. And on a year/year basis the trend is still moving
higher but the growth rates have slowed down considerably. For example the April number was up 85% y/y, but
in May this slowed down to 47.8% y/y, and was up just
43% y/y in June and 34.6% y/y in July.
Part of the reason can be traced to seasonal factors.
In June 2006, imports fell 6.7% m/m, (in June 2005 the
number was also down, -0.9% m/m). Traditionally imports also decline m/m again in July before rebounding
in August. Interestingly then May 2008 becomes quite
significant as last month’s decline goes dramatically
against the normal seasonal trend.
In May 2006 for example imports rose 19.9% m/m (June
2005 saw a 5.4% m/m increase). So we should look at the
last three month’s of data overall to draw our conclusions.
And that suggests that even allowing for seasonal weakness, imports have clearly peaked and started to fall.
The drop in imports has been driven by just three categories. Steel imports have dropped 58% from their
March peak, fertiliser imports are down 57% and car
imports are down 61%. The drop has been very concentrated in these and machinery and cloth imports are
quite strong. And not all categories are down. Petrol
imports increased sharply in July as prices went up.
Please refer to the disclosures of potential conflict of interest and the disclaimer at the end of this report
Trắc nghiệm kiến thức chứng khoán Mỹ tại : www.sachchungkhoan.net
Strategy Report
MayAug
20th,
2008
Tue,
5th
2008
Chart 20 - Key Vietnamese imports (US$ million, monthly data)
200%
200%
80%
Machinery
150%
Steel
Cloth for textiles
0%
Jul-08
May-08
-50%
Jan-08
-50%
Mar-08
Apr-08
Jun-08
Feb-08
Oct-07
Dec-07
Aug-07
Apr-07
Jun-07
Feb-07
Oct-06
Dec-06
Aug-06
Apr-06
Jun-06
Feb-06
Oct-05
Dec-05
Aug-05
Apr-05
Jun-05
0%
Feb-05
-30.0%
0%
Nov -07
10%
50%
Jul-07
COMPANY Imports
REPORT
y/y trend RHS
-20.0%
50%
Sep-07
20%
Imports m/m trend
100%
Mar-07
30%
-10.0%
100%
May-07
0.0%
40%
Mar-06
50%
Jan-06
10.0%
150%
Petroleum Products
60%
Jan-07
70%
20.0%
Sep-06
30.0%
Nov -06
90%
Jul-06
40.0%
May-06
Chart 19 - Imports - y/y and m/m trends
Source - GSO
Source - GSO
We know that steel imports were stuck in port for some
time and in fact some of these were being re-exported
again before clearing import customs. Whether this was
as a result of hoarding or simply problems with letters
of credit is of course open to question. Let’s just say a
bit of both. And car imports have started to fall now that
import taxes have increased dramatically.
This is the first sign that the sharp credit slowdown and
the cutbacks in government expenditure is have a real
effect on the economy. And the turn when it came seems
rather dramatic. Now given the seasonal factors at play
and fact that the clogging in the Southern ports was at
its worst at the beginning of this month we suspect the
deficit may widen again somewhat from August or so.
Furthermore, gold imports have been halted. These
numbers are not normally broken out officially but we
understand that gold imports totalled US$2.8 billion in
the 1-H. This amounts to almost 19% of the first half
trade deficit number. The government has turned wary
of issuing further import licenses after Vietnam was declared the world’s largest gold importer in Q1.
But the cycle has turned. The surge in domestic demand has been broken and government policies seem
to be working at last.
However we have yet to see if the two largest import
categories, machinery and petrol will show any weakness soon but from the strong FDI and industrial production numbers this may take some time.
Exports growth very strong in June, up 8.1% m/m and
up 53.7% y/y. And then in July exports fell 2.1% m/m
but were still up 46.1% y/y. This is the first m/m decline
seen since February but in fact it’s too early for it to
mean much.
As a result of this the trade deficit fell 36.2% m/m back
in June 2007 and 41.5% in June 2006 so the seasonal
factors we saw in the import numbers are at play here.
Even so, this is not the whole story as both May 2006
and 2007 saw sharp m/m rises in the deficit beforehand.
What about the 2-H? We think that the monthly trade
deficit will range between US$0.8-1.5 billion in the 2-H.
We are now in a quiet season for imports which will last
until October. Traditionally imports in Q4 then speed up
ahead of the holiday season.
There are some important factors to consider. A considerable portion of the steel imports in the last year
have been destined for the mammoth Dung Quat refinery project. This project is now almost completed and
will not require any further steel. And other large projects both public sector and private have been slowed or
even mothballed.
And the lack of gold imports in the 2-H will also help.
Overall however a sustainable reduction in the trade
deficit will require a slowdown in industrial production,
retail sales and investment in the economy.
May 2008 however saw a m/m decline in the trade deficit so as in the import data we are seeing two factors at
play. One is a normal seasonal downturn in June which
was driven by very weak imports, but the other underlying factor is three months of consecutive m/m decline in
the deficit since April 2008. This is clearly a cyclical and
not just a seasonal trend.
16
Please refer to the disclosures of potential conflict of interest and the disclaimer at the end of this report
Trắc nghiệm kiến thức chứng khoán Mỹ tại : www.sachchungkhoan.net
Strategy Report
MayAug
20th,
2008
Tue,
5th
2008
Chart 22 - Rice rules!....CPI vs Food contribution to CPI
Chart 21 - Peaking out? …….Key CPI drivers - Food,
construction and transport
50.0
80.00
40.0
30.0
70.00
Food & Foodstuff
60.00
30.0
Accommodation & construction
materials
50.00
20.0
Transport & Telecoms
40.00
CPI y/y %
COMPANY REPORT
15.0
10.0
20.00
-
5.0
10.00
-
-
Jun -06
Jul-06
Aug-06
Sep-06
Oct-06
Nov -06
Dec-06
Jan -07
Feb-07
Mar-07
Apr-07
May-07
Jun -07
Jul-07
Aug-07
Sep-07
Oct-07
Nov -07
Dec-07
Jan -08
Feb-08
Mar-08
Apr-08
May-08
Jun -08
Jul-08
Jul-08
Jul-07
Jan -08
Jul-06
Jan -07
Jul-05
Jan -06
Jul-04
Jan -05
Jul-03
Jan -04
Jul-02
Jan -03
Jul-01
Jan -02
Jul-00
Jan -01
Jan -00
(10.0)
Source - GSO, HSC
Source - GSO
CPI slows down
July CPI slowed to 1.13% m/m marking a further significant slowdown in the monthly trend. Key CPI basket
items such as rice, pork and construction materials have
fallen in price recently. This is partly seasonal and partly
the result of additional supply amidst a period of falling demand. Food prices decreased by 0.37% m/m and
foodstuff prices increased by just 1.33% m/m Overall
the food and foodstuff category rose by just 0.99% m/m.
The recent 31% increase in petrol prices however has
dealt a body blow to lower inflationary hopes. But this is
a short term factor. In fact this decision was inevitable
as government finance could no longer take the burden. And we would rather get it out of the way. Latent
inflation is like a dam waiting to burst, it creates a false
sense of security.
We will discuss the likely effect on Q3 inflation a little
later on.
May’s 3.9% m/m increase in CPI was an anomaly in our
opinion. So it’s not surprising that June and July’s m/m
increase was far more subdued. For the 2-H we believe
that we will still see 1.6% average m/m increases in CPI.
This puts the year-end CPI number in a range of 2932%. The SBV is more optimistic, calling for 20% or so.
However inflation is far from beaten and with international oil prices still volatile (albeit falling recently) and
domestic interest rates in negative territory we need to
keep a close eye on the monthly CPI trend.
The July m/m increase was the lowest in the current
cycle but the y/y trend is still up and all key segments
are seeing upticks in prices y/y. However looking behind
the numbers we are starting to see a drop in some of
the key soft commodities that make up the CPI basket.
1-H CPI rose 18.44% from the end of 2007 and was up
26.8% y/y. In July the y/y number was 27%, a marginal
17
20.0
30.00
10.0
(4)
25.0
FOOD CONTRIBUTION
increase in trend suggesting the y/y trend may peak out
too in a number of months.
Food is the driver, and the trend reversal in food prices
tells the whole story. After all in June food and foodstuff
accounted for 90% of the 1.6% point increase (25.2% to
26.8%) in the headline number. The food and food stuffs
index which accounts for 42.8% of the total CPI basket
soared 18.01% in the 1-H.
But we are not out of trouble yet. The price trend in nonfood items (one definition of core inflation) is accelerating. Non-food inflation rose from 12% y/y to 13% y/y in
July. This will jump again in August as the petrol price
increase is included
HSC also independently tracks some key soft and hard
commodities that make up the index such as rice, pork,
cement, steel and cooking gas. We show the results
on page 19. We get our numbers from the HCMC authorities. HCMC is the most dynamic and price sensitive region in the country and is an excellent barometer
for what’s happening nationwide. If we look at the price
charts for the five key commodities, we can see that the
price of pork, rice and cement is clearly falling; steel is
off its peak while the price of cooking gas is mixed. Call
it four out of five.
Gas prices have been especially volatile recently.
Cooking gas is an interesting commodity primarily because the price is allowed to move freely. This makes
it a good proxy for how petroleum prices might trade
if they weren’t heavily subsidised by the government.
From July 1st, the domestic gas retail price rose again,
by VND7,000 per 12-kilogram canister to VND274,000VND275,000. This is the fifth price hike this year and
is up 45.7% y/y. Then on July 8th the price was cut
again by between VND3,000 and VND5,000 per 12kilogram canister, bringing the price down to between
VND271,000-VND275,000. Quite confusing.
Please refer to the disclosures of potential conflict of interest and the disclaimer at the end of this report
Trắc nghiệm kiến thức chứng khoán Mỹ tại : www.sachchungkhoan.net
Strategy Report
MayAug
20th,
2008
Tue,
5th
2008
Chart 24 - CPI basket Vietnam
Chart 23 - Up and up…….Food and Foodstuff CPI index
80.0
70.0
Food
60.0
Foodstuff
4%
Food and foodstuffs
3%
43%
5%
Transport and communciation
5%
Equipment and homew are
50.0
5%
40.0
Housing and housing related
Garments and footw are
Pharmacy and medicine
30.0
7%
Education
20.0
COMPANY REPORT
Alcohol and cigarettes
10.0
Culture, sport and recreation
9%
Jul-08
Jun -08
Apr-08
May-08
Mar-08
Jan -08
Feb-08
Dec-07
Nov -07
Oct-07
Sep-07
Aug-07
Jul-07
Jun -07
May-07
0.0
Consumer goods and other
services
9%
10%
Source - GSO
The sudden 31% increase in petrol prices announced.
at the end of July came after much internal debate.
The price of the benchmark A92 petrol price rose from
VND14,500 to VND19,000, a jump of 31%. The timing
might surprise foreign investors who have seen international crude oil prices tumble from a high of US$145.18
per barrel on the 14th of July to just below US$123 on
Friday’s close (a decline of 15%). But then Vietnamese
petrol prices have been flat since January (when oil
price were just over US$90) so they were lagging.
We understand that petrol & diesel prices has a weight
of around 2.5% in the CPI basket. Petrol was increased
by 31% while diesel price rose 14%. And then kerosene
has a further 0.25% basket weight. Its price rose 44%
This is a fairly rough estimate as exactly how GSO
works in higher petrol prices is a mystery they like to
keep to themselves.
Assuming that petrol and gasoline prices have an equal
weight that’s about a 22.5% average increase or a
0.56% (2.6% *1.225) in the CPI. Add in the kerosene
increase (0.25% *1.44) of 0.11 and you get an overall
direct impact of about 0.675% on the monthly increase
in the CPI number for August.
The authorities did increase the price twice in the last
9 months, once in November 22nd from VND11,300 to
VND13,000 (that’s a 15% increase) and then on the 25th
of January from VND13,000 to VND14,5000 (that’s an
11.5% increase). Subsequently the monthly CPI trends
in December FY2007 and February FY2008 were 2.9%
and 3.5% up m/m respectively. Of course there were
other things going on at the same time so if would be
wrong to attribute this monthly increase to petrol alone.
In fact the petrol price increases affects the CPI numbers both indirectly and directly and can take several
months to work their way through the economy and into
18
Source - GSO
the basket. Of course the indirect affect will be greater
although it will take some time. The fuel hike primarily
affects transportation, construction materials, food and
foodstuffs as all are heavy users of fuel to either make
or transport their goods. All told that’s around 62% of the
basket. So there will be a greater secondary impact.
We feel that the estimated total impact on CPI could be
around 1-1.5% but that will be spread out over several
months. Given the recent strong feeling that CPI has
already peaked, this may disappoint some. However it
had to happen sometime and raising prices now gets it
out of the way.
Latent inflationary tension (due to price controls gap
between domestic and international prices have grown
quite large – we see that as latent inflation) has now
been reduced substantially. In other words, bad news in
the short term but actually good news on the medium
to longer term.
One of the key planks of the government’s anti-inflationary policy has been to control the prices of some key
items in the CPI basket. This is a good way to dampen
down prices short term but it also stores up a lot of latent
inflationary pressures that must be released at some
point in the future. The government froze the prices of
10 essential items earlier this year. These are petrol,
electricity, coal, water, bus, rail and air tickets, cement,
iron, steel, and school and hospital fees.
The original idea was to freeze these prices until the
end of June and then allow selective price increases.
We are now seeing some of these price increases.
In practice the price freeze has had mixed success with
steel and cement prices showing a lot of volatility but on
the whole the prices of other controlled items have been
very restrained. MOF’s latest position is to keep prices
Please refer to the disclosures of potential conflict of interest and the disclaimer at the end of this report
Trắc nghiệm kiến thức chứng khoán Mỹ tại : www.sachchungkhoan.net
Strategy Report
MayAug
20th,
2008
Tue,
5th
2008
Chart 26 - Accommodation & Construction Materials CPI index
Chart 25 - Vietnam CPI y/y and m/m
30.0
25.0
CPI y/y %
20.0
m/m %
5.0
30.0
4.0
25.0
3.0
15.0
2.0
10.0
20.0
15.0
1.0
Jan-08
Jan-07
-
Jan-06
(2.0)
Jan-05
(10.0)
Jan-04
5.0
Jan-00
(1.0)
Jan -00
May-00
Sep-00
Jan -01
May-01
Sep-01
Jan -02
May-02
Sep-02
Jan -03
May-03
Sep-03
Jan -04
May-04
Sep-04
Jan -05
May-05
Sep-05
Jan -06
May-06
Sep-06
Jan -07
May-07
Sep-07
Jan -08
May-08
(5.0)
Jan-03
10.0
Jan-02
-
COMPANY REPORT
-
Jan-01
5.0
Source - GSO
Source - GSO
of basic utilities such as electricity, water, and public
bus fares unchanged through the end of 2008.
tough challenge and of course depends on the future
direction and momentum of international prices.
Not only petrol prices have been allowed to rise. The
prices of some medicines especially specialty drugs,
have risen 5-10%, according to the Deputy Minister of
Health on July 1. Drugmakers have had price increase
applications with the ministry for several months already.
2-H CPI will moderate further......
Another short term factor is the higher import taxes on
luxury goods that also applied from July 1st. The prices
of mobile phones, computers, and electronic appliances
have risen as a result. And imported food prices such
as powdered milk have been on the rise also. Recently
milk prices increased by 5-7%.
The next test will be what to do about steel prices. Demand is certainly falling sharply. In June steel volume
sales came to just 250,000 tons, down 19% m/m and
the biggest monthly decline so far. But imports are falling even more sharply. In fact a lot of recent imports
were promptly re-exported again partly due to difficulties in getting letters of credit and partly due to low
domestic prices. We have heard that the industry has
about one months worth of billet in inventory, enough to
last us until the end of August.
Now with ore prices having been increased recently billet prices in the international markets have risen in price
from about US$8,500 per ton to over US$10,000 per
ton recently. This latest price hike is not yet reflected in
the domestic market yet. When billet supplies start to
run low pricing pressure may build again.
We believe the authorities will pull it off. Therefore our
base case scenario is for 2-H inflation growth to average
1.6% per month. This is a halving of the 1-H monthly average. The great worry however is that core inflation is
ticking up in the last few months just as headline inflation
is coming under control. Core inflation is embedded and
often is the first sign of wage push inflation in an economy. Over the next few months it may grow further and
hence we would caution against premature celebrations.
One further more positive point. The year on year effect
will start to kick in from Q4 onwards as the current cycle
began in earnest from October, FY2007. This should
help to moderate the y/y trend at the very end of this year.
We will have good and bad months and the bad months
will not be as bad as we saw up till now. Inflation is now
embedded into the system and will take time to extinguish, but we have seen the worst already.
We hope the authorities can avoid the temptation to declare victory too soon and reduce interest rates. There
is a natural growth bias in the execution of macroeconomic policy in Vietnam. That bias is a healthy thing
however close to inflexion points in the cycle it might
lead to a premature easing in monetary policy before
the dragon has been slain. We hope they will hold off.
The government has built a series of dams so to speak
and is now selectively releasing the waters. And from
time to time over the next six months the latent inflationary pressure in the price controlled segment of the
economy will spillover and lead to sudden price increases in individual commodities. Managing this will be a
19
Please refer to the disclosures of potential conflict of interest and the disclaimer at the end of this report
Trắc nghiệm kiến thức chứng khoán Mỹ tại : www.sachchungkhoan.net
Strategy Report
MayAug
20th,
2008
Tue,
5th
2008
Chart 28 - Paddy production vesus Rice export growth since 2001
Source - Department of Finance in HCMC
Chart 29 - Price of normal rice in Vietnam vs price of rice in Thai
1700
VN Rice (VND/kg)
30
1600
Thai Rice (baht/kg)
25
1400
1300
1200
1100
Source - Department of Finance in HCMC
19,000
320
17,000
310
Unit: thousand VND
15,000
13,000
11,000
9,000
7/15/2008
7/1/2008
6/3/2008
6/17/2008
5/6/2008
5/20/2008
4/8/2008
4/22/2008
300
290
280
270
7/2/2008
6/18/2008
6/4/2008
5/21/2008
5/7/2008
4/23/2008
4/9/2008
3/26/2008
3/12/2008
2/27/2008
2/13/2008
1/30/2008
7/1/2008
5/1/2008
3/1/2008
1/1/2008
11/1/2007
9/1/2007
7/1/2007
5/1/2007
3/1/2007
1/1/2007
Source - Thai Nguyen Iron & Steel (wire rod 6θ)
1/2/2008
260
7,000
1/16/2008
Unit: thousand VND /ton
Source - Department of Finance in HCMC
Chart 32 - Price of Gas year to date (Petrolimex 13kg gas pot)
Chart 31 - Price of steel from Jan 2007 up to date
20
3/25/2008
3/11/2008
2/26/2008
2/12/2008
1/29/2008
1000
1/1/2008
7/2/2008
1500
7/16/2008
6/4/2008
6/18/2008
5/21/2008
5/7/2008
4/23/2008
0
4/9/2008
5
3/26/2008
2000
3/12/2008
10
2/27/2008
4000
2/13/2008
15
1/30/2008
6000
1/16/2008
20
1/2/2008
8000
1/15/2008
10000
Chart 30 - Price of Ha Tien Cement year to date (PC. B40)
unit: thousand VND /ton
12000
Source - GSO
35
14000
1H 2008
7/2/2008
6/4/2008
6/18/2008
5/7/2008
5/21/2008
4/9/2008
4/23/2008
3/26/2008
3/12/2008
2/27/2008
2/13/2008
1/30/2008
1/16/2008
1/2/2008
50,000
2007
COMPANY REPORT
55,000
2006
60,000
Rice export
2005
65,000
Paddy production
2004
Unit: VND/kg
70,000
35.0%
30.0%
25.0%
20.0%
15.0%
10.0%
5.0%
0.0%
-5.0%
-10.0%
-15.0%
-20.0%
2003
75,000
2002
80,000
2001
Chart 27 - Price of pork (pig’s trotter)
Source - Department of Finance in HCMC
Please refer to the disclosures of potential conflict of interest and the disclaimer at the end of this report
Trắc nghiệm kiến thức chứng khoán Mỹ tại : www.sachchungkhoan.net
Strategy Report
MayAug
20th,
2008
Tue,
5th
2008
Chart 33 - Over night rate vs 3 month VND NDF outright over last 4 months
25.00
23.00
21.00
19.00
17.00
15.00
COMPANY REPORT
13.00
11.00
9.00
7.00
5.00
22000
21000
20000
19000
18000
17000
overnight rate
16000
7/28/2008
7/21/2008
7/14/2008
7/7/2008
15000
6/30/2008
6/23/2008
6/16/2008
6/9/2008
6/2/2008
5/26/2008
5/19/2008
5/12/2008
5/5/2008
4/28/2008
4/21/2008
4/7/2008
4/14/2008
3/31/2008
VND NDF 3M
Source - GSO, estimates by HSC based on various sources
5)
Global conference call calms nerves
Looking back this was the turning point. The Finance
Minister and some other top officials held an unprecedented global conference call with investors on Thursday
19th June. The call was an attempt by the government
to remedy a dearth of information that had encouraged
speculation especially in the currency markets. Officials
shared their thoughts on several key concerns. Let’s recap the main points;
•
Still opposed to large scale devaluation –
This is a view that was expressed by the PM
earlier and the Finance Minister echoed it.
However they did leave the door open to widen the trading band and also commented that
the exchange rate was a matter of demand
and supply. In other words a market determined rate. This is tantamount to saying that
a gradual and managed depreciation might be
tolerated. In reality the small size of the forex
market means that it’s fairly easy for the authorities to guide its direction whenever they
want. As we have said many times, the authorities’s key goal is to maintain liquidity in the
exchange rate system to ensure that exporters
have access to enough US dollars. The minister also confirmed that the currency trading
band would be widened to +/- 2% which they
did shortly afterwards.
• Wants to maintain positive interest rates –
This was an interesting stance given that real interest rates have been negative for some time.
At the moment the highest allowed interest rate
is 21% while headline CPI was 26.8% y/y in the
1-H. We think they may have to raise the prime
rate one more time in Q3. Having switched
policy recently to a market based interest rate
21
policy the government will have to adjust rates
quickly to current market conditions.
• Assured us that BOP will stay positive
on strong FDI and ODA flows – While the
current account deficit has been spiraling, Vietnam’s BOP has stayed in surplus thanks to
steady growth in FDI disbursement, ODA and
remittance flows. As a result the government
stated that Vietnam posted a BOP surplus of
about $3 billion in Q1. The ODA drawdown this
year is likely to be about US$3 billion. Given
the lack of availability of credit both exporters
and importers are having a tough time currently. Therefore with the capital account showing
no signs of weakness the government believes
that the BOP may show a surplus from Q3 onwards. That looks quite ambitious to us.
• Targeted FY2008 GDP growth of 7% - This is
lower than the original 8.5-9% target but may
still be a bit high. Given the current credit crunch
and the difficulties faced by most importers and
exporters we think Q2 GDP growth rates will
fall away sharply. Frankly this is welcome and
one year of sub-par GDP growth is a small
price to pay to bring inflation back into line.
• Cut government expenditure further – They
announced that a 10% cut in government expenditure had already been achieved with a
further 10% cut in the works by year-end. And
that 25% of public works projects had been
frozen. We paid a visit to BT6 recently, which
depends heavily on government infrastructure
projects and they confirmed to us that many
projects were stalled. This is important not only
to set an example but also to reduce demand
for imported steel and clinker.
Please refer to the disclosures of potential conflict of interest and the disclaimer at the end of this report
Trắc nghiệm kiến thức chứng khoán Mỹ tại : www.sachchungkhoan.net
Strategy Report
MayAug
20th,
2008
Tue,
5th
2008
• Monetary stance remains tough – The
authorities will continue to squeeze credit
growth but the right policies are already in
place. Credit growth has collapsed since April
after progressive liquidity draining by the SBV.
• No FY2008 CPI target given – The minister
didn’t give a CPI target for FY2008 but the longer term
goal is clearly to bring CPI back into
COMPANY
REPORT
single digit territory as soon as possible. We
have always believed that CPI would peak over
the summer.
• US dollar reserves at US$20.7 billion – This
would cover about 2.8 months of imports and
we believe this is actually a very lowballed
number. Actual reserves may be somewhat
higher than this. Any way the point is that they
have more than enough reserves to cope with
any problems over the medium term They also
have access to about $80 billion in credit lines
from ASEAN central banks under the Chiang
Mai agreement.
22
The market reaction to these comments was fairly positive. The unofficial US$/VND rate began to ease back
from the date of the press conference. The market was
looking for a move on widening the trading band in an
attempt to bring the unofficial and official market back
into synch. And they got it.
Overall the conference call marked a turning point with
the authorities acknowledging that their initial response
was perhaps a little sluggish. However they seemed to
understand the current challenges and to have developed the right policy mix to meet it.
The next challenge for the government is to manage
SOE debt levels and oversee a consolidation in the
banking system. These are microeconomic issues and
in fact tougher to execute as there are far more players
involved in the game.
Please refer to the disclosures of potential conflict of interest and the disclaimer at the end of this report
Trắc nghiệm kiến thức chứng khoán Mỹ tại : www.sachchungkhoan.net
Strategy Report
MayAug
20th,
2008
Tue,
5th
2008
Source - CIEM, estimates by HSC
60%
15%
y/y %
10%
% of GDP
40%
20%
0%
0%
2008(e)
5%
2007
2008 1-H
(e)
2007
2006
2005
2004
2003
2002
2001
2000
0.0%
20%
2006
Money
Supply (M2)
COMPANY
REPORT
10.0%
80%
25%
2005
Credit Growth
100%
30%
2004
20.0%
120%
35%
2003
30.0%
140%
40%
2002
40.0%
45%
2001
45%
40%
35%
30%
25%
20%
15%
10%
5%
0%
50.0%
2000
60.0%
Chart 35 - Money supply growth and % of GDP
1999
Chart 34 - Credit crunch bites…Money Supply vs Credit growth
(2000-1-H 2008e)
Source - CIEM, estimates by HSC
The macroeconomic response
Killing the inflation dragon without burning down
the whole village.
Inflation acquired quite a grip and has required a sophisticated fiscal and monetary response to deal with it.
This is further complicated by the fact that some of the
drivers such as oil and food prices are international and
therefore outside the direct control of the government,
while others such as over–investment are mainly locally
made. The initial response was tentative. But both monetary and fiscal policy have been tightened considerably since Q1. The current policy mix seems appropriate although on the fiscal front we have yet to see how
far they will go.
As we mentioned before the growth bias in policy is
understandably strong and its always tough to change
direction. Cutting excess or wasteful infrastructure projects is one thing but in fact most of the ongoing infrastructure project pipeline is necessary for future growth.
Therefore a tight policy stance goes against the grain.
No choice however.
(1)
Turning off the credit fountain
Credit growth blew out spectacularly in the 2-H of FY2007
and this carried over until the end of Q1 this year. The
amount of outstanding loans rose from VND694 trillion
(71% of GDP) at the end of FY2006 to VND1,068 trillion
(93% of GDP) at the end of FY2007. And at the end of
1-H we estimate that outstanding loans had increased
by a further 15% to about VND1,230 trillion.
And of this, approximately 20-25% is in foreign currency loans, mainly US dollars. The blowout occurred
in two phases with VND loans increasing rapidly from
October, FY2007. Then later in the year when overnight
rates were nudged higher the focus of lending switched
to US$ lending which expanded rapidly until the end of
Q1, FY2008. Therefore of the 54% expansion in cred-
23
it last year, two thirds of the total occurred in the 2-H.
This amounts to a 2-H increase in outstanding loans of
VND250 trillion. Pretty serious stuff.
The proportion of dollar loans has remained pretty consistent throughout. Exporters, importers in particular
have dollar working capital needs and prefer loans in
the greenback. And in Q4 of last year when VND credit
was being cut back many other businesses also borrowed money in US$.
This dollar credit boom lasted a further 3 months until
March when restrictions were brought in. Even so, in
the first half of 2008, credit growth in foreign currency
reached around 20%. From Q1 however, the squeeze
was on and by May/June, credit growth had fallen to
about 1% growth m/m.
Luckily despite the credit boom, deposit/loan balances
in both VND and US$ are reasonably well matched currently. Vietcombank has estimated that current foreign
currency deposits are worth about US$17 billion, which
is slightly more than what we estimate the total amount
of outstanding US$ dollar loans in the system.
The SBV has tried to cut-off credit growth at the source
in various stages:
(1) Tackling repo lending for stock market investment
last summer;
(2) Draining liquidity from the money markets using
open market operations from the autumn onwards;
(3) Increasing reserve requirements on two separate
occasions from late last year;
(4) Imposing a 30% cap on credit expansion in FY2008,
(5) The quixotic attempt to cap deposit rates in Q1;
(6) A compulsory bond issue after the Tet holiday;
(7) Draining the state owned banks of VND50 trillion in
State Treasury monies and transferring this to the SBV,
an ongoing process;
Please refer to the disclosures of potential conflict of interest and the disclaimer at the end of this report
Trắc nghiệm kiến thức chứng khoán Mỹ tại : www.sachchungkhoan.net
Strategy Report
MayAug
20th,
2008
Tue,
5th
2008
(8) Restricting dollar lending to exporters, importers and
businesses with legitimate foreign currency needs.
(9) Raising the prime rate in two moves from 8.75% to
14% (we discuss that further in the next section).
The process was gradual and really only started to have
an impact on loan books towards the middle of March
this year. In Q credit growth was still about 11% q/q.
However
by Q2 REPORT
this had slowed dramatically to 6% q/q.
COMPANY
Now credit growth is believed to be below 1% m/m.
The SBV drained around VND17 trillion ($1.03 billion)
from the economy in the first half of 2008, causing the
value of cash in circulation at the end of June to drop
7.13% from the end of FY2007. Money supply or M2
grew by just 4.5% y/y. And the full year target is just
over double that number.
Overall the prescription has worked. The deposit rate
cap was the one policy that didn’t last very long. The
idea was too cut off credit at source by reducing the
growth of deposits into the banking system. Fair enough
but the money then flowed back into the real economy
out of bank deposits. And that puts it outside the government’s control and much of this may have been invested in gold or spent on imported consumer goods.
Hence that policy may have been successful in the narrow sense but was failing the wider goal of reducing
inflationary pressures.
However its adoption and then abandonment does illustrate the pragmatic nature of policy making. This type
of growth bubble is a new phenomenon for many policy
makers and the response comes with a certain level of
experimentation. While it doesn’t always look pretty the
good news is that unsuccessful policies tend to shelved
quietly. And the current mix looks right.
In place of a deposit cap the SBV has put in place an
active interest rate policy, using interest rates in conjunction with open market operations to control the
money markets.
Just having an interest rate policy here is a bit of a novelty in itself. The prime rate has hardly budged for years
and then in two swift moves in Q2 the SBV pushed the
rate from 8.75%, first to 12% and then to 14%. The other
key interest rates have moved up in tandem. Lending
rates are capped at 150% of the prime and this rule
is now being strictly enforced. Banks that try to top up
loans rates by adding all sorts of fees have been punished recently by the ever watchful SBV. The HCMC
branch director of two banks lost their jobs recently for
dong just that.
However despite having lending rates up around 21%,
24
real interest rates are still negative in Vietnam. Deposit rates edged steadily higher since the last prime
rate hike and one bank recently offered deposit rates
of 20%. This phase didn’t last long as the SBV stepped
in and guided mean deposit rates lower to 17-18%.
This interest rate spread is close to or below the breakeven point for many commercial banks. In June/July, the
SBV’s active policy of selling dollar for dong has added
to the upward pressure on rates as a relative shortage
of VND in the banking system pushed overnight lending rates towards the higher end of its six month range
above 20%.
To combat this they initiated a swap agreement enabling
banks to swap dollars for dong. And overnight rates
quickly fell towards 12% in the last two weeks. This constant fine tuning of market liquidity to guide market rates
marks a new SBV stance, making micro adjustments to
policy in tune with the markets.
Vietnam has long had an inverted yield curve which is
less a statement about future inflationary trends than
you might think. Traditionally demand is heavily biased
towards the short end as this is where banks and government finance most of their current funding requirements. Until now there hasn’t been a regular VGB issuance program at the long end.
In its fight against inflation the government has kept the
short-end under funded for some time, thereby pushing
up rates at that end. Yields at the long end have also
moved up but more slowly. Until recently the long end
was priced about 200 basis points lower than the short
end. Now the gap has narrowed.
All of this has had an effect on credit growth. Having
charged along at a rate in Q1, credit growth hit a brick wall
in April and has crawled along since. Part of this is the result of SBV pressure but banks themselves have turned
very cautious on lending given the difficult environment.
Demand for lending has also fallen. The interest rates
on existing short term loans are reset at far higher levels
as they are rolled over (every 3 to 6 months). Most resets increase monthly rates from about 1.1-1.2% up to
1.7-1.8%. This 50% increase in monthly payments gives
many borrowers a heart attack.
For the 2-H we believe that credit growth will continue
to edge along at an current average growth of 0.5-1%
per month. Some banks have already reached their
30% limit for the year. They have been told in no uncertain terms to stop further credit growth, a sure sign
that the 30% limit is being strictly enforced. At that rate
then we forecast that credit growth will not materially
Please refer to the disclosures of potential conflict of interest and the disclaimer at the end of this report
Trắc nghiệm kiến thức chứng khoán Mỹ tại : www.sachchungkhoan.net
Strategy Report
MayAug
20th,
2008
Tue,
5th
2008
exceed 30% by the year-end. Since 10-11% was done
in Q1, and about 19% in the 1-H it means that 2-H credit
growth will slow dramatically to 10%. Recently however
we have heard the SBV may expand the target to 40%
to help out exporters. That would mean selective lending to priority customers. We wait and see how that
might work in practice.
Banks
themselves
have also been taking some action
COMPANY
REPORT
to reduce exposure to risky parts of the economy such
as real estate and construction. Given that about 60%
of the total loans in the banking system are short term
with an average tenor of less than 6 months, banks are
able to take advantage of this by refusing to roll over
loans to certain customers they deem to be high risk.
Frankly speaking that’s easier said than done and the
effect of this is mostly at the margin.
However other key indicators such as industrial production, retail sales and yes, corporate earnings still appear
too robust. We need to see some slowdown in these
indicators before we can declare victory. Our belief is
that the current policy will feed through to the overall
economy from Q3, slightly ahead of schedule. And that
2-H GDP growth will fully reflect the current very tight
credit conditions.
We still expect that prime rates may increase one more
time in Q3. And we don’t expect any easing in credit
policy until at the earliest Q4 or more likely Q1, FY2009.
When it does happen we expect to see a combination
of interest rates cuts, an easing in reserve requirements
and the removal of restrictions on credit growth.
The credit crunch’s impact on the real economy takes
time. The US Federal Reserve has always estimated that it takes up to 6-9 months or 2-3 quarters for
a change in interest rates to feed through to the real
economy. That’s in the developed world and we wonder
if the effects in a developing world are faster or slower.
We think the impact hits faster as the economy is simpler
and alternatives to credit are far fewer. Import growth has
already responded with a sharp slowdown since March,
FY2008. The lack of availability of letters of credit (LC’s)
has hurt both importers and exporters quite badly.
25
Please refer to the disclosures of potential conflict of interest and the disclaimer at the end of this report
Trắc nghiệm kiến thức chứng khoán Mỹ tại : www.sachchungkhoan.net