- Trang chủ >>
- Sư phạm >>
- Sư phạm hóa
analytical electrochemistry 3ed wiley 2006
Bạn đang xem bản rút gọn của tài liệu. Xem và tải ngay bản đầy đủ của tài liệu tại đây (3.46 MB, 262 trang )
ANALYTICAL
ELECTROCHEMISTRY
ANALYTICAL
ELECTROCHEMISTRY
Third Edition
Joseph Wang
Copyright © 2006 by John Wiley & Sons, Inc. All rights reserved.
Published by John Wiley & Sons, Inc., Hoboken, New Jersey.
Published simultaneously in Canada.
No part of this publication may be reproduced, stored in a retrieval system, or transmitted in
any form or by any means, electronic, mechanical, photocopying, recording, scanning, or
otherwise, except as permitted under Section 107 or 108 of the 1976 United States Copyright
Act, without either the prior written permission of the Publisher, or authorization through
payment of the appropriate per-copy fee to the Copyright Clearance Center, Inc., 222
Rosewood Drive, Danvers, MA 01923, (978) 750-8400, fax (978) 750-4470, or on the web at
www.copyright.com. Requests to the Publisher for permission should be addressed to the
Permissions Department, John Wiley & Sons, Inc., 111 River Street, Hoboken, NJ 07030, (201)
748-6011, fax (201) 748-6008,or online at />Limit of Liability/Disclaimer of Warranty: While the publisher and author have used their best
efforts in preparing this book, they make no representations or warranties with respect to the
accuracy or completeness of the contents of this book and specifically disclaim any implied
warranties of merchantability or fitness for a particular purpose. No warranty may be created
or extended by sales representatives or written sales materials. The advice and strategies
contained herein may not be suitable for your situation. You should consult with a professional
where appropriate. Neither the publisher nor author shall be liable for any loss of profit or any
other commercial damages, including but not limited to special, incidental, consequential, or
other damages.
For general information on our other products and services or for technical support, please
contact our Customer Care Department within the United States at (800) 762-2974, outside the
United States at( 317) 572-3993 or fax (317) 572-4002.
Wiley also publishes its books in a variety of electronic formats. Some content that appears in
print may not be available in electronic formats. For more information about Wiley products,
visit our web site at www.wiley.com.
Library of Congress Cataloging-in-Publication Data:
Wang, Joseph, 1948–
Analytical electrochemistry / Joseph Wang.—3rd ed.
p. cm.
ISBN-13 978-0-471-67879-3 (cloth)
ISBN-10 0-471-67879-1 (cloth)
1. Electrochemical analysis. I. Title.
QD115.W33 2006
543′.4—dc22
2005028185
Printed in the United States of America.
10987654321
Dedicated to the memory of my parents, Elka and Moshe Wang
vii
CONTENTS
Preface xi
Abbreviations and Symbols xiii
1 Fundamental Concepts 1
1.1 Why Electroanalysis?, 1
1.2 Faradaic Processes, 3
1.2.1 Mass-Transport-Controlled Reactions, 4
1.2.1.1 Potential-Step Experiment, 7
1.2.1.2 Potential-Sweep Experiments, 9
1.2.2 Reactions Controlled by the Rate of Electron Transfer, 12
1.2.2.1 Activated Complex Theory, 16
1.3 Electrical Double Layer, 19
1.4 Electrocapillary Effect, 23
1.5 Supplementary Reading, 25
Problems, 27
References, 28
2 Study of Electrode Reactions and Interfacial Properties 29
2.1 Cyclic Voltammetry, 29
2.1.1 Data Interpretation, 32
2.1.1.1 Reversible Systems, 32
2.1.1.2 Irreversible and Quasi-reversible Systems, 34
2.1.2 Study of Reaction Mechanisms, 35
2.1.3 Study of Adsorption Processes, 37
2.1.4 Quantitative Applications, 41
2.2 Spectroelectrochemistry, 42
2.2.1 Experimental Arrangement, 43
2.2.2 Principles and Applications, 44
2.2.3 Electrochemiluminescence, 47
2.2.4 Optical Probing of Electrode–Solution Interfaces, 48
2.3 Scanning Probe Microscopy, 49
2.3.1 Scanning Tunneling Microscopy, 50
2.3.2 Atomic Force Microscopy, 51
2.3.3 Scanning Electrochemical Microscopy, 53
2.4 Electrochemical Quartz Crystal Microbalance, 57
2.5 Impedance Spectroscopy, 58
Examples, 61
Problems, 63
References, 64
3 Controlled-Potential Techniques 67
3.1 Chronoamperometry, 67
3.2 Polarography, 69
3.3 Pulse Voltammetry, 76
3.3.1 Normal-Pulse Voltammetry, 76
3.3.2 Differential-Pulse Voltammetry, 77
3.3.3 Square-Wave Voltammetry, 80
3.3.4 Staircase Voltammetry, 82
3.4 AC Voltammetry, 84
3.5 Stripping Analysis, 85
3.5.1 Anodic Stripping Voltammetry, 86
3.5.2 Potentiometric Stripping Analysis, 89
3.5.3 Adsorptive Stripping Voltammetry and Potentiometry, 91
3.5.4 Cathodic Stripping Voltammetry, 94
3.5.5 Abrasive Stripping Voltammetry, 94
3.5.6 Applications, 94
3.6 Flow Analysis, 98
3.6.1 Principles, 98
3.6.2 Cell Design, 100
3.6.3 Mass Transport and Current Response, 103
3.6.4 Detection Modes, 105
Examples, 108
Problems, 111
References, 112
4 Practical Considerations 115
4.1 Electrochemical Cells, 115
4.2 Solvents and Supporting Electrolytes, 117
viii CONTENTS
4.3 Oxygen Removal, 118
4.4 Instrumentation, 119
4.5 Working Electrodes, 123
4.5.1 Mercury Electrodes, 123
4.5.2 Solid Electrodes, 127
4.5.2.1 Rotating Disk and Rotating Ring Disk Electrodes, 128
4.5.2.2 Carbon Electrodes, 130
4.5.2.2.1 Glassy Carbon Electrodes, 131
4.5.2.2.2 Carbon Paste Electrodes, 131
4.5.2.2.3 Carbon Fiber Electrodes, 133
4.5.2.2.4 Diamond Electrodes, 133
4.5.2.3 Metal Electrodes, 134
4.5.3 Chemically Modified Electrodes, 136
4.5.3.1 Self-Assembled Monolayers, 136
4.5.3.2 Carbon-Nanotube-Modified Electrodes, 139
4.5.3.3 Sol-gel Encapsulation of Reactive Species, 139
4.5.3.4 Electrocatalytically Modified Electrodes, 140
4.5.3.5 Preconcentrating Electrodes, 141
4.5.3.6 Permselective Coatings, 143
4.5.3.7 Conducting Polymers, 146
4.5.4 Microelectrodes, 149
4.5.4.1 Diffusion at Microelectrodes, 151
4.5.4.2 Microelectrode Configurations, 152
4.5.4.3 Composite Electrodes, 154
Examples, 158
Problems, 158
References, 159
5 Potentiometry 165
5.1 Principles of Potentiometric Measurements, 165
5.2 Ion-Selective Electrodes, 173
5.2.1 Glass Electrodes, 173
5.2.1.1 pH Electrodes, 173
5.2.1.2 Glass Electrodes for Other Cations, 177
5.2.2 Liquid Membrane Electrodes, 177
5.2.2.1 Ion Exchanger Electrodes, 179
5.2.2.2 Neutral Carrier Electrodes, 182
5.2.3 Solid-State Electrodes, 185
5.2.4 Coated-Wire Electrodes and Solid-State Electrodes Without an
Internal Filling Solution, 188
5.3 On-line, On-site, and In Vivo Potentiometric Measurements, 190
Examples, 194
Problems, 196
References, 197
CONTENTS ix
6 Electrochemical Sensors 201
6.1 Electrochemical Biosensors, 202
6.1.1 Enzyme-Based Electrodes, 202
6.1.1.1 Practical and Theoretical Considerations, 202
6.1.1.2 Enzyme Electrodes of Analytical Significance, 208
6.1.1.2.1 Glucose Sensors, 208
6.1.1.2.2 Ethanol Electrodes, 212
6.1.1.2.3 Urea Electrodes, 213
6.1.1.2.4 Toxin (Enzyme Inhibition) Biosensors, 215
6.1.1.3 Tissue and Bacteria Electrodes, 215
6.1.2 Affinity Biosensors, 216
6.1.2.1 Immunosensors, 216
6.1.2.2 DNA Hybridization Biosensors, 218
6.1.2.2.1 Background and Principles, 218
6.1.2.2.2 Electrical Transduction of DNA
Hybridization, 219
6.1.2.2.3 Other Electrochemical DNA
Biosensors, 221
6.1.2.3 Receptor-Based Sensors, 222
6.1.2.4 Electrochemical Sensors Based on Molecularly
Imprinted Polymers, 224
6.2 Gas Sensors, 224
6.2.1 Carbon Dioxide Sensors, 225
6.2.2 Oxygen Electrodes, 226
6.3 Solid-State Devices, 227
6.3.1 Ion-Selective Field Effect Transistors, 227
6.3.2 Microfabrication of Solid-State Sensor Assemblies, 229
6.3.3 Microfabrication Techniques, 229
6.3.4 Micromachined Analytical Microsystems, 232
6.4 Sensor Arrays, 234
Examples, 237
Problems, 238
References, 239
Index 245
x CONTENTS
xi
PREFACE
The goal of this textbook is to cover the full scope of modern electroanalyti-
cal techniques and devices. The main emphasis is on electroanalysis, rather
than physical electrochemistry. The objective is to provide a sound under-
standing of the fundamentals of electrode reactions and the principles of elec-
trochemical methods, and to demonstrate their potential for solving real-life
analytical problems. The high performance, small size, and low cost of elec-
trochemical devices has led to many important detection systems. Given the
impressive progress in electroanalytical chemistry and its growing impact on
analytical chemistry, this work offers also an up-to-date, easy-to-read presen-
tation of more recent advances, including new methodologies, sensors, detec-
tors, and microsystems. The book is suitable for a graduate-level course in
electroanalytical chemistry or as a supplement to a high-level undergraduate
course in instrumental analysis. It should also be very useful to those consid-
ering the use of electroanalysis in their laboratories.
The material is presented in six roughly equal chapters. The first chapter is
devoted to fundamental aspects of electrode reactions and the structure of the
interfacial region. Chapter 2 discusses the study of electrode reactions and
high-resolution surface characterization. Chapter 3 gives an overview of finite-
current-controlled potential techniques. Chapter 4 describes the electro-
chemical instrumentation and electrode materials (including new and modified
microelectrodes). Chapter 5 deals with the principles of potentiometric meas-
urements and various classes of ion-selective electrodes, while Chapter 6 is
devoted to the growing field of chemical sensors (including modern biosen-
sors, gas sensors, microchip devices, and sensor arrays). Numerous up-to-date
references, covering the latest literature, are given at the end of each chapter.
By discussing more recent advances, this book attempts to bridge the common
gap between research literature and standard textbooks.
This third edition of Analytical Electrochemistry is extensively revised and
updated, and reflects the rapid growth of electroanalytical chemistry since
1999. It contains a number of new topics, including DNA biosensors, imped-
ance spectroscopy, detection for capillary electrophoresis, diamond electrodes,
carbon-nanotube- and nanoparticle-based assays and devices, large-amplitude
AC voltammetry, microfluidic (“lab on a chip”) devices, or molecularly-
imprinted polymeric sensors. Other topics, such as the principles of potentio-
metric measurements, spectroelectrochemistry, electrochemiluminescence,
modified and microelectrodes, scanning electrochemical and atomic force
microscopies, electrical communication between redox enzymes and elec-
trodes, explosive detection, or enzyme and immunoelectrodes, have been
greatly expanded. The entire text has been updated to cover the very latest
(as of August 2005) developments in electroanalytical chemistry. Numerous
new illustrations, worked-out examples and end-of-chapter problems have
been added to this edition. Existing figures have been redrawn and improved.
In the 5 years since the second edition I have received numerous suggestions,
many of which have been incorporated in the second edition.
Finally, I wish to thank my wife, Ruth, and my daughter, Sharon, for their
love and patience; Vairavan Subramanian and Daphne Hui for their technical
assistance; the editorial and production staff of John Wiley & Sons, Inc. for
their help and support; Professor Erno Pretsch (ETH, Zurich) for extremely
useful suggestions; and the numerous electrochemists across the globe who led
to the advances reported in this textbook. Thank you all!
Joseph Wang
Tempe, AZ
xii PREFACE
xiii
ABBREVIATIONS AND SYMBOLS
a Activity
A Area of electrode
Ab Antibody
AC Alternating current
AdSV Adsorptive stripping voltammetry
AE Auxiliary electrode
AES Auger electron spectroscopy
AFM Atomic force microscopy
Ag Antigen
ASV Anodic stripping voltammetry
B Adsorption coefficient
BDD Boron-doped diamond
C Concentration
C
dl
Differential capacitance
CE Counter electrode
CME Chemically modified electrode
CNT Carbon nanotube
CSV Cathodic stripping voltammetry
CV Cyclic voltammetry
CWE Coated-wire electrode
CZE Capillary-zone electrophoresis
D Diffusion coefficient
DME Dropping mercury electrode
DNA Deoxyribonucleic acid
DP Differential pulse
DPV Differential pulse voltammetry
E Potential (V)
∆E Pulse amplitude
E° Standard electrode potential
E
1/2
Half-wave potential
E
p
Peak potential
E
pzc
Potential of zero charge
EC Electrode process involving electrochemical followed by chemical
steps
ECL Electrochemiluminescence
EQCM Electrochemical quartz crystal microbalance
ESCA Electron spectroscopy for chemical analysis
EXAFS X-ray adsorption fine structure
F Faraday constant
FET Field effect transistor
FIA Flow injection analysis
f
i
Activity coefficient
f
0
Base resonant frequency
FTIR Fourier transform infrared
∆G‡ Free energy of activation
HMDE Hanging mercury drop electrode
i Electric current
i
c
Charging current
i
t
Tunneling current
IHP Inner Helmholz plane
IRS Internal reflectance spectroscopy
ISE Ion-selective electrode
ISFET Ion-selective field effect transistor
J Flux
k
ij
pot
Potentiometric selectivity coefficient
k° Standard rate constant
K
m
(1) Michaelis Menten constant; (2) mass transport coefficient
LB Langmuir–Blodgett
LCEC Liquid chromatography/electrochemistry
LEED Low-energy electron diffraction
m Mercury flow rate (in polarography)
∆m Mass charge (in EQCM)
MFE Mercury film electrode
µTAS Micro–total analytical system
MIP Molecularly imprinted polymer
MLR Multiple linear regression
MWCNT Multiwall carbon nanotube
N Collection efficiency
n Number of electrons transferred
NP Normal pulse
xiv ABBREVIATIONS AND SYMBOLS
O The oxidized species
OHP Outer Helmholz plane
OTE Optically transparent electrode
PAD Pulsed amperometric detection
PCR Principal-component regression
PLS Partial least squares
PSA Potentiometric stripping analysis
PVC Poly(vinyl chloride)
q Charge
QCM Quartz crystal microbalance
R (1) Resistance; (2) gas constant
R
p
Electron transfer resistance
R
s
Ohmic resistance of the electrolyte solution
RDE Rotating disk electrode
Re Reynolds number
RE Reference electrode
RRDE Rotating ring–disk electrode
RVC Reticulated vitreous carbon
S (1) Barrier width (in STM); (2) substrate
SAM Self-assembled monolayer
SECM Scanning electrochemical microscopy
SEM Scanning electron microscopy
SERS Surface enhanced Raman scattering
SPM Scanning probe microscopy
STM Scanning tunneling microscopy
SW Square wave
SWCNT Single-wall carbon nanotube
SWV Square-wave voltammetry
T Temperature
t Time
t
m
Transition time (in PSA)
U Flow rate
UHV Ultrahigh vacuum
v Potential scan rate
V
Hg
Volume of mercury electrode
W Peak width (at half-height)
WE Working electrode
WJD Wall-jet detector
XPS X-ray photoelectron spectroscopy
α Transfer coefficient
Γ Surface coverage
γ Surface tension
δ Thickness of the diffusion layer
δ
H
Thickness of the hydrodynamic boundary layer
ABBREVIATIONS AND SYMBOLS xv
ε Dielectric constant
Overvoltage
µ Ionic strength
Kinematic viscosity
ω Angular velocity
xvi ABBREVIATIONS AND SYMBOLS
1
Analytical Electrochemistry, Third Edition, by Joseph Wang
Copyright © 2006 John Wiley & Sons, Inc.
1
FUNDAMENTAL CONCEPTS
1.1 WHY ELECTROANALYSIS?
Electroanalytical techniques are concerned with the interplay between
electricity and chemistry, namely, the measurements of electrical quantities,
such as current, potential, or charge and their relationship to chemical param-
eters. Such use of electrical measurements for analytical purposes has found
a vast range of applications, including environmental monitoring, industrial
quality control, or biomedical analysis. Advances since the mid-1980s, in-
cluding the development of ultramicroelectrodes, the design of tailored inter-
faces and molecular monolayers, the coupling of biological components and
electrochemical transducers, the synthesis of ionophores and receptors
containing cavities of molecular size, the development of ultratrace voltam-
metric techniques or of high-resolution scanning probe microscopies, and
the microfabrication of molecular devices or efficient flow detectors, have led
to a substantial increase in the popularity of electroanalysis and to its expan-
sion into new phases and environments. Indeed, electrochemical probes are
receiving a major share of the attention in the development of chemical
sensors.
In contrast to many chemical measurements, which involve homogeneous
bulk solutions, electrochemical processes take place at the electrode–solution
interface.The distinction between various electroanalytical techniques reflects
the type of electrical signal used for the quantitation. The two principal types
of electroanalytical measurements are potentiometric and potentiostatic. Both
types require at least two electrodes (conductors) and a contacting sample
(electrolyte) solution, which constitute the electrochemical cell. The electrode
surface is thus a junction between an ionic conductor and an electronic con-
ductor. One of the two electrodes responds to the target analyte(s) and is thus
termed the indicator (or working) electrode. The second one, termed the ref-
erence electrode, is of constant potential (i.e., independent of the properties
of the solution). Electrochemical cells can be classified as electrolytic (when
they consume electricity from an external source) or galvanic (if they are used
to produce electrical energy).
Potentiometry (discussed in Chapter 5), which is of great practical impor-
tance, is a static (zero-current) technique in which the information about the
sample composition is obtained from measurement of the potential estab-
lished across a membrane. Different types of membrane materials, possessing
different ion recognition processes, have been developed to impart high selec-
tivity. The resulting potentiometric probes have thus been widely used for
several decades for direct monitoring of ionic species such as protons or
calcium, fluoride, and potassium ions in complex samples.
Controlled-potential (potentiostatic) techniques deal with the study of
charge transfer processes at the electrode–solution interface, and are based on
dynamic (non-zero-current) situations. Here, the electrode potential is being
used to derive an electron transfer reaction and the resultant current is meas-
ured.The role of the potential is analogous to that of the wavelength in optical
measurements. Such a controllable parameter can be viewed as “electron pres-
sure,” which forces the chemical species to gain or lose an electron (reduction
or oxidation, respectively). Accordingly, the resulting current reflects the rate
at which electrons move across the electrode–solution interface. Potentiosta-
tic techniques can thus measure any chemical species that is electroactive, that
is, that can be made to reduce or oxidize. Knowledge of the reactivity of func-
tional group in a given compound can be used to predict its electroactivity.
Nonelectroactive compounds may also be detected in connection with indi-
rect or derivatization procedures.
The advantages of controlled-potential techniques include high sensitivity,
selectivity toward electroactive species, a wide linear range, portable and
low-cost instrumentation, speciation capability, and a wide range of electrodes
that allow assays of unusual environments. Several properties of these
techniques are summarized in Table 1.1. Extremely low (nanomolar)
detection limits can be achieved with very small (5–20-µL) sample volumes,
thus allowing the determination of analyte amounts ranging from 10
−13
to
10
−15
mol on a routine basis. Improved selectivity may be achieved via the
coupling of controlled-potential schemes with chromatographic or optical
procedures.
This chapter attempts to give an overview of electrode processes, together
with discussion of electron transfer kinetics, mass transport, and the
electrode–solution interface.
2 FUNDAMENTAL CONCEPTS
1.2 FARADAIC PROCESSES
The objective of controlled-potential electroanalytical experiments is to
obtain a current response that is related to the concentration of the target
analyte. Such an objective is accomplished by monitoring the transfer of elec-
tron(s) during the redox process of the analyte:
(1.1)
where O and R are the oxidized and reduced forms, respectively, of the redox
couple. Such a reaction will occur in a potential region that makes the elec-
tron transfer thermodynamically or kinetically favorable. For systems con-
trolled by the laws of thermodynamics, the potential of the electrode can be
used to establish the concentration of the electroactive species at the surface
[C
O
(0,t) and C
R
(0,t)] according to the Nernst equation
(1.2)
where E° is the standard potential for the redox reaction, R is the universal
gas constant (8.314JK
−1
mol
−1
), T is the Kelvin temperature, n is the number
of electrons transferred in the reaction, and F is the Faraday constant [96,487C
EE
RT
nF
Ct
Ct
=°+
()
()
23
0
0
.
log
O
R
,
,
OeR+
−
n ∫
FARADAIC PROCESSES 3
TABLE 1.1 Properties of Controlled-Potential Techniques
a
Speed
Working Detection (Time per Response
Technique Electrode Limit (M) Cycle) (min) Shape
DC polarography DME 10
−5
3 Wave
NP polarography DME 5 × 10
−7
3 Wave
DP polarography DME 10
−8
3 Peak
DP voltammetry Solid 5 × 10
−7
3 Peak
SW polarography DME 10
−8
0.1 Peak
AC polarography DME 5 × 10
−7
1 Peak
Chronoamperometry Stationary 10
−5
0.1 Transient
Cyclic voltammetry Stationary 10
−5
0.1–2 Peak
Stripping voltammetry HMDE, MFE 10
−10
3–6 Peak
Adsorptive stripping HMDE 10
−10
2–5 Peak
voltammetry
Adsorptive stripping Solid 10
−9
4–5 Peak
voltammetry
Adsorptive catalytic HMDE 10
−12
2–5 Peak
stripping voltammetry
a
All acronyms used here are included in the “Abbreviations and Symbols” list following the
Preface.
(coulombs)]. On the negative side of E°, the oxidized form thus tends to be
reduced, and the forward reaction (i.e., reduction) is more favorable. The
current resulting from a change in oxidation state of the electroactive species
is termed the faradaic current because it obeys Faraday’s law (i.e., the reaction
of 1mol of substance involves a change of n × 96,487 C).The faradaic current
is a direct measure of the rate of the redox reaction. The resulting
current–potential plot, known as the voltammogram, is a display of current
signal [vertical axis (ordinate)] versus the excitation potential [horizontal axis
(abscissa)]. The exact shape and magnitude of the voltammetric response is
governed by the processes involved in the electrode reaction.The total current
is the summation of the faradaic currents for the sample and blank solutions,
as well as the nonfaradaic charging background current (discussed in Section
1.3).
The pathway of the electrode reaction can be quite complicated, and
takes place in a sequence that involves several steps. The rate of such
reactions is determined by the slowest step in the sequence. Simple reactions
involve only mass transport of the electroactive species to the electrode
surface, electron transfer across the interface, and transport of the product
back to the bulk solution. More complex reactions include additional chemi-
cal and surface processes that either precede or follow the actual electron
transfer. The net rate of the reaction, and hence the measured current, may
be limited by either mass transport of the reactant or the rate of electron
transfer.The more sluggish process will be the rate-determining step.Whether
a given reaction is controlled by mass transport or electron transfer is
usually determined by the type of compound being measured and by various
experimental conditions (electrode material, media, operating potential,
mode of mass transport, time scale, etc.). For a given system, the rate-deter-
mining step may thus depend on the potential range under investigation.
When the overall reaction is controlled solely by the rate at which the
electroactive species reach the surface (i.e., a facile electron transfer), the
current is said to be mass-transport-limited. Such reactions are called nernst-
ian or reversible, because they obey thermodynamic relationships. Several
important techniques (discussed in Chapter 4) rely on such mass-transport-
limited conditions.
1.2.1 Mass-Transport-Controlled Reactions
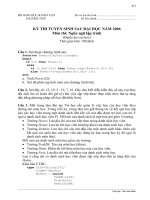
Mass transport occurs by three different modes:
•
Diffusion—the spontaneous movement under the influence of concen-
tration gradient, from regions of high concentrations to regions of lower
ones, aimed at minimizing concentration differences.
•
Convection—transport to the electrode by a gross physical movement; the
major driving force for convection is an external mechanical energy asso-
ciated with stirring or flowing the solution or rotating or vibrating the
4 FUNDAMENTAL CONCEPTS
electrode (i.e., forced convection). Convection can also occur naturally
as a result of density gradients.
•
Migration—movement of charged particles along an electrical field (i.e.,
where the charge is carried through the solution by ions according to their
transference number).
These modes of mass transport are illustrated in Figure 1.1.
The flux (J), a common measure of the rate of mass transport at a fixed
point, is defined as the number of molecules penetrating a unit area of an imag-
inary plane in a unit of time and is expressed in units of molcm
−2
s
−1
. The flux
to the electrode is described mathematically by a differential equation, known
as the Nernst–Planck equation, given here for one dimension
(1.3)
Jxt D
zFDC
RT
xt
x
CxtVxt,
Cx,t
x
,
,,
()
=−
∂
()
∂
−
∂
()
∂
+
()()
φ
FARADAIC PROCESSES 5
+
+
+
+
+
–
–
–
–
–
–
Diffusion
Migration
Convection
–
–
–
–
–
Figure 1.1 The three modes of mass transport. (Reproduced with permission from
Ref. 1.)
where D is the diffusion coefficient (cm
2
/s); [∂C(x,t)]/∂x is the concentration
gradient (at distance x and time t); [∂φ(x,t)]/∂x is the potential gradient; z and
C are the charge and concentration, respectively, of the electroactive species;
and V(x,t) is the hydrodynamic velocity (in the x direction). In aqueous media,
D usually ranges between 10
−5
and 10
−6
cm
2
/s. The current (i) is directly pro-
portional to the flux and the surface area (A):
(1.4)
As indicated by Eq. (1.3), the situation is quite complex when the three
modes of mass transport occur simultaneously. This complication makes it dif-
ficult to relate the current to the analyte concentration. The situation can be
greatly simplified by suppressing the electromigration through the addition of
excess inert salt. This addition of a high concentration of the supporting elec-
trolyte (compared to the concentration of electroactive ions) helps reduce the
electrical field by increasing the solution conductivity. Convection effects can
be eliminated by using a quiescent solution. In the absence of migration and
convection effects, movement of the electroactive species is limited by diffu-
sion. The reaction occurring at the surface of the electrode generates a con-
centration gradient adjacent to the surface, which in turn gives rise to a
diffusional flux. Equations governing diffusion processes are thus relevant to
many electroanalytical procedures.
According to Fick’s first law, the rate of diffusion (i.e., the flux) is directly
proportional to the slope of the concentration gradient:
(1.5)
Combination of Eqs. (1.4) and (1.5) yields a general expression for the current
response:
(1.6)
Hence, the current (at any time) is proportional to the concentration gradient
of the electroactive species. As indicated by the equations above, the diffu-
sional flux is time-dependent. Such dependence is described by Fick’s second
law (for linear diffusion):
(1.7)
This equation reflects the rate of change with time of the concentration
between parallel planes at points x and (x + dx) (which is equal to the differ-
∂
()
∂
=
∂
()
∂
Cx,t
t
Cx,t
x
2
D
2
i nFAD=
∂
()
∂
Cx,t
x
Jxt D,
Cx,t
x
()
=−
∂
()
∂
i nFAJ=−
6 FUNDAMENTAL CONCEPTS
ence in flux at the two planes). Fick’s second law is valid for the conditions
assumed, namely, planes parallel to one another and perpendicular to the
direction of diffusion, specifically, conditions of linear diffusion. In contrast,
for the case of diffusion toward a spherical electrode (where the lines of flux
are not parallel but are perpendicular to segments of the sphere), Fick’s second
law is expressed as
(1.8)
where r is the distance from the center of the electrode. Overall, Fick’s laws
describe the flux and the concentration of the electroactive species as func-
tions of position and time. The solution of these partial differential equations
usually requires application of a (Laplace transformation) mathematical
method. The Laplace transformation is of great value for such application, as
it enables the conversion of the problem into a domain where a simpler math-
ematical manipulation is possible. Details of using the Laplace transformation
are beyond the scope of this text, and can be found in Ref. 2. The establish-
ment of proper initial and boundary conditions (which depend on the
specific experiment) is also essential for this treatment. The current–
concentration–time relationships resulting from such treatment are described
below for several relevant experiments.
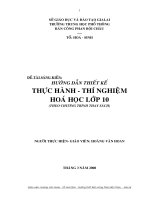
1.2.1.1 Potential-Step Experiment Let us see, for example, what happens
in a potential-step experiment involving the reduction of O to R, a potential
value corresponding to complete reduction of O, a quiescent solution, and a
planar electrode embedded in a planar insulator. (Only O is initially present
in solution.) The current–time relationship during such an experiment can be
understood from the resulting concentration–time profiles. Since the surface
concentration of O is zero at the new potential, a concentration gradient is
established near the surface. The region within which the solution is depleted
of O is known as the diffusion layer, and its thickness is given by δ. The con-
centration gradient is steep at first, and the diffusion layer is thin (see Fig. 1.2
for t
1
). As time goes by, the diffusion layer expands (to δ
2
and δ
3
at t
2
and t
3
),
and hence the concentration gradient decreases.
Initial and boundary conditions in such an experiment include C
O
(x,0) =
C
O
(b) [i.e., at t = 0, the concentration is uniform throughout the system and
equal to the bulk concentration, C
O
(b)], C
O
(0,t) = 0 for t > 0 (i.e., at later times
the surface concentration is zero); and C
O
(x,0) → C
O
(b) as x →∞(i.e., the
concentration increases as the distance from the electrode increases). Solution
to Fick’s laws (for linear diffusion, i.e., a planar electrode) for these conditions
results in a time-dependent concentration profile:
(1.9)
Cxt C x Dt
OO O
, b erf
()
=
()
−
()
[]
{}
14
12
∂
∂
=
∂
∂
+
∂
∂
C
t
C
r
2
r
C
r
D
2
2
FARADAIC PROCESSES 7
whose derivative with respect to x gives the concentration gradient at the
surface
(1.10)
when substituted into Eq. (1.6) leads to the well-known Cottrell equation:
(1.11)
Thus, the current decreases in proportion to the square root of time, with
(πD
O
t)
1/2
corresponding to the diffusion-layer thickness.
Solving Eq. (1.8) (using Laplace transform techniques) will yield the time
evolution of the current of a spherical electrode:
(1.12)
The current response of a spherical electrode following a potential step thus
contains both time-dependent and time-independent terms—reflecting the
planar and spherical diffusional fields, respectively (Fig. 1.3)—becoming time
independent at long timescales. As expected from Eq. (1.12), the change from
one regime to another is strongly dependent on the radius of the electrode.
i t nFAD C D t nFAD C r
()
=
()( )
+
OO O OO
b π
12
i t nFAD C D t
()
=
()( )
OO O
b π
12
∂
∂
=
()( )
C
x
b
OO
CDtπ
12
8 FUNDAMENTAL CONCEPTS
d
1
d
2
d
3
Distance from
electrode surface
Concentration of
electroactive substance
t
1
C
b
C
0
t
2
t
3
t
3
> t
2
> t
1
Figure 1.2 Concentration profiles for different times after the start of a potential-step
experiment.
The unique mass transport properties of ultramicroelectrodes (discussed in
Section 4.5.4) are attributed to shrinkage of the electrode radius.
1.2.1.2 Potential-Sweep Experiments Let us move to a voltammetric
experiment involving a linear potential scan, the reduction of O to R and a
quiescent solution.The slope of the concentration gradient is given by (C
O
(b,t)
− C
O
(0,t))/δ, where C
O
(b,t) and C
O
(0,t) are the bulk and surface concentrations
of O. The change in the slope, and hence the resulting current, are due to
changes of both C
O
(0,t) and δ. First, as the potential is scanned negatively, and
approaches the standard potential (E°) of the couple, the surface concentra-
tion rapidly decreases in accordance with the Nernst equation [Eq. (1.2)]. For
example, at a potential equal to E° the concentration ratio is unity [C
O
(0,t)/
C
R
(0,t) = 1]. For a potential 59mV more negative than E°, C
R
(0,t) is present
at 10-fold excess [C
O
(0,t)/C
R
(0,t)] =
1
/
10
(n = 1). The decrease in C
O
(0,t) is
coupled with an increase in the diffusion-layer thickness, which dominates the
FARADAIC PROCESSES 9
(a)
(b)
Figure 1.3 Planar (a) and spherical (b) diffusional fields at spherical electrodes.
change in slope after C
O
(0,t) approaches zero. The net result is a peak-
shaped voltammogram. Such current–potential curves and the correspond-
ing concentration–distance profiles (for selected potentials along the scan)
are shown in Figure 1.4. As will be discussed in Section 4.5.4, shrinking the
electrode dimension to the micrometer domain results in a sigmoid-shaped
voltammetric response under quiescent conditions, characteristic of the dif-
ferent (radial) diffusional field and higher flux of electroactive species of
ultramicroelectrodes.
Let us see now what happens in a similar linear scan voltammetric experi-
ment, but utilizing a stirred solution. Under these conditions, the bulk con-
centration (C
O(b,t)
) is maintained at a distance δ by the stirring. It is not
influenced by the surface electron transfer reaction (as long as the electrode-
area : solution-volume ratio is small).The slope of the concentration–distance
profile {[C
O
(b,t) − C
O
(0,t)]/δ} is thus determined solely by the change in the
surface concentration [C
O
(0,t)]. Hence, the decrease in C
O
(0,t) during the
potential scan (around E°) results in a sharp rise in the current.When a poten-
tial more negative than E° by 118mV is reached, C
O
(0,t) approaches zero, and
a limiting current (i
l
) is achieved:
(1.13)
i
nFAD C t
l
OO
b,
=
()
δ
10 FUNDAMENTAL CONCEPTS
Distance
E
p
E
p
Concentration
118 –11859 0 –59
n(E – E
°′) (mV)
Current
Figure 1.4 Concentration profiles (left) for different potentials during a linear sweep
voltammetric experiment in unstirred solution. The resulting voltammogram is shown
on the right, along with the points corresponding to each concentration gradient.
(Reproduced with permission from Ref. 1.)
The resulting voltammogram thus has a sigmoidal (wave) shape. By increas-
ing the stirring rate (U), the diffusion layer thickness becomes thinner, accord-
ing to
(1.14)
where B and α are constants for a given system.As a result, the concentration
gradient becomes steeper (see Fig. 1.5, curve b), thereby increasing the limit-
ing current. Similar considerations apply to other forced convection systems,
including those relying on solution flow or electrode rotation (see Sections 3.6
and 4.5, respectively). For all of these hydrodynamic systems, the sensitivity of
the measurement can be enhanced by increasing the convection rate.
Initially it was assumed that no solution movement occurs within the dif-
fusion layer. Actually, a velocity gradient exists in a layer, termed the hydro-
dynamic boundary layer (or the Prandtl layer), where the fluid velocity
increases from zero at the interface to the constant bulk value (U). The thick-
ness of the hydrodynamic layer δ
H
is related to that of the diffusion layer
(1.15)
where is kinematic viscosity. In aqueous media (with ~ 10
−2
cm
2
/s and D ~
10
−5
cm
2
/s), δ
H
is approximately 10-fold larger than δ, indicating negligible con-
δδ≅
D
13
H
δ
α
=
B
U
FARADAIC PROCESSES 11
Distance
Concentration
C = 0
0
b
a
C
b
d
b
d
a
Figure 1.5 Concentration profiles for two rates of convection transport: low (curve a)
and high (curve b).