differentiation of brewing yeast strains by pyrolysis
Bạn đang xem bản rút gọn của tài liệu. Xem và tải ngay bản đầy đủ của tài liệu tại đây (210.56 KB, 9 trang )
Yeast 14, 885–893 (1998)
Differentiation of Brewing Yeast Strains by Pyrolysis
Mass Spectrometry and Fourier Transform Infrared
Spectroscopy
Eu ADAOIN M. TIMMINS
1
, DAVID E. QUAIN
2
AND ROYSTON GOODACRE
1
*
1
Institute of Biological Sciences, University of Wales, Aberystwyth, Ceredigion SY23 3DD, Wales, U.K.
2
Bass Brewers, Technical Centre, PO Box 12, Cross Street, Burton on Trent, Staffs DE14 1XH, U.K.
Received 24 September 1997; accepted 25 February 1998
Two rapid spectroscopic approaches for whole-organism fingerprinting—pyrolysis mass spectrometry (PyMS) and
Fourier transform infrared spectroscopy (FT-IR)—were used to analyse 22 production brewery Saccharomyces
cerevisiae strains. Multivariate discriminant analysis of the spectral data was then performed to observe relationships
between the 22 isolates. Upon visual inspection of the cluster analyses, similar differentiation of the strains was
observed for both approaches. Moreover, these phenetic classifications were found to be very similar to those
previously obtained using genotypic studies of the same brewing yeasts. Both spectroscopic techniques are rapid
(typically 2 min for PyMS and 10 s for FT-IR) and were shown to be capable of the successful discrimination of both
ale and lager yeasts. We believe that these whole-organism fingerprinting methods could find application in brewery
quality control laboratories. 1998 John Wiley & Sons, Ltd.
— pyrolysis mass spectrometry; Fourier transform infrared spectroscopy; chemometrics, quality
assurance
INTRODUCTION
Within the brewing industry, pure yeast cultures
are of critical importance for product quality and
consistency. Despite the best efforts however, yeast
handling and management systems are often the
cause of cross-contamination of pitching yeast by
other production yeast strains. Also, work has
shown that brewing yeasts may undergo genetic
changes which can cause a switch in yeast floc-
culence (Oakley-Gutowski et al., 1992; Quain,
1995), or atypical fermentation performance and
beer flavour (Morrison and Sugget, 1983; Quain,
1995). Strain quality assurance then, is essential in
ensuring a consistently good quality product.
Using traditional strain QA procedures, identi-
fication and differentiation of brewing yeasts is
often very difficult. These methods, which can be
lengthy and non-reproducible, are based on prop-
erties such as flocculation, colony morphology,
sugar fermentation and resistance or sensitivity to
some antibiotics (Quain, 1986). The ideal method
to replace these labour-intensive processes would
have minimum sample preparation, would analyse
samples directly (i.e. would not require reagents),
would be rapid, automated, and (at least relatively)
inexpensive. With recent developments in ana-
lytical instrumentation, these requirements are
being fulfilled by physico-chemical spectroscopic
methods, often referred to as ‘whole-organism
fingerprinting’ (Magee, 1993). The most common
such methods are pyrolysis mass spectrometry
(PyMS; Goodacre and Kell, 1996), Fourier
transform-infrared spectroscopy (FT-IR;
Naumann et al., 1991) and UV resonance Raman
spectroscopy (Nelson et al., 1992).
PyMS and FT-IR are physico-chemical methods
which measure predominantly the bond strengths
of molecules and the vibrations of bonds within
*Correspondence to: R. Goodacre, Institute of Biological
Sciences, University of Wales, Aberystwyth, Ceredigion
SY23 3DD, Wales, U.K. Tel: (+44) 1970 621947; fax: (+44)
1970 622354; e-mail: rrg@aber. ac. uk
Contract/grant sponsor: Wellcome Trust
Contract/grant number: 042615/Z/94/Z
CCC 0749–503X/98/100885–09 $17.50
1998 John Wiley & Sons, Ltd.
functional groups respectively (Colthup et al.,
1990; Griffiths and de Haseth, 1986; Meuzelaar
et al., 1982). Therefore, they are in essence, tech-
niques which give quantitative information about
the total biochemical composition of a sample. For
taxonomic purposes they measure the phenotype
of an organism which is a ‘snap shot’ (albeit a
limited one) of its expressed genotype. This is
unlike genotypic methods of DNA fingerprinting
which can distinguish yeast strains on the basis of
DNA restriction fragment length polymorphisms
(RFLPs) or chromosome size and ploidy.
The aims of this study were to differentiate
22 brewery yeast strains by the phenotypic
approaches of PyMS and FT-IR, and to compare
these results with those from previous genotypic
investigations of the same isolates by Schofield
et al. (1995) and Wightman et al. (1996). An
additional aim was to determine if growing
the yeasts on different media types would cause
a phenotypic change which would lead to an
appreciable change in their PyMS spectra.
MATERIALS AND METHODS
Strains and cultivation
Twenty-two Bass Brewers (BB) Saccharomyces
cerevisiae strains, comprising 15 ale strains and
seven lager strains (see Table 1 for BB strain
numbers) were studied. The ale strains BB12,
BB13 and BB14 had previously been separately
isolated, on the basis of flocculation tests, from a
mixed yeast strain (Hough, 1957). Strains BB21,
BB22 and BB23 were also pure strains isolated
from a mixed strain on the basis of flocculation
tests while ale strain BB24 had been selected as a
strain with improved fermentation performance
after production trials in another brewery with
BB3.
All strains were aerobically grown in both liquid
and solid media. Liquid culturing involved grow-
ing the strains overnight at 30C in 10-ml aliquots
of static Yeast Peptone Dextrose (YPD) medium
followed by the addition of 200 l of culture to
500 ml of pre-warmed YPD and growing at 30C
(with agitation) for 72 h. For solid culturing,
the strains were grown on Sabouraud–1%
dextrose–1% maltose agar (SDMA) medium at
22C for 72 h. The biomass was then carefully
collected using sterile plastic loops and suspended
in 1-ml aliquots of sterile physiological saline
(0·9% NaCl).
Pyrolysis mass spectrometry
Five microlitres of the above yeast samples were
evenly applied to clean iron-nickel foils which had
been partially inserted into clean pyrolysis tubes.
Samples were run in triplicate. Prior to pyrolysis
the samples were oven-dried at 50C for 30 min
and the foils were then pushed into the tubes using
a stainless steel depth gauge so as to lie 10 mm
from the mouth of the tube. Viton O-rings were
next placed approximately 1 mm from the mouth
of each tube.
Pyrolysis mass spectrometry was then per-
formed on a Horizon Instrument PyMS-200X
(Horizon Instruments Ltd, Heathfield, UK). For
full operational procedures see Goodacre et al.
(1993, 1994a, b) and Timmins and Goodacre
(1997). Conditions used for each experiment
involved heating the sample to 100C for 5 s fol-
lowed by Curie-point pyrolysis at 530C for 3 s
with a temperature rise time of 0·5 s.
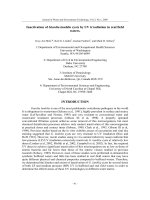
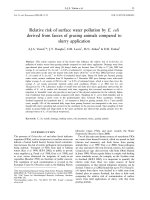
PyMS data may be displayed as quantitative
pyrolysis mass spectra (e.g., as in Figure 1). The
abscissa represents the 150 m/z ratios, while the
ordinate contains information on ion count for
Table 1. Bass Brewers (BB) strain numbers for the 22
Saccharomyces cerevisiae strains together with their
source.
Strain number Source
BB1 Ale
BB2 Ale
BB3 Ale
BB6 Lager
BB9 Lager
BB10 Lager
BB11 Lager
BB12 Ale
BB13 Ale
BB14 Ale
BB15 Ale
BB16 Ale
BB17 Lager
BB18 Ale
BB19 Ale
BB20 Ale
BB21 Ale
BB22 Ale
BB23 Ale
BB24 Ale
BB26 Lager
BB27 Lager
886 ´. .
.
1998 John Wiley & Sons, Ltd. Yeast, 14, 885–893 (1998)
any particular m/z value ranging from 51 to 200.
To remove the influence of sample size per se data
were normalized as a percentage of the total ion
count.
Diffuse reflectance-absorbance Fourier transform
infrared spectroscopy
Ten microlitres of the above yeast samples were
evenly applied onto a sand-blasted aluminium
Figure 1. Normalized pyrolysis mass spectra of S. cerevisiae ale strain BB18 and S.
cerevisiae lager strain BB27.
887
1998 John Wiley & Sons, Ltd. Yeast, 14, 885–893 (1998)
plate. Prior to analysis the samples were oven-
dried at 50C for 30 min. Samples were run in
triplicate. The FT-IR instrument used was the
Bruker IFS28 FT-IR spectrometer (Bruker
Spectrospin Ltd, Banner Lane, Coventry, UK)
equipped with a mercury-cadmium-telluride detec-
tor cooled with liquid N
2
. The aluminium plate
was then loaded onto the motorized stage of a
reflectance TLC accessory (Bouffard et al., 1994;
Goodacre et al., 1996; Timmins et al., 1997;
Winson et al., 1997).
The IBM-compatible PC used to control the
IFS28 was also programmed (using OPUS version
2.1 software running under IBM O/S2 Warp pro-
vided by the manufacturers) to collect spectra over
the wavenumber range 4000 cm
1
to 600 cm
1
.
Spectra were acquired at a rate of 20 s
1
. The
spectral resolution used was 4 cm
1
. To improve
the signal-to-noise ratio, 256 spectra were co-
added and averaged. Each sample was thus repre-
sented by a spectrum containing 882 points and
spectra were displayed in terms of absorbance as
calculated from the reflectance-absorbance spectra
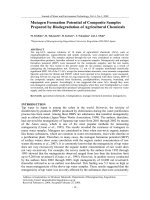
using the Opus software. Typical FT-IR spectra
are shown in Figure 2.
ASCII data were exported from the Opus soft-
ware used to control the FT-IR instrument and
imported into Matlab version 4.2c. l (The
MathWorks, Inc., 24 Prime Par Way, Natick, MA,
USA), which runs under Microsoft Windows NT
on an IBM-compatible PC. To minimize problems
arising from baseline shifts the following pro-
cedure was implemented: (i) the spectra were first
normalized so that the smallest absorbance was
set to 0 and the highest to +1 for each spectrum,
(ii) next these normalized spectra were detrended
by subtracting a linearly increasing baseline from
4000 cm
1
to 600 cm
1
, (iii) finally the smoothed
first derivative of these normalized and de-
trended spectra using the Savitzky-Golay algor-
ithm (Savitzky and Golay, 1964) using 5-point
smoothing were calculated.
Cluster analysis
The initial stage involved the reduction of
the dimensionality of the PyMS and FT-IR data
by principal components analysis (PCA; Causton,
1987; Jolliffe, 1986). PCA is a well-known
technique for reducing the dimensionality of
Figure 2. FT-IR diffuse reflectance-absorbance spectra of S. cerevisiae ale strain BB1 and S.
cerevisiae lager strain BB6.
888 ´. .
.
1998 John Wiley & Sons, Ltd. Yeast, 14, 885–893 (1998)
multivariate data whilst preserving most of the
variance, and Matlab was employed to perform
PCA according to the NIPALS algorithm (Wold,
1966). Discriminant function analysis (DFA) then
discriminated between groups on the basis of the
retained PCs and the a priori knowledge of which
spectra were replicates (MacFie et al., 1978;
Windig et al., 1983), and thus this process does not
bias the analysis in any way. DFA was pro-
grammed according to Manly’s principles (Manly,
1994). Finally, the Euclidean distance between a
priori group centres in DFA space was used to
construct a similarity measure, with the Gower
similarity coefficient S
G
(Gower, 1966), and these
distance measures were then processed by an
agglomerative clustering algorithm to construct a
dendrogram (Manly, 1994).
RESULTS AND DISCUSSION
Typical PyMS and FT-IR spectra for ale and lager
S. cerevisiae strains are shown in Figures 1 and 2
respectively. The two PyMS spectra look very
similar to each other as do the FT-IR spectra,
although, on closer inspection, small quantitative
differences may be observed. Such spectra readily
illustrate the need to employ multivariate statisti-
cal techniques in the analysis of both PyMS and
FT-IR data.
To observe any phenotypic differences caused by
cultivating on different media, 10 selected strains
(BB1, BB2, BB3, BB6, BB9, BB11, BB12, BB13
and BB14) were grown in liquid and solid media,
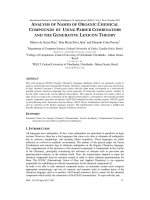
as detailed above, and subjected to PyMS. The
resulting DFA plot after cluster analyses is shown
in Figure 3. It can be seen that cultivating on
different media does indeed cause a change in their
mass spectra and the double-headed arrow in this
figure indicates that the first discriminant function
(DF1) contains information on the cultivation
method used. This is significant because DF1 is
extracted by the DFA algorithm to contain the
majority of the variance (and hence difference)
between the samples (Manly, 1994). However,
DF1 will also contain, although to a lesser extent,
information regarding machine drift since these
data were collected 70 days apart.
In addition, it can be seen (Figure 3) that the
groupings seen in the two clusters do not mirror
one another sufficiently well; indeed, in further
studies which analysed these clusters separately
(data not shown) dendrograms showed that these
10 yeasts were grouped very differently. These
Figure 3. Pseudo-3-D discriminant function (DF) analysis plot based on PyMS data
showing the comparison between 10 yeast strains grown on nutrient agar (s) and in liquid
media (l). The first three ordinates are displayed and they account for 37·4, 31·1 and 12·8%
(81·3% total) of the total variation respectively. The numbers refer to the Bass Brewers strain
number and whether ale (A) or lager (L). The double-headed arrow indicates that the first DF
contains information of whether samples were grown on solid or in liquid media.
889
1998 John Wiley & Sons, Ltd. Yeast, 14, 885–893 (1998)
results would suggest that the yeasts’ phenotypes
were different depending on the growth media and
temperature used, and this is hardly surprising
since this is a well-known problem with using
‘whole organism fingerprinting’ (Magee, 1993)
which measure the biochemistry of the sample
under investigation. Moreover, that the clustering
observed in the dendrograms from yeasts grown in
liquid culture showed more congruence with those
from DNA studies (data not shown) than dendro-
grams based on yeasts grown on solid media,
suggests that the most reliable phenotype is dis-
played when these organisms were grown in liquid
culture. Indeed, this is hardly surprising when one
considers that these brewing yeasts have been
specifically selected for their performance in batch
fermentations.
The next stage was therefore to analyse all 22
strains grown in liquid media by PyMS and
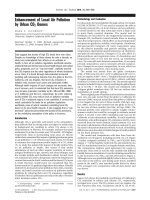
FT-IR. The dendrogram from the PyMS data
(Figure 4) shows four main clusters and a single
member cluster (SMC) comprising the ale strain
BB1 which clustered closest to cluster 1. Clusters
1 and 2 comprise a heterogeneous mixture of ale
and lager strains. The other two clusters contain
groups of closely related ale strains only; cluster
3 comprises strains BB24, BB2 and BB3 while
cluster 4 comprises BB21, BB22 and BB23. It can
also be seen from Figure 4 that the lager strains
are more similar to each other while the ale
strains are more diverse. This is to be expected
because lager yeasts represent a comparatively
homogeneous group of yeast strains (Casey,
1996; Pederson, 1983, 1985). Overall, this dendro-
gram shows good differentiation of the yeasts,
although there is no clear separation between the
ale and lager strains.
The history of some of these S. cerevisiae strains
is known. In particular, BB21, BB22 and BB23
were pure strains originally isolated from a mixed
strain on the basis of flocculation tests. It was
therefore encouraging that these were recovered
together in cluster 4. Likewise, the ale strain BB24
had been selected to have improved performance
after production trials with BB3, and both strains
were found together with the closely related BB2 in
cluster 3. Furthermore, BB12, BB13 and BB14
were originally isolated from a mixed yeast culture,
Figure 4. Dendrogram based on PyMS data showing the relationship between the 22 strains of S.
cerevisiae. The numbers refer to the Bass Brewers strain number and whether ale (A) or lager (L)
890 ´. .
.
1998 John Wiley & Sons, Ltd. Yeast, 14, 885–893 (1998)
and although these are recovered in cluster 2 it is
obvious that these can be differentiated between.
The above groups, as judged by PyMS, were
also seen in the analysis of these yeasts by FT-IR.
The DFA plot from the infrared data (Figure 5)
also shows good discrimination between the
strains, and the ale strains again show more diver-
sity than the lager strains. The seven lager yeast
were recovered in two groups; BB10 and BB26
clustered together and away from the other lager
strains BB6, BB9, BB11, BB17 and BB27. This was
encouraging because this was also seen in the
dendrogram from the PyMS spectra where the
same two groups were recovered in cluster 1 and
cluster 2 respectively (Figure 4). The DFA plot
(Figure 5) also shows BB2, BB3 and BB24 (cluster
3 from PyMS dendrogram) to be recovered
together and separately from the other yeast
strains. However, although BB21, BB22 and BB23
cluster together, unlike the PyMS analysis (cluster
4; Figure 3) they are found to group with the other
ale yeasts.
When the above results were compared to pre-
vious differentiation by DNA fingerprinting
(Schofield et al., 1995), similarities were seen
between the DNA homologies and these two phe-
notypic approaches. Schofield et al. (1995) used a
combination of restriction endonuclease HindIII
and Ty1–2 probe, and were able to differentiate
between BB1, BB2, BB3, BB6, BB9, BB10, BB11,
BB12, BB13 and BB14, although the banding
patterns were rather complex and there was no
obvious generalized pattern for either ale or lager
strains. Like both PyMS and FT-IR, this geno-
typic work showed strains BB2 and 3 to be similar.
Schofield et al. (1995) also found BB6, BB10 and
BB11 to have a very high degree of relationship as
judged by sharing DNA polymorphisms on a
RFLP gel. In contrast, these strains were easily
differentiated by PyMS and FT-IR, although,
Figures 4 and 5 both show strains BB6 and BB11
to be loosely clustered together. Schofield and
co-workers (Schofield et al., 1995) also found a
strong DNA polymorphism relationship between
strains BB12, BB13 and BB14. In these phenotypic
studies, however, these strains are clearly differen-
tiated, although Figure 4 does show them in the
same main cluster 2 while Figure 5 shows BB12
and BB14 in the same group away from BB13.
Similarities were also observed when our
results were compared to genotypic results from
Wightman et al. (1996) who differentiated between
Figure 5. Discriminant analysis biplot based on FT-IR data showing the relationship
between the 22 strains of S. cerevisiae. The numbers refer to the Bass Brewers strain number
and whether ale (A) or lager (L)
891
1998 John Wiley & Sons, Ltd. Yeast, 14, 885–893 (1998)
the strains BB3, BB6, BB9, BB10, BB11, BB12,
BB13, BB14, BB21, BB22, BB23, BB24 and BB27
by DNA fingerprinting using different restriction
enzymes and the Ty1–15 transposon probe. The
ability to differentiate readily between strains was
very dependent on the restriction enzyme used,
and no enzyme was successful in causing obvious
banding for differentiating lager strains from ale
strains. This genotypic analysis showed a relation-
ship between strains BB9 and BB27. Both PyMS
and FT-IR also show these strains to be closely
related. Finally, Wightman et al. (1996) also
showed similarities between BB12, BB13 and
BB14, and between B3 and BB24, and also
between BB21, BB22 and BB23, which were
mirrored in the present phenotypic studies.
It is clear that the application of PyMS and
FT-IR is undoubtedly useful in the discrimination
between these S. cerevisiae strains, and that these
phenetic approaches mirror the known genotype
(and brewing phenotype) of these organisms. In
practice, either of these techniques could be used in
tandem with other procedures to confirm that the
correct strain is being used by the brewery. Both
techniques have the major advantages of speed,
sensitivity and ability to analyse many hundreds of
samples per day. We therefore conclude that such
whole-organism fingerprinting methods could find
‘real time’ application in yeast strain quality assur-
ance procedures (e.g., Quain, 1995), in-process
strain tracking or troubleshooting.
ACKNOWLEDGEMENTS
We would like to thank Professor Douglas B. Kell
for use of PyMS and FT-IR. Eu .M.T. and R.G.
are indebted to the Wellcome Trust for financial
support (grant number 042615/Z/94/Z). D.E.Q. is
grateful to the Directors of Bass Brewers for
permission to publish.
REFERENCES
Bouffard, S. P., Katon, J. E., Sommer, A. J. and
Danielson, N. D. (1994). Development of microchan-
nel thin layer chromatography with infrared micro-
spectroscopic detection. Anal. Chem. 66, 1937–1940.
Casey, G. P. (1996). Practical applications of pulsed field
electrophoresis and yeast chromosome fingerprinting
of brewing QA and R&D. Technical Quarterly of the
Master Brewers Association of the Americas 33, 1–10.
Causton, D. R. (1987). A Biologist’s Advanced Math-
ematics. Allen and Unwin.
Colthup, N. B., Daly, L. H. and Wiberly, S. E. (1990).
Introduction to Infrared and Raman Spectroscopy.
Academic Press.
Goodacre, R. and Kell, D. B. (1996). Pyrolysis mass
spectrometry and its applications in biotechnology.
Curr. Opin. Biotechno. 7, 20–28.
Goodacre, R., Kell, D. B. and Bianchi, G. (1993). Rapid
assessment of the adulteration of virgin olive oils by
other seed oils using pyrolysis mass spectrometry and
artificial neural networks. J. Sci. Food Agric. 63,
297–307.
Goodacre, R., Neal, M. J. and Kell, D. B. (1994a).
Rapid and quantitative analysis of the pyrolysis mass
spectra of complex binary and tertiary mixtures using
multivariate calibration and artificial neural networks.
Anal. Chem. 66, 1070–1085.
Goodacre, R., Neal, M. J., Kell, D. B., Greenham,
L. W., Noble, W. C. and Harvey, R. G. (1994b).
Rapid identification using pyrolysis mass spec-
trometry and artificial neural networks of Propioni-
bacterium acnes isolated from dogs. J. Appl. Bacteriol.
76, 124–134.
Goodacre, R., Timmins, Eu . M., Rooney, P. J., Rowland,
J. J. and Kell, D. B. (1996). Rapid identification of
Streptococcus and Enterococcus species using diffuse
reflectance-absorbance Fourier transform infrared
spectroscopy and artificial neural networks. FEMS
Microbiol. Lett. 140, 233–239.
Gower, J. C. (1966). Some distance properties of latent
root and vector methods used in multivariate analysis.
Biometrika 53, 325–338.
Griffiths, P. R. and de Haseth, J. A. (1986). Fourier
Transform Infrared Spectrometry. John Wiley, New
York.
Hough, J. S. (1957). Characterizing the principal compo-
nents of pitching yeasts. J. Inst. Brewing 63, 483–587.
Jolliffe, I. T. (1986). Principal Component Analysis.
Springer-Verlag.
MacFie, H. J. H., Gutteridge, C. S. and Norris, J. R.
(1978). Use of canonical variates in differentiation
of bacteria by pyrolysis gas-liquid chromatography.
J. Gen. Microbiol. 104, 67–74.
Magee, J. T. (1993). Whole-organism fingerprinting. In
Goodfellow, M. and O’Donnell, A. G. (Eds), Hand-
book of New Bacterial Systematics, Academic Press,
New York, pp. 383–427.
Manly, B. F. J. (1994). Multivariate Statistical Methods:
A Primer. Chapman & Hall.
Meuzelaar, H. L. C., Haverkamp, J. and Hileman, F. D.
(1982). Pyrolysis Mass Spectrometry of Recent and
Fossil Biomaterials. Elsevier.
Morrison, K. B. and Sugget, A. (1983). Yeast handling,
petite mutants and lager. Proceedings of the European
Brewing Convention Congress. London, pp. 489–496.
Naumann, D., Helm, D., Labischinski, H. and
Giesbrecht, P. (1991). The characterization of
microorganisms by Fourier-transform infrared
892 ´. .
.
1998 John Wiley & Sons, Ltd. Yeast, 14, 885–893 (1998)
spectroscopy (FT-IR). In Nelson, W. H. (Ed.),
Modern Techniques for Rapid Microbiological
Analysis. VCH Publishers, pp. 43–96.
Nelson, W. H., Manoharan, R. and Sperry, J. F. (1992).
UV resonance Raman studies of bacteria. Appl.
Spectrosc. Rev. 27, 67–124.
Oakley-Gutowski, K. M., Hawthorne, D. B. and
Kavanagh, T. E. (1992). Applications of chromosome
fingerprinting to the differentiation of brewing yeasts.
J. Am. Soc. Brewing Chemists 50, 48–52.
Pederson, M. B. (1983). DNA sequence polymorphisms
in the genus Saccharomyces. I. Comparison of the
HIS4 and ribosomal RNA genes in lager strains, ale
strains and various species. Carlsberg Res. Commun.
48, 485–503.
Pederson, M. B. (1985). DNA sequence polymorphisms
in the genus Saccharomyces. II. Analysis of the genes
RDN1, HIS4, LEU2 and Ty transposable elements in
Carlsberg, Tuborg and 22 Bavarian brewing strains.
Carlsberg Res. Commun. 50, 263–272.
Quain, D. E. (1986). Differentiation of brewing yeast.
J. Inst. Brewing 92, 435–438.
Quain, D. E. (1995). Yeast supply—the challenge of
zero defects. Proceedings of the 25th Congress of the
European Brewery Convention. Oxford University
Press, pp. 309–318.
Savitzky, A. and Golay, M. J. E. (1964). Smoothing and
differentiation of data by simplified least squares
procedures. Anal. Chem. 36, 1627–1633.
Schofield, M. A., Rowe, S. M., Hammond, J. R. M.,
Molzahn, S. W. and Quain, D. E. (1995). Differenti-
ation of brewery yeast strains by DNA fingerprinting.
J. Inst. Brewing 101, 75–78.
Timmins, Eu . M. and Goodacre, R. (1997). Rapid quan-
titative analysis of binary mixtures of Escherichia coli
strains using pyrolysis mass spectrometry with multi-
variate calibration and artificial neural networks.
J. Appl. Microbiol. 83, 208–218.
Timmins, Eu . M., Howell, S. A., Alsberg, B. K., Noble,
W. C. and Goodacre, R. (1997). Rapid differentiation
of closely related Candida species and strains by
pyrolysis mass spectrometry and Fourier trans-
form infrared spectroscopy. J. Clin. Microbiol. 36,
367–374.
Wightman, P., Quain, D. E. and Meaden, P. G. (1996).
Analysis of production brewing strains of yeast
by DNA fingerprinting. Lett. Appl. Microbiol. 22,
90–94.
Windig, W., Haverkamp, J. and Kistemaker, P. G.
(1983). Interpretation of sets of pyrolysis mass spectra
by discriminant analysis and graphical rotation.
Anal. Chem. 55, 81–88.
Winson, M. K., Goodacre, R., Woodward, A. M., et al.
(1997). Diffuse reflectance absorbance spectroscopy
taking in chemometrics (DRASTIC). A hyperspectral
FT-IR-based approach to rapid screening for metabo-
lite overproduction. Analytica Chimica Acta 348,
273–282.
Wold, H. (1966) Estimation of principal components
and related models by iterative least squares. In
Krishnaiah, K. R. (Ed.), Multivariate Analysis.
Academic Press, New York, pp. 391–420.
893
1998 John Wiley & Sons, Ltd. Yeast, 14, 885–893 (1998)