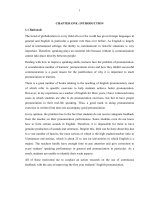
Stock repurchases as an earnings management mechanism the impact of financing constraints
Bạn đang xem bản rút gọn của tài liệu. Xem và tải ngay bản đầy đủ của tài liệu tại đây (363.76 KB, 15 trang )
Stock repurchases as an earnings management mechanism:
The impact of financing constraints
Kathleen Farrell
a,
⁎
, Emre Unlu
a
, Jin Yu
b
a
College of Business Administration, University of Nebraska—Lincoln, Lincoln, NE 68588, United States
b
Herberger Business School, Saint Cloud State University, Saint Cloud, MN 56301, United States
article info abstract
Article history:
Received 18 November 2011
Received in revised form 22 October 2013
Accepted 24 October 2013
Available online 31 October 2013
Our paper provides evidence regarding the use of share repurchases as an earnings management
mechanism in the presence of debt-financing constraints as well as the impact of these constraints
on the use of accruals and other real earnings management techniques. We document that share
repurchases are prevalent as a mechanism to increase earnings per share. Next, we show that
the presence of debt-financing constraints discourages the use of repurchase-based earnings
management. We also find that for firms more likely to be engaged in earnings management, high
financing constraints appear to increase the use of accruals based earnings management and
decrease the use of other real earnings management techniques.
© 2013 Elsevier B.V. All rights reserved.
JEL classification:
G30
M41
Keywords:
Share repurchase
Financing constraints
Earnings management
1. Introduction
Healy and Wahlen (1999) define the occurrence of earnings management as when “managers use judgment in financial reporting
and in structuring transactions to alter financial reports to either mislead some stakeholders about the underlying economic
performance of the company, or to influence contractual outcomes that depend on reported accounting numbers” (p. 368).
Motivation to manage earnings can be opportunistic or principled. Previous empirical studies show that managers are
motivated to opportunistically manage earnings in order to meet analyst expectations (Gunny, 2010; Skinner and Sloan, 2002),
avoid losses (Burgstahler and Dichev, 1997), maximize managerial compensation (Cheng and Warfield, 2005; Healy, 1985), evade
debt covenant violations (DeFond and Jiambalvo, 1994) and maximize stock price prior to security issuance (Teoh et al., 1998a,b).
However, a growing stream of empirical literature also shows that earnings management is used to signal private information to
the market. Louis and Robinson (2005) find evidence consistent with managers using discretionary accruals to signal favorable
private information in conjunction with stock splits. Linck et al. (forthcoming) analyze how firms utilize discretionary accruals to
credibly signal positive investment opportunities to the market in an effort to reduce financing constraints.
A substantial body of research also analyzes earnings management techniques utilized by managers ranging from accruals
management to real earnings management techniques such as sales discounts, relaxed credit policy, overproduction and R&D
reduction.
1
Share repurchases have also begun to attract researchers' attention as a mechanism to manage earnings. Hribar et al.
Journal of Corporate Finance 25 (2014) 1–15
⁎ Corresponding author. Tel.: +1 402 472 3005; fax: +1 402 472 5140.
E-mail addresses: (K. Farrell), (E. Unlu), (J. Yu).
1
Examples of research focusing on accruals management include Burgstahler and Dichev (1997), DeFond and Park (1997), and Dechow et al. (2003). Examples
of research focusing on real earnings management include Roychowdhury (2006) and Gunny (2010). Examples of research focusing on both types of earnings
management include Cohen et al. (2008) and Zang (2012).
0929-1199/$ – see front matter © 2013 Elsevier B.V. All rights reserved.
/>Contents lists available at ScienceDirect
Journal of Corporate Finance
journal homepage: www.elsevier.com/locate/jcorpfin
(2006), Bens et al. (2003) and Myers et al. (2007) find evidence suggesting firms use share repurchases to increase earnings per
share (EPS) in order to avoid missing analysts' EPS estimates, to meet certain EPS growth targets, or to avoid an EPS decrease,
respectively. When firms repurchase shares that increase EPS by at least one cent relative to the EPS without the repurchase, such
repurchases are called accretive repurchases.
We examine how financing constraints affect the use of accretive repurchases. Existing papers on accretive repurchases focus
on the average firm and do not examine the cross-sectional variation in the use of accretive repurchases. We expect financing
constraints to influence accretive repurchases because like other real earnings management techniques, accretive repurchases
also have a real cash flow effect. That is, accretive repurchases drain the firm's cash. We argue that firms must have either
sufficient cash flow or financial slack (i.e. financially less constrained) to finance repurchases as we would not expect individual
firms to engage in share repurchases financed by equity issues just to increase earnings per share.
We focus on financing constraints because numerous papers have shown that financing constraints are a major friction that
impacts corporate policy such as investment and capital structure (Froot et al., 1993). The novelty in this paper is we expect the
same constraints to impact a firm's behavior with regards to earnings management through share repurchase activity.
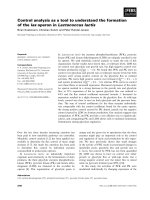
We begin our investigation by documenting the prevalence of accretive repurchases during the past two decades. We find that
the proportion of firms engaging in accretive share repurchases has increased from 9% in 1983 to almost 21% in 2011 (see Fig. 1a).
When analyzing the subset of firms that repurchase stock, we find that half (50.3%) of repurchasing firms in 2011 engaged in
accretive share repurchases compared to about 39% in 1983 (see Fig. 1b). Over the entire twenty year time period, accretive share
repurchase activity constituted, on average, over 43% of the repurchase activity. These findings suggest that accretive repurchases
are a major earnings management technique.
To analyze whether financing constraints influences the use of accretive share repurchases, we draw on Hadlock and Pierce
(2010). We begin by examining the occurrence of accretive repurchases across ten firm deciles ranked by an HP Index that measures
financing constraints (a higher index indicates greater financing constraints). We find a monotonic relation across deciles indicating
that as financing constraints decrease (lower HP index), accretive repurchases occur more frequently. Next, we estimate logit models
and confirm that lower debt-financing constraints encourage the use of accretive repurchases. More specifically, we document that
large and mature firms are more likely to engage in accretive share repurchases. We also analyze whether intertemporal variation in
financing constraints can explain intertemporal changes in aggregate accretive repurchases using the Fama and French (2001)
approach. Conditional on financing constraint proxies, we estimate the expected proportion of firms engaging in accretive
repurchases. We find that expected proportions reasonably forecast the actual proportions, implying that debt-financing constraints
have an economically meaningful influence on the use of accretive repurchases. Thus, we show that the presence of debt-financing
constraints discourages the use of repurchase-based earnings management.
We extend the analysis to determine how financing constraints impact the use of accruals and other real earnings
management techniques. Once managers decide to manage earnings, they may use share repurchases, other real earnings
management and accruals. We argue that the choice between the alternatives will be dependent upon firm characteristics and
financial constraints. We identify a sub-sample of firms that are more likely to be suspected of managing earnings. Specifically, we
identify a sample of firms that either just meet or beat a zero earnings benchmark, last year's EPS, or the mean analyst EPS
forecast. We begin by estimating normal levels of accruals and real earnings management activities through overproduction and
reduction in R&D, advertising and SG&A. Next, we perform a Heckman two-stage regression utilizing characteristics of firms
suspected of managing earnings in the first stage equation. In the second stage equations, we document a negative (positive)
relation between financing constraints and the use of repurchased based (accruals) and other real earnings management while
controlling for firm characteristics shown to influence various earnings management techniques.
As noted by Healey and Whalen (1999), to continue to inform the debate about the implications of earnings management for
standard setters, an additional understanding of what factors limit earnings management is important. Our paper is the first to
provide evidence of a direct link between the earnings management and financing constraints literature. Previous research
documents that financing constraints influence firm behavior and firm value. Denis and Sibilkov (2010) find that greater cash
holdings of financially constrained firms are value enhancing due to the increased cost of external financing. Li (2011) finds a
strong interaction effect between financing constraints and R&D investment on expected returns. Specifically, he finds that the
positive R&D and return relation only exists among highly financially constrained firms. Edwards et al. (2013) find firms facing
financial constraints exhibit lower cash effective tax rates suggesting that financial constraints impact a firm's tax avoidance
strategies. Extending this literature, we find that financially constrained firms are less likely to utilize share repurchases to
manage EPS. More generally, when firms manage earnings, financing constraints is a major determinant of accretive repurchases
as well as other types of accruals and real earnings management techniques.
The remainder of the paper is organized as follows: Section 2 describes the sample and the associated statistics. Section 3
includes a discussion of the empirical results and Section 4 concludes.
2. Sample selection and variables
2.1. Sample selection
We draw da ta from various sources. Financial accounting information is from COMPUSTAT annual files. Stock market
related information is from COMPUSTAT and CRSP monthly security files. Analyst earnings forecasts are from I/B/E/S summary
files.
2 K. Farrell et al. / Journal of Corporate Finance 25 (2014) 1–15
We construct two samples for our analyses. Our main sample is a comprehensive sample of 94,382 firm-year observations for
the 1983–2011 period. We use this sample to examine the impact of financing constraints on the decision to engage in accretive
repurchases. The second sample (suspect-firms sample) consists of 5414 firm-year observations that are suspected of managing
earnings. The empirical advantage of this sample is concentration of firms that are likely managing their earnings. We use this
sample to examine how financing constraints affect all forms of earnings management (i.e. accruals, accretive repurchases, and
other forms of real earnings management).
We begin constructing our sample by selecting all of the publicly traded US firms in COMPUSTAT annual database. We exclude
regulated firms such as utilities and financial institutions (SIC 4900–4999 and 6000–6999) from the sample. We begin the sample
period in 1983 when Rule 10b-18, the safe harbor rule, was passed. After 1983, firms had a meaningful choice of making a
repurchase without risking prosecution under the Securities Act of 1934. After requiring observations to have all the dependent
and independent variables employed in the various model specifications, we get a sample of 94,382 firm-year observations
representing 12,504 unique firms, respectively, from 1983 to 2011.
Our suspect-firm sample is generated by imposing additional filters on the main sample. First, we require that a firm-year
observation needs to meet or just beat a zero-earnings benchmark, last year's EPS, or analyst expectations. Second, we begin the
sample period in 1987 due to the availability of certain cash-flow items that are necessary to compute accruals. Our final sample
contains 5414 firm year observations from 1987 to 2011.
2.2. Main variables descriptions
In this section, we broadly discuss the main variables of interest used in the paper. Computational details of each variable are
provided in the Appendix A.
2.2.1. Repurchase-based earnings management (A_REP
t
)
To identify firms engaging in earnings management through repurchases, we follow Hribar et al. (2006) method of identifying
accretive share repurchases. A share repurchase is defined as an accretive share repurchase if a firm's EPS with the repurchase is
greater by at least one cent than EPS assuming no buybacks. Specifically A_REP
t
is equal to one when EPS with buyback exceeds
the as-if EPS by at least one cent had there been no buyback.
2.2.2. Proxies for financing constraints
Following Hadlock and Pierce (2010), we use firm size and age to measure financing constraints. Hadlock and Pierce (2010)
confirm that firm size and age are negatively related to financing constraints and also show that firm size and age are highly
reliable predictors of financing constraints. An advantage to using firm size and age to proxy financing constraints is that they are
less likely to be endogenous relative to alternative measures (i.e. KZ Index) based on major firm policy variables such as cash
holdings, payout, leverage, and investment. Hadlock and Pierce (2010) show that financing constraint proxies based on firm
policies (i.e. dividend, liquidity) result in unreliable loadings.
2
They also show that the only other variables that consistently
predict constraints after controlling for size and age are leverage and cash flows. However, given the endogenous nature of these
variables, Hadlock and Pierce do not recommend any measure of financial constraints derived from models that use these
variables.
We measure size (LOGSIZE) as the natural logarithm of inflation adjusted book value of assets in 2006 dollars. Age (AGE)is
defined as the number of years between the observation year and the first year that the firm appears on COMPUSTAT with a
non-missing stock price. Hadlock and Pierce (2010) also note that introducing a non-linear term for size improves the
explanatory power of proxies for financing constraints. Therefore, we add firm size squared (LOGSIZE2) and use firm size,
firm-size-squared and age as an alternative set of financing constraint proxies in our analyses. We also estimate the Hadlock and
Pierce Index (HP_INDEX) calculated as − 0.737 ∗ LOGSIZE
t − 1
+ 0.043 ∗ LOGSIZE2
t − 1
− 0.04 ∗ AGE
t − 1
.
2.2.3. Additional control variables
Following prior literature (Dittmar, 2000; Jagannathan et al., 2000), we control for various firms characteristics that might
impact the likelihood of firms engaging in share repurchases including leverage, cash flow, cash, prior stock performance, and the
market-to-book ratio. For example, Dittmar (2000) documents a positive relation between both cash and cash flow and the
likelihood of share repurchases, both consistent with firms repurchasing stock to distribute excess cash flows. In addition, as
previously noted, cash, cash flow, and leverage have been shown to be associated with financial constraints (Hadlock and Pierce,
2010). Dittmar (2000) also shows that firms with lower valued securities, proxied by a history of low returns, are more likely to
repurchases shares.
We define leverage (LEV
t − 1
) as the one-year lagged value of long-term debt deflated by total assets at the beginning of the year.
Cash flow (CF
t − 1
) is defined as one-year lagged value of operating income plus depreciation deflated by total assets. CASH
t − 1
is
the one-year lagged value of cash and cash equivalents scaled by total assets. Prior stock performance (EXCESS_RET
t − 1
) is defined as
the one-year lagged stock return in excess of the CRSP value weighted market return. We measure market-to-book (MTB
t − 1
)asthe
2
We replicate our analyses using KZ index as a proxy for financial constraint status and obtain similar results.
3K. Farrell et al. / Journal of Corporate Finance 25 (2014) 1–15
one-year lagged market-to-book ratio calculated as the market value of equity plus book value of assets minus book value of
stockholders' equity minus balance sheet deferred taxes scaled by the book value of assets.
Table 1 presents descriptive statistics and industry distribution for the main sample. Panel A reports the number of
observations, means, medians, standard deviations, and variable values at the 5th, 25th, and 75th percentiles for the variables
utilized in our analysis of financial constraints and accretive repurchases discussed above. We find considerable variation for our
variables and to eliminate the effect of outliers, we winsorize all of the variables at 1% except for the dummy variables and
variables that are winsorized by construction. The mean value for A_REP
t
is 14.21%, suggesting that accretive stock repurchases
occur, on average, 14.21% of the time. This finding is comparable to Hribar et al. (2006) who document 17.6% based on their
sample period from 1988 to 2001. The mean value for LOGSIZE
t − 1
and LOGSIZE2
t − 1
are 4.6347 and 26.9310 respectively. The
average firm age is 13.19 years and the average HP_INDEX
t − 1
is − 2.7722. The mean leverage (LEV
t − 1
), cash-flow (CF
t − 1
), cash
holdings (CASH
t − 1
), excess returns (EXCESS_RET
t − 1
) and market-to-book (MTB
t − 1
) are 28.19%, − 13.60%, 17.70%, 2.88%, and
2.7565, respectively. Variables appear to have expected distributional properties.
Panel B of Table 1 presents the number of observations in each industry group based on 1-digit SIC. As expected, the
manufacturing industry (1-digit SIC = 2 and 3) represents more than half of the sample. The wholesale/retail (SIC = 5) and arts,
recreations and technical services industries (SIC = 7) have representation greater than 10,000 firm-year observations. The
agriculture industry (SIC = 0) has the smallest representation in our sample with 468 firm-year observations.
2.2.4. Proxy variables for accruals and real earnings management activity
To identify firms engaging in earnings management through accruals, we employ the Jones (1991) model, where total accruals
are decomposed into discretionary and non-discretionary (normal level) accruals by using the following regression model:
TACC
t
TA
t‐1
¼ α
0
þ
1
TA
t‐1
þ α
1
ΔS
t
TA
t‐1
þ α
2
PPE
t
TA
t−1
þ ε
t
ð1Þ
Table 1
Summary statistics. This table reports the summary statistics for the variables used in the analyses and the industry breakdown of the sample based on 1-digit SIC.
A_REP
t
is equal to 1 if repurchase results in an increase in earnings, otherwise 0. LOGSIZE
t − 1
is one-year lagged value of inflation adjusted book value of assets in
2006 dollars (in logs) winsorized at $4.5 billion. LOGSIZE2
t − 1
is LOGSIZE
t − 1
squared. AGE
t − 1
is one-year lagged value of firm's age defined as the number of
years between the observation year and the first year that the firm appears on COMPUSTAT with a non-missing stock price or assets (winsorized at 37 years).
HP_INDEX
t − 1
is one-year lagged aggregated Hadlock and Pierce Index calculated as − 0.737 ∗ LOGSIZE
t − 1
+ 0.043 ∗ LOGSIZE2
t − 1
− 0.04 ∗ AGE
t − 1
. LEV
t − 1
is
one-year lagged value of long-term debt deflated by total assets. CF
t − 1
is one-year lagged cash flow defined as operating income plus depreciation
deflated by total assets . CAS H
t − 1
is one-year lagged value of cash and cash equivalents scaled by total assets. EXCESS_RET
t − 1
is one-year lagged stock
return in excess of th e CRSP value weighted market return. MTB
t − 1
is one-year lagged market-to-book ratio calculated as the market value of equity plus
book value of assets minus book value of common equity minus balance sheet d efer red taxes sca led by the book value of asse ts. Samp le period is from
1983 to 2011 and the sample excludes financials (SIC between 6000 and 6999) and utilities (SIC between 4900 and 4999). Variables are winsorized at 1%
(except for dumm y variables and variables tha t are winsorized by construction). Appendix A provides a detailed description of the COMPUSTAT items
used in variable construction.
Panel A: Summary statistics
Variables N Mean Median Std Min 25% 75% Max
A_REP
t
94,382 0.1421 0.0000 0.3491 0.0000 0.0000 0.0000 1.0000
LOGSIZE
t − 1
94,382 4.6347 4.6981 2.3346 − 6.9078 3.1169 6.3193 8.4118
LOGSIZE2
t − 1
94,382 26.9310 22.1886 20.6293 0.0000 9.9383 39.9799 70.7589
AGE
t − 1
94,382 13.1901 10.0000 10.0402 0.0000 5.0000 20.0000 37.0000
HP_INDEX
t − 1
94,382 − 2.7722 −2.8797 1.0505 − 4.6369 − 3.4626 − 2.1950 0.8452
LEV
t − 1
94,382 0.2819 0.2001 0.3947 0.0000 0.0361 0.3787 2.9811
CF
t − 1
94,382 − 0.1360 0.0620 0.8124 − 6.2830 − 0.0466 0.1143 0.3375
CASH
t − 1
94,382 0.1770 0.0841 0.2179 0.0000 0.0233 0.2477 0.9347
EXCESS_RET
t − 1
94,382 0.0288 −0.1283 0.8345 − 1.0439 − 0.4258 0.2077 4.7203
MTB
t − 1
94,382 2.7565 1.3955 5.4484 0.5183 1.0277 2.2534 44.6719
Panel B: Industry breakdown
1-digit SIC Industry definition N
0 Agriculture 468
1 Mining, oil and const. 7432
2 Food, beverage and chemicals 17,120
3 Plastics, computer and machinery 32,092
4 Transportation 5491
5 Wholesale and retail 11,322
7 Arts, recreations, technical services 14,126
8 Healthcare, professional, social assistance and education services 4575
9 Public administration services 1756
Total 94,382
4 K. Farrell et al. / Journal of Corporate Finance 25 (2014) 1–15
TACC
t
is total accruals, which is computed as income before extraordinary items minus operating cash flows in period t. TA
t − 1
is
total assets at the beginning of the year. Δ S
t
is defined as change in sales from period t − 1 to period t. PPE
t
is the gross property,
plant, and equipment at the end of the year.
Overproduction is a form of real earnings management and refers to the concept that firms produce more goods than
necessary to report lower cost of goods sold. High production levels lead to lower fixed overhead costs per unit. As a
result, the cost of goods sold repor ted on firms' fin ancial st atements will be low and earni ngs c an be biased upwards. The
consequence of the overproduction is an abnormally high level of production costs relative to sales. Following
Roychowdhury (2006) and Cohen et al. (2008), we estimate the normal level of producti on costs using the follow ing
model:
PROD
t
TA
t‐ 1
¼ α
0
þ α
1
1
TA
t‐ 1
þ α
2
S
t
TA
t‐ 1
þ α
3
ΔS
t
TA
t‐ 1
þ α
4
ΔS
t‐ 1
TA
t‐ 1
þ ε
t
ð2Þ
PROD
t
is the sum of costs of goods sold during period t and the change in inventories from period t − 1 to period t. S
t
is the sales
during period t and ΔS
t − 1
is the change in sales from period t − 2 to period t − 1.
Reducing R&D and advertising expenses is another channel to manage earnings through real activities which will result in
abnormally low R&D and/or advertising expense. Following Roychowdhury (2006), we estimate the normal level of discretionary
expenditures using the following model:
DISCX
EX
P
t
TA
t−1
¼ α
0
þ α
1
1
TA
t‐1
þ α
2
S
t−1
TA
t‐1
þ ε
t
ð3Þ
Discretionary expenditures (DISC_EXP
t
) is the sum o f discretionary expenditures (R&D, advertising and SG&A) during
period t. Missing R&D a nd advertising fields are set to zero if the SG&A data item is available. S
t − 1
is the sales during period
t − 1.
Each of the three model s abov e i s estimat ed an nually for each industry based on Fama and French (1997). Following
Roychowdhury (2006), we require at least 15 observations for e ach industry-year group. The accrual-based earnings
management proxy, AB_ACC, is discretionary accruals defi ned as the residuals from the regression estimations for Model
(1). The real earnings management proxy, RM
t
is the sum of residuals from Model (2) and the negat ive of residuals fro m
Model (3). Appendix A provides a detailed description of the COMPUSTAT items used in variable construction . Estimat ion
results for earnings management proxies are reported in Table 5 and we defer the discussion of these findings to
Section 3.3.
2.2.5. Defining firms suspected of earnings management
After estimating accrual-based and real earnings management activity, we further identify suspect firms that are more likely to
be engaged in earnings management. Following Zang (2012) and Roychowdhury (2006), we classify a firm-year observation as a
suspect firm if any of the following conditions are met: (1) if the firm just meets or beats a zero earnings benchmark (if
0 ≤ ROA
t
≤ 0.5%) and/or (2) if the firm just meets or beats last year's earnings per share (if 0 ≤ EPS
t
− EPS
t − 1
≤ $0.02) and/or
(3) if the firm just meets or beats the mean analyst EPS forecasts (if 0 ≤ EPS
t
—Consensus
t
≤ $0.01). Based on this classification
scheme, we identify 5414 firm-year observations.
We compare the two distinguishing characteristics of suspect firms (habitual earnings management and analyst coverage) to
the rest of the COMPUSTAT universe. Prior research suggests that firms that consistently beat or meet earnings targets have a
greater incentive to continue to do so (Bartov et al., 2002). We define HABIT
t
as the number of times the firm meets/beats the
quarterly analyst earnings consensus. Also, some argue that firms with higher analyst coverage are under greater pressure to beat
or meet earnings targets so we define LOGANALYST
t
as the logarithmic transformation—defined as log (1 + x) for variable x—of
the number of analysts covering the firm before the earnings release date.
2.2.6. Additional control variables for firms suspected of managing earnings
Given our intent to also an alyze the impact of financial con straints on other earnings management techniques, we also
identify a set of varia bles associated with the c ost of earnings management through acc ruals and real earnings managemen t
(Zang, 2012). BIG8
t − 1
which is a dummy variab le that equals one if the firm's auditor is one of the leading eight auditing
firms that are currently Big 4 auditing firms due to mergers or ban kruptcies, otherwise equals zero. AUDITOR_AGE
t − 1
is a
one-year lagged dummy variable that equals one if the firm is audited by its curren t auditor more tha n 4 years (sample
median), otherwise zero. SOX_DUM
t
is a dummy variable tha t equals one if the firm-year observation occurs after 2003,
otherwise zero . NOA
t − 1
is a one-year lagged dummy variable that equals one if the value of net operating assets exceeds the
average of the firm's Fama and Fre nch (1997) industry. OPCYCLE
t − 1
is the one-year lagged value of the firm's cash cycle.
5K. Farrell et al. / Journal of Corporate Finance 25 (2014) 1–15
MKTSHARE
t − 1
is the proportion of the firm's sales to total sales of the firm's Fama and French (1997) industry. ZSCORE
t − 1
is
the one-year lagged value of the firm's Z-sc ore. MTR
t − 1
is the one-year lagged value of the firm' s marginal tax rate before
interest rate deductions from Blouin et al. (2010).
3. Results
3.1. Prevalence of repurchase-based earnings management
We analyze aggregate repurchase-based earning s management by analyzing the proportion of all firms that engage in
accretive repurchases during our sample period of 1983 to 2011. Fig. 1 illustrates that share repurchases have become
more prev alent as a me chanism to manage report ed earnings. Specifically, the proportion of firms engaging in accretive
share repurchases has increased from 9% in 1983 to almost 21% in 2011 (Fig. 1a). Analyzing only firms that repurchase
shares, we find that half (50.3%) of repurchasing firms in 2011 engage in accretive share re purchases compared to about
39% in 1983 (Fig. 1b). Fig. 1 supports the notion that accretive share repurchases are a common form of earnings
management.
0%
5%
10%
15%
20%
25%
1983
1984
1985
1986
1987
1988
1989
1990
1991
1992
1993
1994
1995
1996
1997
1998
1999
2000
2001
2002
2003
2004
2005
2006
2007
2008
2009
2010
2011
Year
Proportion of accretive repurchases
0%
10%
20%
30%
40%
50%
60%
1983
1984
1985
1986
1987
1988
1989
1990
1991
1992
1993
1994
1995
1996
1997
1998
1999
2000
2001
2002
2003
2004
2005
2006
2007
2008
2009
2010
2011
b)
a)
Year
Proportion of accretive repurchases
Fig. 1. Aggregate repurchase-based earnings management. a) shows the proportion of firms that engage in accretive repurchases among all firms and b) shows
the proportion of firms that engage in accretive repurchases among firms that repurchases shares.
6 K. Farrell et al. / Journal of Corporate Finance 25 (2014) 1–15
3.2. The impact of financing constraints on repurchase-based earnings management
We hypothesize that firms that are more financially constrained are less likely to engage in accretive repurchases because
these firms have insufficient internal or debt-based funds to finance the repurchase. To test this prediction in a univariate setting,
we sort firms into deciles based on the HP Index and compare accretive repurchase propensities among deciles. We sort firms
both unconditionally, once across years, and alternatively, every year to form annual deciles. We report our findings in Table 2.
We find strong evidence that firms with the least financial constraints (lowest HP Index) engage in a much higher level of
accretive share repurchases. For example, based on unconditional (conditional) sorting of firms across deciles, Panel A (B) in
Table 2 shows that the proportion of firms engaging in accretive share repurchases is 33.3% (33.1%) while only 1.7% (1.9%) of firms
facing the highest financial constraints engage in accretive share repurchases. These findings are statistically significant
(p-value = 0.000). Moreover, the relation between financing constraints and accretive repurchase propensity appears to be
monotonic independent of the sorting method.
We also examine the relation between accretive repurchase likelihood and debt financing constraints in a multivariate logit
setting. We specify the following five logit models and report the estimation results in Table 3.
logit Prob AX
RE
P
t
¼ 1fg½¼α
1
þ α
2
LOGSIZE
t−1
þ ε ð4Þ
logit Prob AX
RE
P
t
¼ 1fg½¼α
1
þ α
2
LOGSIZE
t−1
þ α
3
AGE
t−1
þ ε ð5Þ
logit Prob AX
RE
P
t
¼ 1
fg
½¼α
1
þ α
2
LOGSIZE
t−1
þ α
3
LOGSIZE2
t−1
þ α
4
AGE
t−1
þ ε ð6Þ
logit Prob AX
RE
P
t
¼ 1
fg
½¼α
1
þ α
5
HPX
INDE
X
t−1
þ ε ð7Þ
logit Prob AX
RE
P
t
¼ 1
fg
½¼α
1
þ α
5
HPX
INDE
X
t−1
þ α
6
LEV
t−1
þ α
7
CF
t−1
þ α
8
CASH
t
þ α
9
EXCESSX
RE
T
t−1
þα
10
MTB
t−1
þ industry and year effects þ ε
ð8Þ
where logit[.] is the logit probability transformation function. We asses statistical significance based on heteroskedasticity and
autocorrelation robust firm-level clustered errors (Roger, 1993).
Specifications (4), (5) and (6) test the relation between individual components of the HP Index and the accretive repurchase
likelihood. Specification (7) is based on the aggregate HP Index and specification (8) controls for additional variables that are
likely to influence repurchases including leverage, cash flows, cash, excess returns, and the market to book ratio.
Based on the results reported in Table 3, we continue to find strong evidence that financing constraints inhibit the firm's ability
to engage in accretive repurchases. In models (1), (2), and (3) of Table 3, we find that individual components of the HP Index are
expectedly related to the accretive repurchase likelihood. More specifically, while size (LOGSIZE
t − 1
)andage(AGE
t − 1
)are
positively and statistically s ignificantly (p-value = 0.000) related to the likelihood of accretiv e repurchases, size-squa red
Table 2
Financial constraints and accretive repurchases univariate analyses. This table presents the proportion of firms that engage in accretive repurchases for
rank deciles based on financing constraints measured as HP_INDEX
t − 1
. In Panel A, sample observations are sorted unconditionally once across years. In
Panel B, sample observations are sorted every year to form deciles. HP_INDEX
t − 1
is one-year lagged aggregated Hadlock and Pierce Index calculated as
− 0.737 ∗ LOG SI Z E
t − 1
+0.043∗ LOGSIZE2
t − 1
− 0.04 ∗ AGE
t − 1
. LOGSIZE
t − 1
is one-year lagged value of inflation adjusted book value of assets in 2006
dollars (in logs) winsorized at $4.5 billion. LOGSIZE2
t − 1
is LOGSIZE
t − 1
squared. AGE
t − 1
is one-year lagged value of firm's age defined as the number o f
years between t he o bserva tion ye ar and the first year that the firm appears on CO MPUSTAT with a non-missing s tock price or assets ( winsorized at
37 years). Sample period is from 1983 to 2011 and the sample excludes financials (SIC between 6000 and 6999) and utilities (SIC between 4900 and
4999). Appendix A provides a detailed description of the COMPUSTAT items used in variable construction.
HP_INDEX
t − 1
deciles
1
(least constrained)
2345678910
(most constrained)
p-Value
[1]–[10]
Panel A: Unconditional sorting
Proportion of accretive
repurchases (%)
33.3% 23.6% 21.4% 17.5% 13.9% 11.1% 8.7% 6.6% 4.2% 1.7% 0.000
Total number of firms 9438 9438 9438 9439 9438 9438 9439 9438 9438 9438
Panel B: Conditional sorting
Proportion of accretive
repurchases (%)
33.1% 22.8% 21.3% 18.0% 14.4% 11.2% 9.0% 6.4% 3.9% 1.9% 0.000
Total number of firms 9425 9439 9448 9434 9438 9445 9442 9440 9444 9427
7K. Farrell et al. / Journal of Corporate Finance 25 (2014) 1–15
(LOGSIZE2
t − 1
) is negatively and significantly related (p-value = 0.000). These findin gs are consistent with Hadlock and
Pierce (2010). Utilizing the HP Index in m odel specifications (4) and (5) of Table 3, we similarly find a negative and
significant relation between the likelihood of accretive share repurchases and our proxy for financial constraints while controlling
for other factors that have been shown to influence share repurchase activity. All results are statistically significant at the 1% level. We
also rerun the regression specification shown in model (5) of Table 3 for the subset of firms that engage in share repurchases and find
similar results.
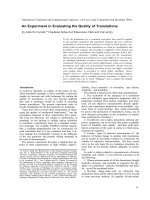
We evaluate the economic significance of our findings using the coefficient estimates in model (5) of Table 3 and report our
findings in Fig. 2. Specifically, we predict the probability of engaging in accretive repurchases for five levels of HP_INDEX evaluated
at the 1st, 25th, 50th, 75th and 99th percentiles. Sample medians are used for the remaining variables. Industry and year effects
are evaluated for the largest industry group (SIC = 3) and for year 2011.
As shown in Fig. 2, when HP_INDEX moves from the 75% to the 25% percentile, the predicted probability of engaging in
accretive repurchases increases almost three fold from 6.1% to 17.2%. A drastic move from the 1st percentile to 99th percentile
implies a change from 0.4% to 37.6%. Given the predicted accretive repurchase probability of 10.9% when evaluated for the median
HP_INDEX, we conclude that the presence of financing constraints discourages the use of repurchase-based earnings management
in an economically meaningful way.
3.2.1. Can variation in debt financing constraints explain aggregate repurchase-based earnings management patterns?
Noting the variation in the use of accretive share repurchases over time as illustrated in Fig. 1, we next i nvestigate to w hat
extent intertemporal va riation in financing constraints can explain intertemporal changes in aggregate accretive repurchases.
We use the same method used in Fama and French (2001), where intertemporal variation in dividend payme nt likelihoods are
reconcile d to intertemporal variation in certain firm characteristics.
Table 3
Financial constraints and accretive repurchases multivariate analyses. This table examines the effect of debt constraints on the likelihood of repurchase-based
earnings management based on a logit model. A_REP
t
equals 1 for accretive share repurchases; 0 otherwise. LOGSIZE
t − 1
is one-year lagged value of inflation
adjusted book value of assets in 2006 dollars (in logs) winsorized at $4.5 billion. LOGSIZE2
t − 1
is LOGSIZE
t − 1
squared. AGE
t − 1
is one-year lagged value of firm's
age defined as the number of years between the observation year and the first year that the firm appears on COMPUSTAT with a non-missing stock price or assets
(winsorized at 37 years). HP_INDEX
t − 1
is one-year lagged aggregated Hadlock and Pierce Index calculated as − 0.737 ∗ LOGSIZE
t − 1
+ 0.043 ∗ LOGSIZE2
t − 1
−
0.04 ∗ AGE
t − 1
. LEV
t − 1
is one-year lagged value of long-term debt deflated by the total assets. CF
t − 1
is one-year lagged cash flow defined as operating income
plus depreciation deflated by total assets. CASH
t − 1
is one-year lagged value of cash and cash equivalents scaled by total assets. EXCESS_RET
t − 1
is one-year lagged
stock return in excess of the CRSP value weighted market return. MTB
t − 1
is one-year lagged market-to-book ratio calculated as the market value of equity plus
book value of assets minus book value of common equity minus deferred taxes scaled by the book value of assets. p-values are reported in parentheses and based
on firm-level clustered standard errors.
⁎⁎⁎
,
⁎⁎
, and
⁎
indicate statistical significance at 1%, 5%, and 10% levels, respectively. Sample period is from 1983 to 2011
and the sample excludes financials (SIC between 6000 and 6999) and utilities (SIC between 4900 and 4999). Variables are winsorized at 1% (except for dummy
variables and variables that are winsorized by construction). Appendix A provides a detailed description of the COMPUSTAT items used in variable construction.
Independent variables Dependent variable: A_REP
t
(1) (2) (3) (4) (5)
Intercept −3.9215*** − 3.9232*** − 4.443*** − 4.5777*** − 4.6335***
(0.000) (0.000) (0.000) (0.000) (0.000)
LOGSIZE
t − 1
0.4007*** 0.3635*** 0.579***
(0.000) (0.000) (0.000)
LOGSIZE2
t − 1
− 0.0203***
(0.000)
AGE
t − 1
0.0145*** 0.0161***
(0.000) (0.000)
HP_INDEX
t − 1
− 0.9041*** − 0.9089***
(0.000) (0.000)
LEV
t − 1
− 1.1726***
(0.000)
CF
t − 1
1.0501***
(0.000)
CASH
t − 1
0.343***
(0.000)
EXCESS_RET
t − 1
− 0.1015***
(0.000)
MTB
t − 1
0.0563***
(0.000)
N 94,382 94,382 94,382 94,382 94,382
Chi-square statistic (H
0
: Beta = 0) 6499.88 7049.30 7611.49 7042.62 8475.79
p-value for Chi-square statistic 0.0000 0.0000 0.0000 0.0000 0.0000
Industry and year dummies No No No No Yes
Pseudo-R
2
9.48% 9.77% 9.87% 9.13% 10.99%
8 K. Farrell et al. / Journal of Corporate Finance 25 (2014) 1–15
We start by annually estimating the logit model shown as Models (2), (3) and (4) in Table 3 for years 1983 through 1990. Then
we find the average of estimated coefficients for the intercept, size, size-squared and age shown in Panel A of Table 4.
3
Next, based
on these coefficients, we compute the predicted probabilities of engaging in accretive repurchases for all the firm-year
observations using each observation's size (size-squared) and age.
4
Annual averages of predicted probabilities yield the expected
proportion of firms engaging in accretive repurchases. The difference between actual and expected proportions is defined as the
propensity to engage in accretive repurchases. Our forecasting period starts in year 1991 to ensure that propensity scores are
out-of-sample forecasts.
Panel B of Table 4 repo rts our analysis in detail. Propensit y scor e analysis reveals two noteworthy re sults. First, annual
propensity scores appear to oscillate around zero indicat ing that the expected proportions are related to actual proportions.
Most importantly, the time-series averages of propensity scores are stati stically insignificant and less than 0.26%, sufficiently
smaller than the size of the time-series average of actual proportions (14.1%). Second, two subperiods (1997–2000 and
2006–2008) exhibit periods where actual accretive repurchase activity appears substantially higher than the predicted
levels. Both subpe riods are associat ed with per iods that may be charac terized by overvaluation. Jensen (2005) argues that
managers may have the incentive t o inflate performance to support overvalued e quity. C onsistent with Jensen' s p rediction,
Chi and Gupta (2009) find that as firms become more overvalued, they subsequently increase their use of income increasing
discretionary accruals. Simi larly, we would expect f irms to increase their use of accret ive sh are repurchases as firms are more
likely to face less financial constrai nts unde r the scenario of having ov ervalued securities. The evidence t hat fir ms tend to
3
When coefficients are based on a pooled estimation, we find virtually the same results.
4
In a logit setting the predicted probability of the dependent variable being 1 is computed as follows:
p ¼
exp
βx
1 þ exp
βx
where β is the coefficient vector of the estimated logit model. Using the coefficients based on Fama–MacBeth estimation of models 2, 3 and 4 shown in Panel A of
Table 4, we compute the predicted probability (p
i,t
) of engaging in accretive repurchase for the ith firm in year t as:
p
i;t
¼
exp
−3:5470þ0:2649ÂLOGSIZE
i;t−1
þ0:00262ÂAGE
i;t−1
1 þ exp
−3:5470þ0:2649ÂLOGSIZE
i;t−1
þ0:00262ÂAGE
i;t−1
p
i;t
¼
exp
−4:3614þ0:6120ÂLOGSIZE
i;t−1
−0:0331ÂLOGSIZE2
i;t−1
þ0:0282ÂAGE
i;t−1
1 þ exp
−4:3614þ0:6120ÂLOGSIZE
i;t−1
−0:0331ÂLOGSIZE2
i;t−1
þ0:0282ÂAGE
i;t−1
p
i;t
¼
exp
−4:4018−0:8512ÂHP
INDE
X
i;t−1
1 þ exp
−4:4018−0:8512ÂHP
INDE
X
i;t−1
37.6%
17.2%
10.9%
6.1%
0.4%
-4.6369 -3.4626 -2.8797 -2.195 0.8452
Probability
HP_INDEX
(Evaluated at sample min, 25%, 50%, 75% and max)
Fig. 2. Evaluation of economic significance. This figure shows predicted probabilities of engaging in accretive repurchase for five levels of HP_INDEX (minimum,
25%, 50%, 75% and maximum). Probabilities are based on the coefficient estimates from Model 5 of Table 3 as shown below:
logit Prob AX
RE
P
t
¼ 1
fg
½¼−4:6335−0:9089HPX
INDE
X
t−1
−1:1726LEV
t−1
þ 1:0501CF
t−1
þ0:3430CASH
t−1
−0:1015EXCESSX
RE
T
t−1
þ 0:0563 þ MTB
t−1
−0:0378
Other variables are evaluated at their sample means. Industry and year fixed effects are evaluated for the most frequent industry group (SIC = 3) and year 2011.
A_REP
t
is equal to 1 if repurchase results in an increase in earnings per share, otherwise 0. HP_INDEX
t − 1
is one-year lagged aggregated Hadlock and Pierce Index
calculated as − 0.737 ∗ LOGSIZE
t − 1
+ 0.043 ∗ LOGSIZE2
t − 1
− 0.04 ∗ AGE
t − 1
. LOGSIZE
t − 1
is one-year lagged value of inflation adjusted book value of assets in
2006 dollars (in logs) winsorized at $4.5 billion. LOGSIZE2
t − 1
is LOGSIZE
t − 1
squared. AGE
t − 1
is one-year lagged value of firm's age defined as the number of
years between the observation year and the first year that the firm appears on COMPUSTAT with a non-missing stock price or assets (winsorized at 37 years).
LEV
t − 1
one-year lagged value of long-term debt deflated by total assets. CF
t − 1
is one-year lagged cash flow defined as operating income plus depreciation
deflated by total assets. CASH
t − 1
is one year lagged value of cash and cash equivalents scaled by total assets. EXCESS_RET
t − 1
is one-year lagged stock return in
excess of the CRSP value weighted market return. MTB
t − 1
is one-year lagged market-to-book ratio calculated as the market value of equity plus book value of
assets minus book value of common equity minus balance sheet deferred taxes scaled by the book value of assets. Appendix A provides a detailed description of
the COMPUSTAT items used in variable construction.
9K. Farrell et al. / Journal of Corporate Finance 25 (2014) 1–15
engage in accretive sh are repurchases during the periods of market overvaluation is consistent with the notion in Bartov et al.
(2002) that managers engage in earnings managem ent at the expense of share holders. In the secon d subperiod, Co hen et al.
(2008) show that discretionar y accruals decline subst antially after the passage of SOX but the decli ne is particularly lar ge
from 2004 to 2005 (see Cohen, et. al. Fig. 2, p. 772). This decline in accrual management due to potential regulatory
constraints may be offset by the u se of real e arnings management but a lso the increased u se of repurchased based earnings
management.
Overall, we show that intertemporal variation in aggregate accretive repurchases can be reasonably forecasted by financing
constraint proxies. We also show that aggregate accretive repurchases tend to be unexpectedly positive when managers have
strong incentives to manage earnings.
3.3. Analysis of accretive repurchases, accruals, and real earnings management
Given our focus on understanding what factors limit earnings management, we also expand our analysis of financing
constraints on share repurchases to encompass alternative choices associated with earnings management. We consider the
impact of financing constraints on the choice between accruals, other real earnings management techniques, and accretive share
repurchases. To do so, we begin by estimating accrual based and other real earnings management activity where other real
earnings management is defined by an aggregate proxy that captures overproduction, cutting research and development (R&D)
Table 4
Propensity to engage in repurchase-based earnings management conditional on debt constraints. Panel A shows the average coefficient estimates based on
annual logit regressions between 1983–1990 for three specifications. Dependent variable is A_REP
t
, which equals 1 for accretive share repurchases; 0 otherwise.
LOGSIZE
t − 1
is one-year lagged value of inflation adjusted book value of assets in 2006 dollars (in logs) winsorized at $4.5 billion. LOGSIZE2
t − 1
is LOGSIZE
t − 1
squared. AGE
t − 1
is one-year lagged value of firm's age defined as the number of years between the observation year and the first year that the firm appears on
COMPUSTAT with a non-missing stock price or assets (winsorized at 37 years). HP_INDEX
t − 1
is one-year lagged aggregated Hadlock and Pierce Index calculated
as −0.737 ∗ LOGSIZE
t − 1
+ 0.043 ∗ LOGSIZE2
t − 1
− 0.04 ∗ AGE
t − 1
. Panel B shows annual actual and expected proportions of accretive repurchasers and the
corresponding differences (propensity) based on the three specifications summarized in Panel A.
⁎⁎⁎
,
⁎⁎
, and
⁎
indicate statistical significance at 1%, 5%, and 10%
levels, respectively.
Panel A: Average of estimated slope coefficients during the training period (1983–1990)
Specification Variables
Intercept LOGSIZE
t − 1
LOGSIZE2
t − 1
AGE
t − 1
HP_INDEX
t − 1
Model (2) in Table 3 − 3.5470
⁎⁎⁎
0.2649
⁎⁎⁎
0.0262
⁎⁎⁎
(0.000) (0.000) (0.000)
Model (3) in Table 3 − 4.3614
⁎⁎⁎
0.6120
⁎⁎⁎
− 0.0331
⁎⁎⁎
0.0282
⁎⁎⁎
(0.000) (0.000) (0.000) (0.000)
Model (4) in Table 3 − 4.4018
⁎⁎⁎
− 0.8512
⁎⁎⁎
(0.000) (0.000)
Panel B: Annual out-of-sample (1991–2011) forecast errors (Propensities)
Year Actual Prop (%) Exp. Prop (%) Act-Exp (%) Exp. Prop (%) Act-Exp (%) Exp. Prop (%) Act-Exp (%)
Model (2) Model (3) Model (4)
1991 10.60 13.36 − 2.76 13.34 − 2.74 13.45 −2.85
1992 8.36 13.43 −5.07 13.46 − 5.10 13.62 − 5.26
1993 9.24 13.86 −4.62 13.93 − 4.69 14.12 − 4.88
1994 10.58 13.91 − 3.33 14.05 − 3.47 14.24 −3.67
1995 12.39 13.84 − 1.45 13.99 − 1.60 14.18 −1.79
1996 13.69 13.97 − 0.29 14.14 − 0.45 14.32 −0.64
1997 14.29 13.58 0.71 13.69 0.60 13.87 0.42
1998 16.61 13.26 3.35 13.34 3.28 13.49 3.12
1999 19.74 13.38 6.36 13.41 6.33 13.58 6.17
2000 18.98 13.37 5.61 13.31 5.67 13.49 5.49
2001 13.53 13.65 − 0.12 13.55 − 0.02 13.70 −0.17
2002 11.41 13.82 − 2.42 13.70 − 2.29 13.86 −2.46
2003 11.11 14.13 − 3.02 13.98 − 2.87 14.19 −3.09
2004 10.51 14.36 − 3.84
14.17 − 3.66 14.42 −3.91
2005 13.25 14.83 − 1.58 14.65 − 1.40 14.92 −1.68
2006 17.15 15.46 1.70 15.28 1.87 15.58 1.58
2007 19.20 15.91 3.29 15.72 3.48 16.01 3.19
2008 22.59 16.64 5.95 16.46 6.13 16.74 5.85
2009 13.69 16.71 − 3.03 16.53 − 2.84 16.84 −3.15
2010 16.04 16.97 − 0.94 16.74 − 0.71 17.09 −1.05
2011 20.87 17.53 3.34 17.28 3.59 17.66 3.22
Average − 0.10 − 0.04 −0.26
p-Value for the average 0.90 0.96 0.74
10 K. Farrell et al. / Journal of Corporate Finance 25 (2014) 1–15
expenditures and advertising expenditures (Eqs. (1), (2), and (3) in Section 2.2.4). Our sample period starts in 1987 due to the
lack of availability of the cash flows from operations item under Statement of Financial Accounting Standards no. 95 before 1987.
We trim all of the independent and dependent variables on both tails of the distribution at the 0.1% level to eliminate the effect of
outliers. Our results are reported in Table 5.
Panel A of Table 5 shows the median slope coefficients estimated for each Fama and French (1997) industry-year group. Model
(1) shows that change in sales (ΔS
t
/TA
t − 1
) and fixed assets (PPE
t
/TA
t − 1
) are positively and negatively related to accruals,
respectively. Turning to model (2), we find that current and past sales (S
t
/TA
t − 1
and S
t − 1
/TA
t − 1
) are positively and negatively
related to production levels, respectively. Lastly, in model (3) we find that sales (S
t
/TA
t − 1
) are positively related to discretionary
expenditures. These estimates are comparable to those reported in Zang (2012).
Panel B shows the summary statistics for other earnings management proxies (AB_ACC
t
, AB_PROD
t
, AB_DISC
t
, and RM
t
). The
means for AB_ACC
t
, AB_PROD
t
and AB_DISC
t
are expectedly zero and medians are 0.0208, − 0.0081 and 0.0598, respectively. Signs
and magnitude of the medians are consistent with Zang (2012). Combined real earnings management proxy (RM
t
) is defined as
the sum of AB_PROD
t
and AB_DISC
t
and has non-zero mean due non-overlapping missing observations in AB_PROD
t
and AB_DISC
t
.
The median value for RM
t
is 0.0543 and is comparable to those reported in Zang (2012).
Next, we examine the relation between financing constraints and earnings management proxies in a sample of suspect
firm-year obse rvations where earnings management are likely to occur. This subsampling procedure is important because
AB_ACC
t
, AB_PROD
t
, AB_DISC
t
,andRM
t
are essentially regression residuals that sum to zero, implying that on average earnings
are not managed. Consistent with this vi ew, prior papers exami ne residual-based earn ings management in a particular
Table 5
Estimation of accrual-based and real earnings management activity. Panel A reports the estimation results for normal levels of accrual-based and real earnings
management activities through overproduction and reduction in R&D, advertising and SG&A based on the following models:
TACC
t
TA
t−1
¼ α
0
þ α
1
1
TA
t−1
þ α
2
ΔS
t
TA
t−1
þ α
3
PPE
t
TA
t−1
þ ε
t
PROD
t
TA
t−1
¼ α
0
þ α
1
1
TA
t−1
þ α
2
S
t
TA
t−1
þ α
3
ΔS
t
TA
t−1
þ α
4
ΔS
t−1
TA
t−1
þ ε
t
DISCX
EX
P
t
TA
t−1
¼ α
0
þ α
1
1
TA
t−1
þ α
2
S
t−1
TA
t−1
þ ε
t
Each model is estimated across each industry (Fama and French, 1997) and y ear group with at least 15 observa tions. Median sl ope coefficients and
corresponding p-values across industry-year groups are reported. TACC
t
is total accruals, which is computed as income before extraordinary items minus
operating cash flows in period t. TA
t − 1
is total assets at the beginning of the year. ΔS
t
isthechangeinsalesfromperiodt − 1 to period t. PPE
t
is the gross
property, plant , and equ ipme nt at t he en d of the y ear. PROD
t
is the sum of costs of goods sold during period t and the change in inventories fr om per iod t − 1 to
period t. S
t
is the sales during period t and ΔS
t − 1
is the change in sales from period t − 2 to period t − 1. DISC_EXP
t
is the sum of discretionary expenditures
(R&D, advertising and SG&A) during period t. Missing R&D and advertising fields are set to zero if the SG&A data item is availabl e. S
t − 1
is the sales during
period t − 1. Sample period is from 1988 to 2011. To eliminate the effect of outliers all variables are trimmed at 0.1% level on each tail of the sample
distribution. Panel B shows the summary statistics for abnormal accruals and real earnings management proxy (RM
t
) and its compo nents . AB_ACC
t
and AB_PROD
t
are residuals from Eqs. (T5.1) and (T5.2). AB_D I SC
t
is negative of residuals from T5.3. RM
t
is the sum of AB_PROD
t
and AB_DISC
t
.
⁎⁎⁎
,
⁎⁎
,and
⁎
indicate statisti cal significance at 1%, 5%, and 10% levels, respectively. Appendix A provides a detail ed description of the COMPUSTAT items used in
variable construction.
Panel A: Accrual-based and real earnings management baseline estimations
Independent variables Dependent variables
TACC
t
/TA
t − 1
PROD
t
/TA
t − 1
DISC_EXP
t
/TA
t − 1
(1) (2) (3)
Intercept −0.0446
⁎⁎⁎
− 0.0534
⁎⁎⁎
0.1346
⁎⁎⁎
1/TA
t − 1
−0.1923
⁎⁎⁎
0.0308
⁎⁎⁎
0.7874
⁎⁎⁎
ΔS
t
/TA
t − 1
0.0576
⁎⁎⁎
PPE
t
/TA
t − 1
−0.0343
⁎⁎⁎
S
t
/TA
t − 1
0.7449
⁎⁎⁎
0.1039
⁎⁎⁎
ΔS
t − 1
/TA
t − 1
0.0082
S
t − 1
/TA
t − 1
− 0.0341
⁎⁎⁎
Median Adj-R
2
24.0% 88.0% 36.5%
Number of industry-year groups 70 69 71
Panel B: Summary statistics for accrual-based and real earnings management
Variables N Mean Median Std Min 25% 75% Max
AB_ACC
t
107,240 0.0000 0.0208 0.2753 −5.3174 − 0.0462 0.0876 3.2341
AB_PROD
t
103,284 0.0000 − 0.0081 0.3245 −3.4410 −0.1395 0.1203 6.3657
AB_DISC
t
103,429 0.0000 0.0598 0.5378 −9.0436 − 0.0968 0.2101 8.2082
RM
t
93,976 −0.0090 0.0543 0.6110 −9.6134 −0.2007 0.2804 7.3165
11K. Farrell et al. / Journal of Corporate Finance 25 (2014) 1–15
context such as e quity offerings (Cohen and Zarowin, 2010; Teoh et al., 1998a,b), managerial option exercises (Bergstresser
and Philippon, 2006)andmergers(Erickson and Wang, 1999) where incentive to manage earning s is present.
Following Roychowdhury (2006) and Zang (2012) we classify a firm-year observation into the suspect sample based on three
criteria. A firm year observation is classified as a suspect if the firm just meets or beats (1) zero earnings benchmark
(if 0 ≤ ROA
t
≤ 0.5%) or (2) last year's earnings per share (if 0 ≤ EPS
t
− EPS
t − 1
≤ $0.02) or (3) the mean analyst EPS
forecasts (if 0 ≤ EPS
t
− Consensus
t
≤ $0.01). Following Za ng (2012), we identify two variables (degree of habitual earnings
management and analyst coverage) that are associated with whether a firm is suspected of engagin g in earnings management
beh avior. We define HABIT
t
as the number of times the firm meets/beats the quarterly analyst earnings consensus and
LOGANALYST
t
as the logarithmic tra nsformation of the numbe r of analysts covering the firm before the earnings release date. As
shown in panel A of Table 6, we find that the mean values for both of these variables are sign ificantly higher for suspect firms
than for firms found in the entire universe of Compustat firms for which we are able to obtain analyst forecast data. For example,
suspect firms, on average, consistently meet or beat quarterly analyst forecasts 1.8 times relative to 0.88 times for all other
Compustat firms. Similarly, the number of analysts co vering suspect firms is 1.25 versus 0.67 for all Compu sta t firms.
Table 6 panel B presents the summary statistics for the subsample of suspect firms. We document approximately 16.9%
accretive share repurchases for the firms suspected of earnings management. The mean level of abnormal accruals, abnormal
production, discretionary expenditures and combined real earnings management proxy are 0.0308, −0.0369, 0.066 and 0.025
Table 6
Impact of financing constraints on accretive repurchases and ot her earnings management techniques. Panel A compares two distinguishing characteristics of
suspect firms (habitual earnings management and analyst coverage) to the rest of the COMPUSTAT universe. A firm-year observation is classified as a suspect
(1) if the firm just meets or beats zero earnings benchmark (if 0 ≤ ROA
t
≤ 0.5%) and/or (2) if the firm j ust meets or beats l ast year's earnings per share
(if 0 ≤ EPS
t
− EPS
t − 1
≤ $0.02) and/or (3) if the firm just meets or beats mean analyst EPS forecasts (if 0 ≤ EPS
t
− Consensus
t
≤ $0.01). HABIT
t
measures the
number of times the firm meets/beats quarterly analyst earnings consensus. LOGANA LYST
t
is the logarithmic transformation—defined as log (1 + x) for
variable x—of the number of ana lysts covering the firm before the earnings release date. Panel B shows the summary statistics of firms that are suspected of
earnings management. P anels C and D examine the impact of financing constraints on accretive repurchases and other earnings management techniques
among suspect firms by controlling for potential sample selection bi as us ing Heckman two-ste p reg ressions. Panel C reports the results of parsimonious
specifications whereas Panel D r eports the results of full specifications. The first stage probit regression is suppressed. The second stage equation results are
reported for repurchase-based (A_REP
t
), accrual-based (AB_ACC
t
) an d other real earni ngs -bas ed earnings management measures (AB_PROD
t
, AB_DISC
t
and
RM
t
). When the dependent variable is A_REP
t
, a probit-based Heckm an specification i s used. For other dependent variables O LS-based Heckman
specifications are used. A_REP
t
equals 1 for accretive share repurchases; 0 otherwise. AB_ACC
t
and AB_PROD
t
are residuals from Eqs. (T5.1) and (T5.2).
AB_DISC
t
is the negative of residuals from T5.3. RM
t
is the sum of AB_PROD
t
and AB_DISC
t
. HP_INDEX
t − 1
is one-year lagged aggregated Hadlock and Pierce
Index calculated as − 0.737 ∗ LOGSIZE
t − 1
+0.043∗ LOGSIZE2
t − 1
− 0.04 ∗ AGE
t − 1
. BIG8
t − 1
is a dummy variable that equals one if the firm's auditor is
one of the leading eight auditing firms that are currently Big 4 auditing fir ms due to mergers or bankruptc ies, otherwise equal s zero. AUDITOR_AGE
t − 1
is a
one-year lagged dummy variable th at equals one if the firm is audited by its current auditor more than 4 years (sample median), otherwise zero. SOX_DUM
t
is a dummy variable that equals one if the firm-year observation occurs after 2003, otherwise zero. NOA
t − 1
is a one-year lagged dummy variable
that equals one if the v alu e of net op eratin g assets exceeds the average of the firm's Fama and French (1997) industry. OPCYCLE
t − 1
is the one-year lagged
value of the firm's cash cycle. MKTSHARE
t − 1
is the proportion of the firm's sales to total sales of the firm's Fama and French (1997) industry. ZSCORE
t − 1
is
the one-year lagge d value of Altman's Z-score calculated as 0.3 ∗ (IB
t − 1
/AT
t − 1
) + (SALE
t − 1
/AT
t − 1
) + 1.4 ∗ (RE
t − 1
/AT
t − 1
) + 1.2 ∗ ((ACT
t − 1
− LCT
t − 1
)/
AT
t − 1
) + 0.6 ∗ (PRCC_F
t − 1
∗CSHO
t − 1
/LT
t − 1
). MTR
t − 1
is the one-year lagged value of the firm's marginal tax rate before interest rate deductions from Blouin etal.
(2010). λ is the inverse Mill's ratio and ρ is the cross-equation error correlation estimate for the probit-based Heckman. p-Values are reported in parentheses and based
on robust firm-level clustered standard errors.
⁎⁎⁎
,
⁎⁎
,and
⁎
indicate statistical significance at 1%, 5%, and 10% levels, respectively. Sample period is from 1983 to 2011
and the sample excludes financials (SIC between 6000 and 6999) and utilities (SIC between 4900 and 4999). Variables are winsorized at 1% (except for dummy
variables and variables that are winsorized by construction). Appendix A provides a detailed description of the COMPUSTAT items used in variable construction.
Variable Suspect firm-years
(N = 9855)
Other firm years
(N = 54,897)
Difference
(Suspect—Other)
p-Value
Mean Mean
Panel A: Characteristics of firms suspected of managing earnings compared to COMPUSTAT universe
HABIT
t
1.8091 0.8702 0.9389
⁎⁎⁎
0.000
LOGANALYST
t
1.2548 0.6675 0.5873
⁎⁎⁎
0.000
Variables N Mean Median Std Min 25% 75% Max
Panel B: Summary statistics for firms suspected of managing earnings
A_REP
t
5414 0.1686 0.0000 0.3745 0.0000 0.0000 0.0000 1.0000
AB_ACC
t
5414 0.0308 0.0250 0.1378 −0.8627 − 0.0217 0.0821 0.5121
AB_PROD
t
5414 −0.0369 − 0.0275 0.2226 −0.7353 −0.1472 0.0786 0.8783
AB_DISC
t
5414 0.0653 0.0733 0.3162 −1.4359 − 0.0576 0.2155 0.8818
RM
t
5414 0.0247 0.0568 0.5251 −6.0177 − 0.1607 0.2688 4.2736
HP_INDEX
t − 1
5414 −3.0719 − 3.1636 1.0051 −4.6369 −3.7697 −2.5460 0.8452
BIG8
t − 1
5414 0.7852 1.0000 0.4107 0.0000 1.0000 1.0000 1.0000
AUDITOR_AGE
t − 1
5414 0.6204 1.0000 0.4853 0.0000 0.0000 1.0000 1.0000
SOX_DUM
t
5414 0.3511 0.0000 0.4774 0.0000 0.0000 1.0000 1.0000
NOA
t − 1
5414 0.5604 1.0000 0.4964 0.0000 0.0000 1.0000 1.0000
OPCYCLE
t − 1
5414 100.6672 90.3299 103.4962 −250.2131 44.6068 146.3544 565.4616
MKTSHARE
t − 1
5414 0.0119 0.0021 0.0252 0.0000 0.0004 0.0094 0.1444
ZSCORE
t − 1
5414 74.6962 4.9898 310.3385 −25.4991 2.6308 12.9412 2181.2700
MTR
t − 1
5414 0.2812 0.3269 0.0935 0.0146 0.2594 0.3430 0.4296
12 K. Farrell et al. / Journal of Corporate Finance 25 (2014) 1–15
respectively. The median values for non-indicator variables are 90.33 for the firm's cash cycle (OPCYCLE
t − 1
), 0.21% for market
share (MKTSHARE
t − 1
), 4.99 for z-score (ZSCORE
t − 1
) and 0.33 for the marginal tax rate (MTR
t − 1
). All control variables appear to
be reasonable relative to Zang (2012).
5
We implement Heckman two-stage regression methods to account for potential selection bias. We implement two sets of
estimations. The first set has a parsimonious second stage equation with only HP_INDEX
t
appearing on the right hand side. The
second set of equations controls for all of the control variables. We utilize two instrumental variables, HABIT
t
and LOGANALYST
t,
to
predict the odds of being a suspect firm.
6
To save space we do not report the first-stage results but consistent with the univariate
analysis provided in Panel A, both HABIT
t
and LOGANALYST
t
are positively and significantly related to the likelihood of suspect
sample inclusion.
Panels C and D report the second stage results for parsimonious and comprehensive estimations.
7
In model (1) of Panel C, we
confirm our previous findings that financing constraints are negatively related to accretive repurchases. In model (2), we find a
positive relation between accruals based earnings management and financing constraints. Turning to other real earnings
management techniques we document a significantly negative relation between other real earnings management techniques and
financial constraints (models (3), (4), and (5) in Panel C). These results suggest that financing constraints limit the firm's ability to
manage earnings through real earnings techniques and enhance the firm's ability to manage earnings through accruals. Our
results appear consistent with Linck et al. (2013) who find that financially constrained firms with valuable projects have
significantly positive abnormal accruals in the quarters preceding investment. When we control for the full variables (results
shown in Panel D), the impact of financing constraints on earnings management proxies remain unchanged. Overall, the results in
Table 6 show that financing constraints impact the choice of earnings management techniques.
4. Summary of results and conclusions
We document that share repurchases have become more prevalent as a mechanism to manage earnings. By the end of our
sample period, 50% of repurchasing firms engage in accretive share repurchases. We provide evidence that financially constrained
Table 6 (continued)
Variable Second stage Second stage Second stage Second stage Second stage
Dependent
variable = A_REP
t
Dependent
variable = AB_ACC
t
Dependent
variable = AB_PROD
t
Dependent
variable = AB_DISC
t
Dependent
variable = RM
t
Estimate p-Value Estimate p-Value Estimate p-Value Estimate p-Value Estimate p-Value
(1) (2) (3) (4) (5)
Panel C: Impact of financing constraints on accretive repurchases and other earnings management techniques (parsimonious second step results)
Intercept −0.4320
⁎⁎⁎
0.0000 0.0919
⁎⁎⁎
0.000 − 0.3380 0.0000 0.0359 0.5435 − 0.3543
⁎⁎⁎
0.0004
HABIT
t
LOGANALYST
t
HP_INDEX
t − 1
− 1.3648
⁎⁎⁎
0.0000 0.0122
⁎⁎⁎
0.0045 − 0.0414
⁎⁎⁎
0.0000 − 0.0208
⁎
0.0504 − 0.0714
⁎⁎⁎
0.0000
λ/ρ −0.6273
⁎⁎⁎
0.0000 − 0.0163 0.0255 0.1209
⁎⁎⁎
0.0000 − 0.0244 0.2662 0.1102
⁎⁎⁎
0.0022
Panel D: Impact of financing constraints on accretive repurchases and other earnings management techniques (comprehensive second step results)
Intercept −1.1142
⁎⁎⁎
0.0000 − 0.0008 0.9733 − 0.3386
⁎⁎⁎
0.0000 − 0.3501
⁎⁎⁎
0.0000 − 0.7297
⁎⁎⁎
0.0000
HABIT
t
LOGANALYST
t
HP_INDEX
t=1
− 0.2656
⁎⁎⁎
0.0000 0.0105
⁎⁎
0.0386 − 0.0484
⁎⁎⁎
0.0000 − 0.0327
⁎⁎⁎
0.0087 − 0.0869
⁎⁎⁎
0.0002
BIG8
t − 1
0.0356 0.6120 − 0.0261
⁎⁎⁎
0.0000 0.0159 0.2102 − 0.0601
⁎⁎⁎
0.0004 − 0.0507
⁎⁎
0.0688
AUDITOR_AGE
t − 1
0.0460 0.2800 0.0029 0.5569 −0.0236
⁎⁎
0.0035 0.0058 0.6289 − 0.0175 0.4014
SOX_DUM
t
0.0944
⁎
0.0350 0.0069 0.175 0.0033 0.6982 − 0.0069 0.5852 − 0.0146 0.4999
NOA
t − 1
− 0.1432
⁎⁎⁎
0.0010 − 0.0138
⁎⁎⁎
0.0014 0.0025 0.7615 0.0816
⁎⁎⁎
0.0000 0.0844
⁎⁎⁎
0.0000
OPCYCLE
t − 1
− 0.0001 0.7520 0.0001
⁎⁎
0.0141 − 0.0002 0.0018 − 0.0001 0.5631 − 0.0001 0.4427
MKTSHARE
t − 1
3.4643
⁎⁎⁎
0.0000 − 0.1242 0.1435 − 0.5253
⁎⁎⁎
0.0099 − 0.0308 0.8981 − 0.5443 0.2181
ZSCORE
t − 1
0.0001 0.3590 0.0000 0.7914 0.0000
⁎⁎⁎
0.0000 − 0.0001
⁎⁎⁎
0.0000 − 0.0001
⁎⁎⁎
0.0000
MTR
tnnnnn1
1.4702
⁎⁎⁎
0.0000 0.2228
⁎⁎⁎
0.0000 − 0.0078 0.8876 0.5332
⁎⁎⁎
0.0000 0.5403
⁎⁎⁎
0.0000
λ/ρ 0.0028 0.7366 0.1303
⁎⁎⁎
0.0000 0.0764
⁎⁎⁎
0.0011 0.2137
⁎⁎⁎
0.0000
Industry dummies Included Included Included Included Included
Year dummies Excluded Excluded Excluded Excluded Excluded
5
The distributional properties of z-score appear to be driven by outliers as the mean value of 74.70 is substantially different from Zang's (2012) 6.65. To
address this issue, we winsorize the z-score at 5% and rerun our regression specifications and find very similar results. We also find similar results when we rerun
our regressions without the z-score.
6
Our approach closely follows Zang's (2012) approach. We drop some variables when their instrumentation ability is impaired (i.e. having the wrong sign or
statistically insignificant). Our model is a more parsimonious model that appears to be relatively stable.
7
For specifications, where the dependent variable is dichotomous (A_REP
t
) we implement Heckman probit estimations. Other specifications are based on
Heckman OLS estimations.
13K. Farrell et al. / Journal of Corporate Finance 25 (2014) 1–15
firms are less likely to engage in accretive share repurchases. Thus, the presence of financing constraints discourages the use of
repurchase-based earnings management explaining why many firms do not engage in accretive repurchases. Although we
find that financing constraints can reasonably account for aggregate accretive repurchases, two sub-periods (1997–2000 and
2006–2008) exhibit abnormally positive accretive repurchase activity. Both equity overvaluation creating additional incentives to
manage earnings and regulatory constraints impacting the use of discretionary accruals in the post-SOX era may explain the
greater reliance on share repurchases to manage earnings during these periods.
We also show that for firms that are more likely to be engaging in earnings management activities, financing constraints
influence the choice between alternative earnings management mechanisms. We find that high financial constraints are
negatively related to accretive share repurchases and other real earnings management techniques. Alternatively, high financial
constraints are positively related to accruals. Overall, our paper provides evidence that suggests that financing constraints impact
a firm's choice to engage in repurchase-based earnings management and also serve as a channel through which firms substitute
between repurchase-based earnings management and accruals management.
Acknowledgments
For helpful comments we are grateful to an anonymous referee, the participants at the 2010 Financial Management
Association meeting and seminar participants at the University of Nebraska—Lincoln where earlier versions of this paper were
presented. All errors remain our own.
Appendix A. Definition of variables used in this study
Variables Definition Additional description
Proxy for repurchase-based earnings management
A_REP
t
= 1 for accretive share repurchase firms;
= 0 for non-accretive share repurchase firms.
Accretive share repurchase is a stock repurchase when EPS with buyback
(EPSPX) exceeds EPS without the buyback (EPS_ASIF
t)
) by at least one cent,
where EPS_ASIF
t
=NI
t
(NI)/(shareoutstanding
t − 1
+ 0.5 × Share issued
t
);
share issued is defined as sale of common and preferred stock (SSTK) minus
increase in preferred stock (PSTK), divided by average price.
Proxies for financial constraints
LOGSIZE
t − 1
Log(Inflation adjusted assets) (log(AT ∗ CPIADJ2006))
t − 1
LOGSIZE2
t − 1
Inflation adjusted size squared (log(AT ∗ CPIADJ2006))
t − 1
2
AGE
t − 1
Firm's age Number of years between the observation year and the first year that the
firm is appears on COMPUSTAT with a non-missing stock price (PRCC_F)
or assets (AT).
HP_INDEX
t − 1
Hadlock and Pierce Index − 0.737 ∗ LOGSIZE
t − 1
+ 0.043 ∗ LOGSIZE2
t − 1
− 0.04 ∗ AGE
t − 1
Additional control variables
CF
t − 1
(Operating income + depreciation)/Total assets (IB
t − 1
+DP
t − 1
)/AT
t − 1
CASH
t − 1
Cash and cash equivalents/Total assets CHE
t − 1
/AT
t − 1
MTB
t − 1
Market value of the assets/book value of the assets (AT
t − 1
− CEQ
t − 1
− TXDITC
t − 1
+ CSHO
t − 1
∗ PRCC_F
t − 1
)/AT
t − 1
LEV
t − 1
Long-term debt/Total assets (DLC
t − 1
+ DLTT
t − 1
)/AT
t − 1
EXCESS_RET
t − 1
One-year lagged stock return—CRSP value weighted
market return
Proxy variables for accruals and real earnings management activities
TACC
t
/TA
t − 1
(Earnings before extraordinary item—operating
cash flows)/Total Assets
(IBC
t
—OANCF
t
)/AT
t − 1
PROD
t
/TA
t − 1
(COGS + (Inventory
t
− Inventory
t − 1
))/Total assets (COGS
t −
(INVT
t
− INVT
t − 1
))/AT
t − 1
DISC_EXP
t
/TA
t − 1
(Sum of R&D, advertising, and
SG&A expenses)/Total assets
(XRD
t
+ XAD
t
+ XSGA
t
)/AT
t − 1
1/TA
t − 1
1/Total assets 1/AT
t − 1
ΔS
t
/TA
t − 1
(Sales
t
− Sales
t − 1
)/Total assets (SALE
t
− SALE
t − 1
)/AT
t − 1
PPE
t
/TA
t − 1
Gross property, plant and equipment/Total assets PPEGT
t
/AT
t − 1
S
t
/TA
t − 1
Sales/Total assets SALE
t
/AT
t − 1
ΔS
t − 1
/TA
t − 1
(Sales
t − 1
− Sales
t − 2
)/Total assets (SALE
t − 1
− SALE
t − 2
)/AT
t − 1
S
t − 1
/TA
t − 1
Sales
t − 1
/Total assets SALE
t − 1
/AT
t − 1
AB_ACC
t
Abnormal level of accruals Residuals from Eq. (1)
AB_PROD
t
Abnormal level of production Residuals from Eq. (2)
AB_DISC
t
Negative abnormal level of discount Residuals from Eq. (3) multiplied by − 1
RM
t
Real earnings management proxy Sum of AB_PROD
t
and AB_DISC
t
Proxies for firms suspected of managing earnings
HABIT
t
Degree of habitual earnings management Number of times a firm meets/beats quarterly analyst earnings consensus
LOGANALYST
t
Analyst coverage Log(1 + number of analysts covering the firm before the earnings release date)
14 K. Farrell et al. / Journal of Corporate Finance 25 (2014) 1–15
References
Bartov, E., Givoly, D., Hayn, C., 2002. The rewards to meeting or beating earnings expectations. J. Account. Econ. 33, 173–204.
Bens, D.A., Nagar, V., Skinner, D.J., Wong, M.H.F., 2003. Employee stock options, EPS dilution, and stock repurchases. J. Account. Econ. 36, 51–90.
Bergstresser, D., Philippon, T., 2006. CEO incentives and earnings management. J. Financ. Econ. 80, 511–529.
Blouin, J., Core, J.E., Guay, W., 2010. Have the tax benefits of debt been overestimated? J. Financ. Econ. 98, 195–213.
Burgstahler, D., Dichev, I.D., 1997. Earnings management to avoid earnings decreases and losses. J. Account. Econ. 24, 99–126.
Cheng, Q., Warfield, T., 2005. Equity incentives and earnings management. Account. Rev. 80, 441–476.
Chi, J., Gupta, M., 2009. Overvaluation and earnings management. J. Bank. Finance 33, 1652–1663.
Cohen, D., Zarowin, P., 2010. Accrual-based and real earnings management activities around seasoned equity offerings. J. Account. Econ. 50, 2–19.
Cohen, D.A., Dey, A., Lys, T.Z., 2008. Real and accrual-based earnings management in the pre- and post-Sarbanes–Oxley periods. Account. Rev. 83, 757–787.
Dechow, P.M., Richardson, S.A., Tuna, I., 2003. Why are earnings kinky? An examination of the earnings management explanation. Rev. Account. Stud. 8, 355–384.
DeFond, M., Jiambalvo, J., 1994. Debt covenant effects and the manipulation of accruals. J. Account. Econ. 18, 145–176.
DeFond, M.L., Park, C.W., 1997. Smoothing income in anticipation of future earnings. J. Account. Econ. 23, 115–139.
Denis, D.J., Sibilkov, V., 2010. Financial constraints, investment, and the value of cash holdings. Rev. Financ. Stud. 23, 247–269.
Dittmar, A.K., 2000. Why do firms repurchase stock? J. Bus. 73, 331–355.
Edwards, A., Schwab, C., Shevlin, T., 2013. Financial constraints and the incentive for tax planning. University of Toronto, University of Georgia, and University of
California at Irvine, Unpublished working paper.
Erickson, M., Wang, S., 1999. Earnings management by acquiring firms in stock for stock mergers. J. Account. Econ. 27, 149–176.
Fama, E.F., French, K.R., 1997. Industry costs of equity. J. Financ. Econ. 43, 153–193.
Fama, E.F., French, K.R., 2001. Disappearing dividends: changing firm characteristics or lower propensity to pay? J. Financ. Econ. 60, 3–43.
Froot, K.A., Scharfstein, D.S., Stein, J.C., 1993. Risk management: coordinating corporate investment and financing policies. J. Financ. 48, 1629–1658.
Gunny, K.A., 2010. The relation between earnings management using real activities manipulation and future performance: evidence from meeting earnings
benchmarks. Contemp. Account. Res. 27, 855–888.
Hadlock, C.J., Pierce, J.R., 2010. New evidence on measuring financial constraints: moving beyond the KZ index. Rev. Financ. Stud. 23, 1909–1940.
Healy, P.M., 1985. The effect of bonus schemes on accounting decisions. J. Account. Econ. 7, 85–107.
Healy, P.M., Whalen, J.M., 1999. A review of the earnings management literature and its implications for standard setting. Account. Horiz. 13, 365–383.
Hribar, P., Jenkins, N.T., Johnson, W.B., 2006. Stock repurchases as an earnings management device. J. Account. Econ. 41, 3–27.
Jagannathan, M., Stephens, C.P., Weisbach, M.S., 2000. Financial flexibility and the choice between dividends and stock repurchases. J. Financ. Econ. 57, 355–
384.
Jensen,
M.C., 2005. Agency costs of overvalued equity. Financ. Manag. 34, 5–19.
Jones, J.J., 1991. Earnings management during import relief investigation. J. Account. Res. 29, 193–228.
Li, D., 2011. Financial constraints, R&D investment, and stock returns. Rev. Financ. Stud. 24, 2974–3007.
Linck, J.S., Netter, J., Shu, T., 2013. Can managers use discretionary accruals to ease financial constraints? Evidence from discretionary accruals prior to investment.
Account. Rev. (forthcoming).
Louis, H., Robinson, D., 2005. Do managers credibly use accruals to signal private information? Evidence from the pricing of discretionary accruals around stock
splits. J. Account. Econ. 39, 361–380.
Myers, J.N., Myers, L.A., Skinner, D.J., 2007. Earnings momentum and earnings management. J. Account. Audit. Finance 22, 249–284.
Roger, W.H., 1993. Regression standard errors in clustered samples. Stata Tech. Bull. 13, 19–23.
Roychowdhury, S., 2006. Earnings management through real activities manipulation. J. Account. Econ. 42, 335–370.
Skinner, D.J., Sloan, R.G., 2002. Earnings surprises, growth expectations, and stock returns or don't let an earnings torpedo sink your portfolio. Rev. Account. Stud.
7, 289–312.
Teoh, S.H., Welch, I., Wong, T.J., 1998a. Earnings management and the long-run performance of seasoned equity offerings. J. Financ. Econ. 50, 63–100.
Teoh, S.H., Welch, I., Wong, T.J., 1998b. Earnings management and the long-run performance of initial public offerings. J. Financ. 53, 1935–1974.
Zang, A.Y., 2012. Evidence on the tradeoff between real manipulation and accrual manipulation. Account. Rev. 87, 675– 703.
(continued)
Variables Definition Additional description
Additional control variables for firms suspected of managing earnings
BIG8
t − 1
Auditor dummy = 1 if a firm's auditor is one of the leading eight auditing firms that are
currently Big 4 auditing firms due to mergers and bankruptcies;
= 0 otherwise
AUDITOR_AGE
t − 1
Auditor tenure dummy = 1if the firm is audited by its current auditor more than 4 years;
= 0 otherwise
SOX_DUM
t
Post SOX dummy = 1 for years after 2003
= 0 for years between 1983 and 2003
NOA
t − 1
Net operating assets dummy = 1 if a firm's NOA exceeds the average of the firm's Fama and French
(1997) industry;
= 0 otherwise
OPCYCLE
t − 1
Firm's cash cycle = 365/(SALE
t − 1
/RECT
t − 1
) + 365/(COGS
t − 1
/INVT
t − 1
) −
365/(COGS
t − 1
/AP
t − 1
)
MKTSHARE
t − 1
Market share Sales
t − 1
/total sales of firm's Fama and French (1997) industry
ZSCORE
t − 1
Firm's Z-score = 0.3 ∗ (IB
t − 1
/AT
t − 1
) + (SALE
t − 1
/AT
t − 1
) + 1.4 ∗
(RE
t − 1
/AT
t − 1
) + 1.2 ∗ ((ACT
t − 1
− LCT
t − 1
)/AT
t − 1
) + 0.6 ∗
(PRCC_F
t − 1
∗ CSHO
t − 1
/LT
t − 1
)
MTR
t − 1
Firm's marginal tax rate before interest rate deductions
from Blouin et al. (2010)
Appendix A (continued)
15K. Farrell et al. / Journal of Corporate Finance 25 (2014) 1–15