báo cáo hóa học:" Gene and microRNA analysis of neutrophils from patients with polycythemia vera and essential thrombocytosis: down-regulation of micro RNA-1 and -133a" pot
Bạn đang xem bản rút gọn của tài liệu. Xem và tải ngay bản đầy đủ của tài liệu tại đây (1.2 MB, 17 trang )
BioMed Central
Page 1 of 17
(page number not for citation purposes)
Journal of Translational Medicine
Open Access
Research
Gene and microRNA analysis of neutrophils from patients with
polycythemia vera and essential thrombocytosis: down-regulation
of micro RNA-1 and -133a
Stefanie Slezak
1
, Ping Jin
1
, Lorraine Caruccio
1
, Jiaqiang Ren
1
,
Michael Bennett
2
, Nausheen Zia
1
, Sharon Adams
1
, Ena Wang
1
,
Joao Ascensao
3
, Geraldine Schechter
3
and David Stroncek*
1
Address:
1
Department of Transfusion Medicine, Clinical Center, National Institutes of Health, Bethesda, Maryland, USA,
2
Department of
Hematology, Emek Hospital, Afula, Israel and
3
Hematology Section, Veterans Affairs Medical Center, Washington DC, USA
Email: Stefanie Slezak - ; Ping Jin - ; Lorraine Caruccio - ;
Jiaqiang Ren - ; Michael Bennett - ; Nausheen Zia - ;
Sharon Adams - ; Ena Wang - ; Joao Ascensao - ;
Geraldine Schechter - ; David Stroncek* -
* Corresponding author
Abstract
Background: Since the V617F mutation in JAK2 may not be the initiating event in
myeloprofilerative disorders (MPDs) we compared molecular changes in neutrophils from patients
with polycythemia vera (PV) and essential thrombocythosis (ET), to neutrophils stimulated by G-
CSF administration and to normal unstimulated neutrophils
Methods: A gene expression oligonucleotide microarray with more than 35,000 probes and a
microRNA (miR) expression array with 827 probes were used to assess neutrophils from 6 MPD
patients; 4 with PV and 2 with ET, 5 healthy subjects and 6 healthy subjects given G-CSF. In addition,
neutrophil antigen expression was analyzed by flow cytometry and 64 serum protein levels were
analyzed by ELISA.
Results: Gene expression profiles of neutrophils from the MPD patients were similar but distinct
from those of healthy subjects, either unstimulated or G-CSF-mobilized. The differentially
expressed genes in MPD neutrophils were more likely to be in pathways involved with inflammation
while those of G-CSF-mobilized neutrophils were more likely to belong to metabolic pathways. In
MPD neutrophils the expression of CCR1 was increased and that of several NF-κB pathway genes
were decreased. MicroRNA miR-133a and miR-1 in MPD neutrophils were down-regulated the
most. Levels of 11 serum proteins were increased in MPD patients including MMP-10, MMP-13,
VCAM, P-selectin, PDGF-BB and a CCR1 ligand, MIP-1α.
Conclusion: These studies showed differential expression of genes particularly involved in
inflammatory pathways including the NF-κB pathway and down-regulation of miR-133a and miR-1.
These two microRNAs have been previous associated with certain cancers as well as the regulation
of hyperthrophy of cardiac and skeletal muscle cells. These changes may contribute to the clinical
manifestations of the MPDs.
Published: 4 June 2009
Journal of Translational Medicine 2009, 7:39 doi:10.1186/1479-5876-7-39
Received: 17 March 2009
Accepted: 4 June 2009
This article is available from: />© 2009 Slezak et al; licensee BioMed Central Ltd.
This is an Open Access article distributed under the terms of the Creative Commons Attribution License ( />),
which permits unrestricted use, distribution, and reproduction in any medium, provided the original work is properly cited.
Journal of Translational Medicine 2009, 7:39 />Page 2 of 17
(page number not for citation purposes)
Introduction
The chronic myeloproliferative disorders (MPDs) are
clonal hematopoietic disorders that involve multiple cell
lineages. They include polycythemia vera (PV), essential
thrombocytosis (ET) and primary myelofibrosis (PMF)
[1]. A mutation in the gene encoding Janus Kinase 2
(JAK2), which is involved with hematopoietic growth fac-
tor signaling, has been found in almost all patients with
PV and about half those with ET [2-5]. This mutation,
JAK2 V617F, is a gain of function mutation and hemat-
opoietic progenitor cells from patients with this mutation
have increased sensitivity to hematopoietic growth factors
[5].
While JAK2 V617F has been found in neutrophils from
many patients with chronic MPDs, it is not clear if JAK2
V617F is the initiating lesion in MPDs nor is the complete
spectrum of the molecular changes associated with these
disorders known. Germline JAK2 V617F mutations have
not been found in familial MPD, however, somatic JAK2
V617F mutations have been identified in some affected
kindreds [6,7]. Furthermore, first degree relatives of MPD
patients have a 5- to 7-fold elevated risk of MPD, but the
gene(s) or factors that predispose relatives to PV, ET and
MF are not known [8]. This suggests that there are herita-
ble alleles that predispose individuals to the acquisition of
JAK2 V617F and the development of MPD [1,9]. Further
characterization of the molecular changes in MPD neu-
trophils could lead to a better understanding of the devel-
opment of these diseases and their clinical manifestations.
This study further characterized the molecular changes in
neutrophils from patients with MPDs by comparing neu-
trophils from healthy subjects using global gene and
microRNA (miR) expression arrays. The expression of
neutrophil proteins was also assessed by flow cytometry
and the levels of serum inflammatory factors by ELISA.
Since G-CSF signals through JAK2 MPD neutrophils were
also compared to those of healthy subjects after five days
of G-CSF administration. In this way genes and miR could
be identified whose change in expression was not due to
constitutive activation by JAK2 V617F.
Methods
Study Design
These studies were approved by institutional review
boards at the NIDDK, NIH and Veterans Administration
Medical Center, Washington DC. Whole blood was col-
lected into EDTA tubes from patients with MPD, healthy
subjects, and healthy subjects given G-CSF. Neutrophils
isolated from the EDTA blood was used for gene expres-
sion and microRNA analysis. For MPD patients whole
blood was also collected into citrate tubes and was used to
isolate neutrophils for JAK V617F analysis. Blood col-
lected in tubes without anticoagulant was used to obtain
serum for protein analysis. WHO criteria was used to
make the diagnosis of PV and ET [10].
G-CSF Mobilization of Granulocytes
Healthy subjects were given 10 micrograms/kg of G-CSF
(filgrastim, Amgen, Thousand Oaks, California, USA)
subcutaneously daily for 5 days. Blood was collected for
analysis approximately 2 hours after the last dose of G-
CSF was given.
Neutrophil Isolation
Whole blood, 6 mL in EDTA (K2 EDTA 1.8 mg/mL, BD
Vacutainer, Becton, Dickinson and Company, Franklin
Lakes, NJ), was collected from healthy donors, MPD
patients and donors following a course of G-CSF treat-
ment. Percoll (Sigma, St. Louis, Missouri, USA) density
gradients were used to isolate the neutrophils. Briefly, gra-
dients were prepared by gently overlaying 63% Percoll
solution on top of 72% Percoll solution, in equal vol-
umes. Prior to overlaying the whole blood sample on the
gradient, the majority of red blood cells were removed via
sedimentation by diluting whole blood 1:2 with hetas-
tarch (Hespan; 6% heta starch in 0.9% sodium chloride,
B. Braun Medical Inc., Irvine, California, USA) and incu-
bating for approximately 20 minutes at room tempera-
ture. After layering the leukocyte rich/heta starch solution
on the gradient, the sample was centrifuged at 1,500 rpm
for 25 minutes with no brake upon centrifuge decelera-
tion. The neutrophil layer was harvested from the inter-
face between the two Percoll solutions and washed twice
with physiologic saline.
Flow cytometry for Surface Markers
Flow cytometry analysis of granulocyte surface markers
was performed on fresh whole blood samples. Cells were
stained with monoclonal antibodies against CD177-FITC,
CD15-FITC (Chemicon International, Temecula, CA),
CD64-FITC, CD16-FITC, CD18-FITC, CD11b-FITC
(Caltag Laboratories, Buckingham, UK) CD10-PE, CD31-
PE, CD44-FITC, CD45-FITC, CD55-FITC, CD59-FITC,
CD62L-FITC (eBiosciences, San Diego, CA) and incu-
bated at 4°C for 30 minutes in the dark. Mouse IgG iso-
type controls were also used (Caltag Laboratories). The
FACSCalibur flow cytometer and CellQuest Pro software
(BD Biosciences, San Jose, CA) were used for analysis by
acquiring 10,000 events and determining the viable neu-
trophil population by light scatter.
Assessment of JAK2 V617F
Isolated neutrophils were tested for JAK2 V617F by DNA
sequencing. V617F mutations were identified utilizing
sequence-based typing methodology. Primary amplifica-
tion of the specific region of JAK2 utilized primers Jak2-1
(pf) = tgc tga aag tag gag aaa gtg cat and Jak2-2 (pr, sr) =
tcc tac agt gtt ttc agt ttc aa which produced a 345bp prod-
Journal of Translational Medicine 2009, 7:39 />Page 3 of 17
(page number not for citation purposes)
uct. After primary amplification, sequence primers Jak2-5
(sf) = agt ctt tct ttg aag cag caa and Jak2-2 (pr, sr) = tcc tac
agt gtt ttc agt ttc aa were utilized for detection of the
V617F mutation. Conditions included the use of 2.0 mM
Mg++, 3 pmole of primer, GeneAmp 10× PCR Gold
Buffer, 0.35 unit of AmpliTaq gold DNA polymerase (ABI)
5 U/ul, and 0.15 mM each of 10 mM dNTP mixture
(Amersham) with Big Dye Terminator
®
Cycle Sequencing
kits (Applied Biosystems). Template DNA was utilized at
a concentration of 40–60 ug/mL. PCR cycling parameters
were 95°C for 10 minutes; 95°C for 30 seconds → 52°C
for 40 seconds → 72°C for 40 seconds = 40 cycles; 72°C
for 2 minutes and hold at 4°C. Sequencing reactions were
run on an Applied Biosystem 3730xL DNA Analyzer and
analyzed utilizing standard alignment software.
RNA Preparation, RNA Amplification and Labeling for
Oligonucleotide Microarray
Total RNA from harvested neutrophils was extracted using
Trizol reagent according to the manufacturer's instruc-
tions (Invitrogen, Carlsbad, California, USA). The quality
of secondary amplified RNA was tested with the Agilent
Bioanalyzer 2000 (Agilent Technologies, Waldbronn,
Germany) and amplified into antisense RNA (aRNA) as
previously described [11]. Also total RNA from peripheral
blood mononuclear cells pooled from six normal donors
was extracted and amplified into aRNA to serve as the ref-
erence. Pooled reference and test aRNA were isolated and
amplified in identical conditions to avoid possible
interexperimental biases. Both reference and test aRNA
were directly labeled using ULS aRNA Fluorescent Labe-
ling kit (Kreatech, Amsterdam, The Netherlands) with Cy3
for reference and Cy5 for test samples. Whole-genome
human 36 K oligonucleotide arrays were printed in the
Infectious Disease and Immunogenetics Section of the
Department of Transfusion Medicine, Clinical Center,
NIH (Bethesda, Maryland, USA) using oligonucleotides
purchased from Operon (Operon, Huntsville, Alabama,
USA). The Operon Human Genome Array-Ready Oligo
Set version 4.0 contains 35,035 oligonucleotide probes,
representing approximately 25,100 unique genes and
39,600 transcripts excluding control oligonucleotides.
The design is based on the Ensembl Human Database
build (NCBI-35c) with full coverage on NCBI human Ref-
seq dataset (04/04/2005). The microarray is composed of
48 blocks and one spot is printed per probe per slide.
Hybridization was carried out in a water bath at 42°C for
18 to 24 hours and the arrays were then washed and
scanned on a GenePix 4000 scanner at variable photom-
ultiplier tube to obtain optimized signal intensities with
minimum (<1% spots) intensity saturation. The resulting
data files were uploaded to the mAdb database http://nci
array.nci.nih.gov and further analyzed using BRBArray-
Tools developed by the Biometric Research Branch,
National Cancer Institute />ArrayTools.html.
MicroRNAs Expression Profiling
A microRNA probe set was designed using mature anti-
sense microRNA sequences (Sanger data base, version
9.1) consisting of 827 unique microRNAs from human,
mouse, rat and virus plus two control probes. The probes
were 5' amine modified and printed in duplicate on Code-
Link activated slides (General Electric, GE Health, New
Jersey, USA) via covalent bonding in the Immunogenetics
Laboratory, DTM, CC, NIH. 4 μg total RNA isolated by
using Trizol reagent (Invitrogen, Carlsbad, California)
was directly labeled with miRCURY™ LNA Array Power
Labeling Kit (Exiqon, Woburn, Massachusetts, USA)
according to manufacture's procedure. The total RNA
from an Epstein-Barr virus (EBV)-transformed lymphob-
lastoid cell line was used as the reference for the micro-
RNA expression array assay. The test sample was labeled
with Hy5 and the reference with Hy3. After labeling, the
sample and the reference were co-hybridized to the micro-
RNA array at room temperature overnight in the presence
of blocking reagents as previously described [12] and the
slides were washed and scanned by GenePix scanner Pro
4.0 (Axon, Sunnyvale, California, USA). Resulting data
files were uploaded to the mAdb database http://nci
array.nci.nih.gov and further analyzed using BRBArray-
Tools developed by the Biometric Research Branch,
National Cancer Institute />ArrayTools.html.
Array Data Processing
For analysis of the gene and microRNA array data, the raw
data set was filtered according to a standard procedure to
exclude spots with minimum intensity that was arbitrarily
set to an intensity parameter of 200 for gene expression
data and 100 for microRNA array data in both fluores-
cence channels. Spots flagged by the analysis software and
spots with diameters <20 μm for gene expression array
and <10 μm for the microRNA array were excluded from
the analysis.
The filtered data were normalized using median over
entire array and were retrieved by the BRB ArrayTool http:/
/linus.nci.nih.gov/BRB-ArrayTools.html developed at the
National Cancer Institute (NCI), Biometric Research
Branch, Division of Cancer Treatment and Diagnosis.
Hierarchical cluster analysis was conducted on the genes
or microRNA using Cluster and TreeView software [13].
For annotation of genes and functional pathways, the
Database for Annotation, Visualization and Integrated
Discovery (DAVID) 2007 software http://
david.abcc.ncifcrf.gov/[14] and Ingenuity Pathway Analy-
sis software
was used. All
Journal of Translational Medicine 2009, 7:39 />Page 4 of 17
(page number not for citation purposes)
microRNA target prediction analysis used BRB ArrayTool
microRNA targets program />ArrayTools.html, TargetScan />and miRBase Targets .
Gene and MicroRNA Expression Quantitative PCR
To validate the microarray analysis, 5 genes and 2 micro-
RNAs were selected for Quantitative PCR. Gene expres-
sions for TNFAIP3 (Assay ID, Hs00234713_m1), NFKBIE
(Assay ID, Hs00234431_m1), NFKBIA (Assay ID
Hs00153283_m1), CBS (Assay ID Hs00163925_m1) and
MCL1(Assay ID Hs03043899_m1) were quantified by
TaqMan Gene Expression Assays (Applied Biosystems,
Foster City, California, USA) according to manufacturers'
protocol and normalized by GAPDH (Assay ID
Hs99999905_m1) PCR amplification of target genes and
quantification of the amount of PCR products were per-
formed by ABI PRISM 7900 HT Sequence Detection Sys-
tem (Applied Biosystems). Differences in expression were
determined by the relative quantification method; the Ct
values of the test genes were normalized to the Ct values
of endogenous control GAPDH. The fold change was cal-
culated using the equation 2
-ΔΔCt
.
Differentially expressed microRNAs, miR-133a (Assay ID,
4373142) and miR-219 (Assay ID, 4373080), were meas-
ured by TaqMan microRNA Assays (Applied Biosystems,
Foster City, California, USA) as previously reported [15].
The differences of expression were determined by relative
quantification method; the Ct values of microRNAs were
normalized to the Ct values of endogenous control
RNU48 (Assay ID 4373383). The fold change was calcu-
lated using the equation 2
-ΔΔCt
.
Analysis of Serum Proteins
Serum samples were collected and frozen immediately,
and stored at -80°C until further analysis. The serum sam-
ples were analyzed by protein expression profiling. The
level of 64 soluble factors were assessed on an ELISA-
based platform (Pierce Search Light Proteome Array, Bos-
ton, MA) consisting of multiplexed assays that measured
up to 16 proteins per well in standard 96 well plates
(Table 1). The 64 factors were selected to included hemat-
opoietic factors, factors associated with inflammation,
and those previously found to be increased in the serum
of healthy subjects given G-CSF [16].
Statistical Analysis
Unsupervised analysis was performed by using BRBArray-
Tools /> and
the Stanford Cluster Program [17]. Class comparison
analysis was performed using parametric unpaired Stu-
dent's t-test to identify differentially expressed genes or
microRNA among different sample groups and using dif-
ferent significance cutoff levels as demanded by the statis-
tical power of each comparison. Statistical significance
and adjustments for multiple test comparisons were based
on univariate and multivariate permutation tests as previ-
ously described [18,19].
Results
Global Transcriptome Analysis
Neutrophils from 6 MPD patients were studied; 4 with PV
and 2 with ET. JAK2 V617F was detected in 3 of the 4 PV
patients and in 1 of the 2 ET patients (Table 2). Global
gene expression analyses of neutrophils from 6 subjects
with MPDs were compared with 6 healthy subjects given
5 days of G-CSF and the 5 healthy subjects. Among the 17
samples and 35,000 probes in the array, 3,617 were
expressed by 80% of the samples and their expression was
increased by 2-fold or greater in at least one sample. Unsu-
pervised hierarchical clustering analysis of these 3,617
genes revealed three distinct groups: the G-CSF group
which included 5 of the 6 G-CSF mobilized neutrophil
samples, the MPD group with 4 of the 6 MPD neutrophil
samples and 2 healthy subject neutrophils, and the mixed
Table 1: Serum factors measured in MPD patients and healthy subjects
IL-1α MCP-1 (CCL2) TPO TNFα
IL-1β MCP-2 (CCL8) G-CSF INFα
IL-2 MCP-3 (CCL7) GM-CSF TGFα
IL-6 MCP-4 (CCL13) MMP-1 PDGFAA
IL-10 E-Selectin MMP-2 PDGFAB
IL-11 P-Selectin MMP-8 PDGFBB
IL-2R L-Selectin MMP-9 HGF
IL-4R MIP-1α (CCL3) MMP-10 VCAM
IL-6R MIP-1β (CCL4) MMP-13 ICAM-1
TARC (CCL17) MIP-1δ TIMP-1 PECAM-1
OPN MIP-3α (CCL20) TIMP-2 FASL
IP-10 MIP-3β (CCL13) MPO CD40L
Eotaxin (CCL11) MIG (CXCL9) SAA RANK
ITAC (CXCL11) IP-10 (CXCL10) SDF-1b (CXCL12) RANKL
ENA-78 (CXCL5) GROα (CXCL1) OPG RANTES (CCL5)
Exodus II GROγ (CXCL3) LIF TNFR1
Journal of Translational Medicine 2009, 7:39 />Page 5 of 17
(page number not for citation purposes)
group with 3 healthy subject, 2 MPD, and 1 G-CSF-mobi-
lized neutrophils (Figure 1).
These results showed that the gene expression profile of
MPD neutrophils differed from that of healthy subject
neutrophils and G-CSF-mobilized neutrophils. Further
analysis found that the expression of 1,006 genes differed
among neutrophils from the MPD patients, healthy sub-
jects, and healthy subjects given G-CSF (F-test, p ≤ 0.005).
Hierarchical clustering analysis of these 1,006 genes sepa-
rated the neutrophils into 3 groups; one contained neu-
trophils from 5 of 6 MPD patients, another included
neutrophils from 5 healthy subjects and 1 MPD patient,
and the third contained neutrophils from all 6 subjects
given G-CSF (Figure 2). In this gene expression profile the
MPD neutrophils aligned closer to the healthy subject
neutrophils than the G-CSF-mobilized neutrophils. Two
clusters of genes distinguished the MPD neutrophils from
the healthy subject neutrophils. One cluster was made up
of 17 genes whose expression was increased more in MPD
neutrophils than in neutrophils from healthy subjects or
healthy subjects given G-CSF (Figure 2, cluster 1) and
another contained 38 genes down-regulated in MPD neu-
trophils but not in healthy subjects or G-CSF mobilized
neutrophils (Figure 2, cluster 2). The cluster of MPD up-
regulated genes included FRAT1, ZNF652, LMO4, IL10RB,
and cystathionine β-synthase (CBS). FRAT1 is a regulator
of the Wnt signaling pathway and is overexpressed in
esophageal squamous cell carcinoma [20]. ZNF652 has a
role in the suppression of breast oncogenesis and vulvar
cancer [21,22]. LMO4 is a transcription regulator and
increased expression of LMO4 in pancreatic ductal adeno-
carcinoma is associated with a survival advantage [23].
The expression of CBS has been previously reported to be
up-regulated in neutrophils from patients with MPDs
[24]. Among the down-regulated genes were ribosomal
proteins including 3 copies of RPL10, 2 copies of RPL3,
and RPS9, RPS10P3, and RPL12P6; proteosome proteins
including 3 copies of PSMD2 and PSMC; and cytochrome
c oxidases COX5B and COX7A2.
To further explore the differences between MPD and G-
CSF-mobilized neutrophils, the genes differentially
expressed in MPD neutrophils compared to healthy sub-
ject neutrophils were identified as well as those differen-
tially expressed in G-CSF-mobilized-neutrophils. MPD
neutrophil differentially expressed genes were more likely
to belong to inflammatory pathways (Figure 3A). In con-
trast, G-CSF-mobilized neutrophils differentially
expressed genes were more likely to belong to metabolic
pathways (Figure 3B).
To further characterize MPD neutrophils, we identified
those differentially expressed genes whose expression was
increased or decreased to the greatest fold as compared to
the healthy subjects. Among the 30 genes whose expres-
sion was increased to the greatest extent in MPD neu-
trophils were ZNF652, CBS, LMO4, AXUD1, MCL1 and
CCR1 (Table 3). AXUD1 is a regulator of the Wnt signal-
ing pathway and is down-regulated in lung, kidney, and
colon cancer [25]. MCL-1 is a member of the Bcl-2 family
and is an important anti-apoptotic molecule for multiple
types of hematopoietic cells [26]. CCR1 is a chemokine
receptor for at least 11 different chemokines including
CCL3 (MIP-1α), CCL5 (RANTES), CCL7 (MCP-3), CCL8
(MCP-2), CCL14, CCL15, CCL16 and CCL23 [27].
Among the genes down-regulated most in MPD neu-
trophils were neutrophil elastase 2 (ELA2) and two NF-kβ
pathway genes (NFKBIA and NFKBIE) all of which are
involved in inflammation (Table 4).
We used qRT-PCR to further confirm the differential
expression of 3 NFKB pathway genes, NFKBIA, NFKBIE
and TNFAIP3 as well as MCL1 and CBS (Figure 4). This
confirmed that the expression of NFKBIA, NFKBIE, and
TNFAIP3 were significantly down-regulated in both MPD
and G-CSF-mobilized neutrophils compared to those
from healthy subjects. The expression of CBS was signifi-
cantly up-regulated in MPD neutrophils and the expres-
sion of MCL1 was up-regulated but not to a significant
degree as compared to healthy subjects.
Table 2: Gender, race, age, diagnosis and JAK2 V617F status of patients whose neutrophils were analyzed for gene and microRNA
expression profiling
Patient Gender Race Age (years) Diagnosis JAK2 V617F
1 Female Caucasian 45 ET Positive
2 Male Caucasian 47 ET Negative
3 Female Caucasian 63 PV Positive
4 Male Caucasian 62 PV Positive
5 Female Caucasian 57 PV Negative
7 Male Caucasian 52 PV Positive
ET = essential thrombocytosis
PV = polycythemia vera
Journal of Translational Medicine 2009, 7:39 />Page 6 of 17
(page number not for citation purposes)
Micro RNA Expression Results
MicroRNA expression was compared among MPD, G-
CSF-mobilized and healthy subject neutrophils using a
microarray. Among the 827 probes, 500 remained after
selecting only those expressed in >80% of samples. Unsu-
pervised hierarchical clustering analysis of the neutrophil
samples separated the samples into two groups. One
group included 3 G-CSF-mobilized neutrophils and 3
healthy subject neutrophils and the second included 3 G-
CSF-mobilized neutrophils, 6 MPD neutrophils and 5
normal donor neutrophils (data not shown).
Comparison of the expression of microRNA between
MPD and healthy subject neutrophils found that the
expression of 21 microRNA were up-regulated in MPD
neutrophils and 11 were down-regulated (p < 0.05).
Among the microRNA up-regulated in MPD neutrophils
were 5 that were increased more than 2-fold; miR-219,
miR-515-5p, miR-142-5p, miR-143, and miR-101 (Table
5). The up-regulation of miR-219 in MPD neutrophils
compared to those from healthy subjects was confirmed
by qRT-PCR (Figure 5). Interestingly, miR-219 has been
found to be expressed in the brain and its levels exhibit
circadian rhythms and are involved in the control of the
suprachiasmatic nuclei (SCN), the master circadian clock
in mammals [28]. The expression of 142–5p has also been
found to be increased in peripheral blood leukocytes [12].
MicroRNA miR-143 has been found to be involved with
cell differentiation. The differentiation of pre-adipocytes
to adipocytes is associated with the increased levels of
miR-143 [29]. Bruchova and colleagues have found that
miR-143 is up-regulated in neutrophils from patients with
polycythemia vera [30]. The expression of miR-143 is
down-regulated in B cell malignancies, Burkitt's lym-
phoma cell lines [31], and colorectal cancer [32].
Among the microRNA down-regulated in MPD neu-
trophils the expression of five were decreased more than
2-fold: miR-133a, miR-504, miR-565, miR-1, and miR-
216 (Table 5). The down-regulation of miR-133a in MPD
neutrophils was confirmed by qRT-PCR (Figure 5). Micro-
RNA miR-133a and -1 are clustered on the same chromo-
some and are transcribed together as a single transcript
[33,34]. These two microRNA are preferentially expressed
in brown adipocytes [35], cardiac, and skeletal muscle
[34] and are important in the differentiation and regula-
tion of cardiac and skeletal muscle. Little is known about
miR-216, -504 and -565. Micro RNA-216 is expressed by
the pancreas. A comparison of normal pancreas with 33
other tissues found that the expression of miR-216 and
miR-217 and the lack of expression of miR-133a were
characteristic of pancreatic tissue [36].
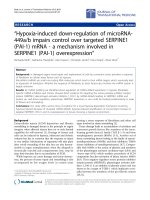
Gene expression analysis of MPD neutrophilsFigure 1
Gene expression analysis of MPD neutrophils. Gene
expression of neutrophils from 6 MPD patients, 5 healthy
subject neutrophils and 6 healthy subjects given G-CSF was
analyzed using a microarray with more than 35,000 probes.
The 3,617 genes that were expressed in at least 80% of sam-
ples and were up-regulated at least two-fold in one sample
were analyzed by unsupervised hierarchical clustering of
Eisen. The purple bar indicates neutrophils from patients
with MPDs and the yellow bar those from healthy subjects
and the blue bar from healthy subjects given G-CSF.
Journal of Translational Medicine 2009, 7:39 />Page 7 of 17
(page number not for citation purposes)
Serum Protein Levels
The levels of 64 serum proteins were compared in the 6
MPD patients and 7 healthy subjects. The levels of the 64
factors in each of the 6 MPD patients and 7 healthy con-
trols were analyzed by supervised hierarchical clustering
analysis (Figure 6). The MPD samples were characterized
by 33 proteins whose levels were greater than in healthy
subjects. Eleven of these were significantly increased in
MPD patients compared to healthy subjects (t-tests, p <
0.05, Table 6) and included 2 chemokines (CXCL11 and
CCL3), a cytokine (IL-1a), 2 matrix metalloproteinases
(MMPs) (MMP-10 and MMP-13), growth factors (PDGF-
BB and G-CSF) VCAM, TIMP-1, IL-6R and P-selectin.
Expression of Neutrophil Membrane Molecules
Neutrophil expression of CD11b, CD15, CD16, CD18
and CD177 was analyzed by flow cytometry in 24 patients
with MPD (11 PV and 13 ET). JAK2 V617F was detected in
13 of the 24 patients and one was homozygous (Table 7).
Expression was compared to 43 healthy subjects and 27
healthy subjects who were given 5 daily doses of G-CSF.
CD15 and CD18 expression differed among MPD
patients and healthy subjects, but not that of CD11b,
CD16 or CD177. More neutrophils expressed CD15,
Lewis-x, in people with MPD than in healthy subjects (50
± 31% versus 21 ± 25%, p < 0.0002) (Table 7, Figure 7).
This was the case for both subjects with PV and ET. The
proportion of neutrophils expressing CD18 was also
increased in people with MPD (73 ± 26% versus 48 ±
33%, p < 0.003), although the mean neutrophil fluores-
cent intensity was reduced (250 ± 81 versus 451 ± 300, p
< 0.003) (Table 7, Figure 7), but was similar to G-CSF
stimulated neutrophils. Both the proportion of neu-
Gene expression profiling of differentially expressed MPD neutrophil genesFigure 2
Gene expression profiling of differentially expressed MPD neutrophil genes. The 1,006 genes differentially expressed
among 6 MPD patients, 5 healthy subjects and 6 subjects given 5 days of G-CSF (F-test, p < 0.005) were analyzed by hierarchi-
cal clustering of Eisen. Genes in cluster 1 were up-regulated only in MPD neutrophils and those in cluster 2 were down-regu-
lated only in MPD neutrophils. The purple bar indicates neutrophils from patients with MPDs and the yellow bar those from
healthy subjects and the blue bar from healthy subjects given G-CSF.
1.
2.
1. 2.
Journal of Translational Medicine 2009, 7:39 />Page 8 of 17
(page number not for citation purposes)
trophils expressing CD177 and the mean fluorescence
intensity of neutrophils were increased slightly in MPD
neutrophils, but these changes were not significant.
Following G-CSF administration, the expression of CD16
and CD18 as assessed by the mean fluorescence intensity
decreased (Table 7, Figure 7). In contrast, the number of
neutrophils expressing CD177 and the mean fluorescence
intensity of CD177 expression increased.
The expression of several other neutrophil adhesion mol-
ecules, Fc receptors and other antigens were compared in
the same cohort of 6 MPD patients in whom gene and
miR expression profiles and serum proteins were meas-
ured; 4 with PV and 2 with ET. The proportion of neu-
trophils expressing CD64 was greater in MPD patients
than in healthy subjects (13 ± 9% versus 6 ± 4%, p < 0.05)
but not the mean fluorescence intensity (373 ± 73 versus
201 ± 63). There was no difference in the expression of
Panel A. Pathway analysis of differentially expressed MPD genesFigure 3
Panel A. Pathway analysis of differentially expressed MPD genes. Ingenuity pathway analysis showing canonical path-
ways significantly modulated by the genes whose expression differed among the MPD neutrophils compared to healthy subject
neutrophils(p < 0.05). A total of 1,270 genes were differentially expressed: 473 were up-regulated and 800 were down-regu-
lated. Only the 30 pathways with the most significant changes are shown. The p value for each pathway is indicated by the bar
and is expressed as -1 times the log of the p value. The line represents the ratio of the number of genes in a given pathway that
meet the cutoff criteria divided by the total number of genes that make up that pathway. Panel B. Pathway analysis of differen-
tially expressed G-CSF genes. Ingenuity pathway analysis showing canonical pathways significantly modulated by the genes
whose expression differed among the G-CSF-mobilized neutrophils compared to healthy subject neutrophils (p < 0.05). A total
of 909 genes were differentially expressed: 452 were up-regulated and 457 were down-regulated. Only the 30 pathways with
the most significant changes are shown. The p value for each pathway is indicated by the bar and is expressed as -1 times the
log of the p value. The line represents the ratio of the number of genes in a given pathway that meet the cutoff criteria divided
by the total number of genes that make up that pathway.
B Cell Receptor Signaling
GM-CSF Signaling
IL-10 Signaling
Protein Ubiquitination Pathway
Leukocyte Extravasation Signaling
IL-8 Signaling
NRF2-mediated Oxidative Stress Response
Integrin Signaling
VEGF Signaling
Fcγ Receptor-mediated Phagocytosis in MPs
Neurotrophin/TRK Signaling
p53 Signaling
PTEN Signaling
IL-6 Signaling
PI3K/AKT Signaling
Erythropoietin Signaling
Clatrin-mediated Endocytosis
Fc Epsilon RI Signaling
Estrogen Receptor Signaling
Death Receptor Signaling
Regulation of Actin-based Motility by Rho
O-Glycan Biosynthesis
TGF-β² Signaling
Actin Cytoskeleton Signaling
Glucocorticoid Receptor Signaling
GABA Receptor Signaling
Chemokine Signaling
14-3-3-mediated Signaling
Hepatic Fibrosis / Hepatic Stellate Cell Activation
Apoptosis Signaling
Oxidative Phosphorylation
NRF2-mediated Oxidative Stress Response
Glycosaminoglycan Degradation
IL-10 Signaling
Glycolysis/Gluconeogenesis
Eicosanoid Signaling
Mitochondrial Dysfunction
Ubiquinone Biosynthesis
Fcγ Receptor-mediated Phagocytosis in MPs
Pentose Phosphate
Glutathione Metabolism
Chemokine Signaling
Pyruvate Metabolism
Citrate Cycle
Ceramide Signaling
Propanoate Metabolism
Galactose Metabolism
Purine Metabolism
Aryl Hydrocarbon Receptor Signalin
Regulation of Actin-based Motility by Rho
Antigen Presentation Pathway
p53 Signaling
IL-6 Signaling
Estrogen Receptor Signaling
Arachidonic Acid Metabolism
Nicotinate and Nicotinamide Metabolism
α- Adrenergic Signaling
IL-8 Signaling
Caveolar-mediated Endocytosis
EGF Signaling
A
B
Journal of Translational Medicine 2009, 7:39 />Page 9 of 17
(page number not for citation purposes)
Table 3: Genes up-regulated the most in MPD neutrophils compared to those from healthy subjects (p < 0.05, tests)
Gene Fold increase p
Rg9mtd1 PREDICTED: RNA (guanine-9-) methyltransferase domain containing 1 (Rg9mtd1) 4.79 0.00844
HPR haptoglobin-related protein (HPR) 4.55 0.000443
ZDHHC19 zinc finger, DHHC-type containing 19 (ZDHHC19) 4.34 0.00278
ZNF652 zinc finger protein 652 (ZNF652) 3.90 5.90E-05
ADCY3 adenylate cyclase 3 (ADCY3) 3.64 0.0121
PROK2 Prokineticin 2 3.60 0.000166
C19orf59 chromosome 19 open reading frame 59 (C19orf59) 3.33 0.0139
ZFYVE21 zinc finger, FYVE domain containing 21 (ZFYVE21) 3.32 0.00362
CCR1 chemokine (C-C motif) receptor 1 (CCR1) 3.14 0.000335
EGR1 early growth response 1 (EGR1) 3.13 0.0229
ST3GAL4 ST3 beta-galactoside alpha-2,3-sialyltransferase 4 (ST3GAL4) 3.13 0.00225
PADI2 peptidyl arginine deiminase, type II (PADI2) 3.12 2.90E-06
AXUD1 AXIN1 up-regulated 1 (AXUD1) 3.08 0.00546
LOC728488 PREDICTED: similar to Nuclear envelope pore membrane protein POM 121 (Pore membrane protein of 121 kDa) (P145)
(LOC728488)
3.06 0.00241
Transcribed locus, moderately similar to XP_001235777.1 PREDICTED: hypothetical protein [Gallus gallus] 3.04 0.0123
CBS cystathionine-beta-synthase (CBS) 2.97 0.00183
CDNA: FLJ21549 fis, clone COL06253 2.96 0.00649
ACRV1 acrosomal vesicle protein 1 (ACRV1), transcript variant 11. 2.91 0.00574
UPF2 UPF2 regulator of nonsense transcripts homolog (yeast) 2.84 0.0179
GYG1 glycogenin 1 (GYG1) 2.75 0.0146
NTRK2 neurotrophic tyrosine kinase, receptor, type 2 (NTRK2), transcript variant c 2.73 0.00792
LMO4 LIM domain only 4 (LMO4) 2.69 0.000128
MCL1 myeloid cell leukemia sequence 1 (BCL2-related) (MCL1), transcript variant 1 2.67 0.000287
LOC729915 PREDICTED: similar to Nuclear envelope pore membrane protein POM 121 (Pore membrane protein of 121 kDa) (P145)
(LOC729915)
2.57 0.0172
GALNT14 UDP-N-acetyl-alpha-D-galactosamine:polypeptide N-acetylgalactosaminyltransferase 14 (GalNAc-T14) (GALNT14) 2.57 0.00853
FAM69A family with sequence similarity 69, member A (FAM69A) 2.57 0.0446
MED26 Mediator complex subunit 26 2.56 0.0109
C1orf115 chromosome 1 open reading frame 115 (C1orf115) 2.55 0.0309
KIFC3 kinesin family member C3 (KIFC3) 2.54 0.00290
Rg9mtd1 Transcribed locus 2.53 0.0113
Journal of Translational Medicine 2009, 7:39 />Page 10 of 17
(page number not for citation purposes)
Table 4: Genes down-regulated the most in MPD neutrophils compared to those from healthy subjects (p < 0.05, t-tests)
Gene Fold Increase p
TPMT thiopurine S-methyltransferase (TPMT) 6.90 2.14 × 10
-4
CDNA FLJ35883 fis, clone TESTI2008929 4.47 0.00636
ZNF75 zinc finger protein 75 (D8C6) (ZNF75), mRNA. 4.29 3.24 × 10
-3
FAM3B family with sequence similarity 3, member B (FAM3B), transcript variant 2 4.20 2.11 × 10
-3
UBE2D4 ubiquitin-conjugating enzyme E2D 4 (putative) (UBE2D4) 4.10 3.44 × 10
-3
AK2P2 PREDICTED: adenylate kinase 2 pseudogene 2 (AK2P2) 3.63 8.43 × 10
-3
XP_933530.1 PREDICTED: hypothetical protein XP_933530 [Source:RefSeq_peptide_predicted;Acc:XP_933530] 3.61 6.61 × 10
-4
PVRL2 poliovirus receptor-related 2 (herpesvirus entry mediator B) (PVRL2), transcript variant alpha 3.27 0.0418
CDNA FLJ38039 fis, clone CTONG2013934 3.13 9.00 × 10
-7
NFKBIA nuclear factor of kappa light polypeptide gene enhancer in B-cells inhibitor, alpha (NFKBIA) 3.11 4.23 × 10
-3
NFKBIA nuclear factor of kappa light polypeptide gene enhancer in B-cells inhibitor, alpha (NFKBIA) 3.07 5.02 × 10
-3
GADD45B growth arrest and DNA-damage-inducible, beta (GADD45B), mRNA. 3.06 0.0158
PER1 period homolog 1 (Drosophila) (PER1), mRNA. 2.92 6.84 × 10
-3
C9orf89 chromosome 9 open reading frame 89 (C9orf89), mRNA. 2.91 3.51 × 10
-4
DYNC1LI1 dynein, cytoplasmic 1, light intermediate chain 1 (DYNC1LI1) 2.89 2.53 × 10
-3
RYBP RING1 and YY1 binding protein (RYBP) 2.88 7.27 × 10
-3
WRB tryptophan rich basic protein (WRB) 2.85 2.21 × 10
-3
ELA2 elastase 2, neutrophil (ELA2) 2.82 0.0180
CNTNAP3B OTTHUMP00000046146|hypothetical protein LOC389722|novel protein similar to contactin associated protein-like 3
(CNTNAP3)
2.82 6.20 × 10
-6
UBE2E2 ubiquitin-conjugating enzyme E2E 2 (UBC4/5 homolog, yeast) (UBE2E2) 2.80 8.14 × 10
-4
ARL10 ADP-ribosylation factor-like 10 (ARL10) 2.79 6.80 × 10
-3
RPS28 ribosomal protein S28 (RPS28) 2.76 1.28 × 10
-4
C15orf29 chromosome 15 open reading frame 29 (C15orf29) 2.76 9.34 × 10
-3
C20orf199 chromosome 20 open reading frame 199 (C20orf199) 2.71 2.28 × 10
-5
GADD45B Growth arrest and DNA-damage-inducible, beta 2.69 5.09 × 10
-3
NFKBIE nuclear factor of kappa light polypeptide gene enhancer in B-cells inhibitor, epsilon (NFKBIE) 2.66 0.0271
SCARB1 scavenger receptor class B, member 1 (SCARB1), transcript variant 1 2.63 0.0485
TSP50 testes-specific protease 50 (TSP50) 2.62 8.76 × 10
-3
EFR3B PREDICTED: EFR3 homolog B (S. cerevisiae) (EFR3B) 2.60 0.021
MLSTD1 male sterility domain containing 1 (MLSTD1) 2.59 0.0134
Journal of Translational Medicine 2009, 7:39 />Page 11 of 17
(page number not for citation purposes)
CD10, CD31, CD44, CD45, CD55, CD59, and CD62L
among neutrophils from MPD patients and healthy sub-
jects (data not shown).
Discussion
In order to better characterize the molecular basis of
MPDs, we compared gene and miRNA expression profiles
of neutrophils from MPD patients with those from
healthy subjects. We identified several genes and micro-
RNA whose expression differed in MPD neutrophils com-
pared to those of healthy subjects. Since most patients
with PV and approximately half with ET have a gain-of-
function mutation in JAK2, we also compared MPD neu-
trophils with neutrophils from healthy subjects treated
with G-CSF, a hematopoietic growth factor that signals
through JAK2. While there were similarities in gene
expression signatures in MPD neutrophils and G-CSF-
mobilized neutrophils, we also found several differences.
The expression of a greater number of genes was changed
in G-CSF-mobilized neutrophils compared to MPD neu-
trophils. There were also a number of genes whose expres-
sion changed in MPD neutrophils, but not in G-CSF-
mobilized neutrophils. In addition, several microRNAs
were differentially expressed by MPD neutrophils. Many
of these gene and microRNA expression changes were
similar to those found in hypertrophied cells, cancers, and
hematologic malignancies.
Among the microRNA that were down-regulated in MPD
neutrophils were two closely associated down-regulated
microRNA; miR-133a and miR-1. These two miR are
located in the same bicistronic unit on chromosome 18,
are transcribed together [34], and are involved in skeletal
muscle and myocardial muscle differentiation and prolif-
Analysis of differentially expressed MPD neutrophil genes by quantitative real time PCR (RT-PCR)Figure 4
Analysis of differentially expressed MPD neutrophil genes by quantitative real time PCR (RT-PCR). The expres-
sion of five genes NFKBIA, NFKBIE, TNFAIP3, MCL1 and CBS in MPD neutrophils was analyzed by qRT-PCR. The expression
of NFKBIA, NFKBIE, and TNFAIP3 were down-regulated in MPD and G-CSF-mobilized neutrophils. The expression of CBS
was significantly increased in MPD neutrophils. The expression of MCL1 was also increased in MPD neutrophils but the differ-
ence was not significant. The results of analysis by qRT-PCR and gene expression profiling were similar.
Journal of Translational Medicine 2009, 7:39 />Page 12 of 17
(page number not for citation purposes)
eration. The down-regulation of miR-133a and miR-1 is
associated with hypertrophic myocardium and skeletal
muscle [33,37-39]. The suppression of miR-133 has been
shown to induce cardiac hypertrophy [37]. miR-133a
down-regulation has been noted in squamous cell carci-
noma of the tongue [40,41]. In addition, the expression of
miR-1 is also reduced in heptocellular carcinoma [42] and
lung cancer [43]. Down-regulation of these two microR-
NAs may play a role in the proliferation of hematopoietic
cells in MPDs.
Gene expression analysis found that MPD neutrophils
exhibited a pro-inflammation profile. MPD differentially
expressed genes included those involved with B cell, IL-6,
IL-8, VEGF, TGF-β, Fcε RI and integrin signaling pathways.
These changes are not simply due to the constitutive acti-
vation of JAK2 since they were not present in G-CSF-
mobilized neutrophils. Instead, most G-CSF-mobilized
neutrophils differentially expressed genes were in meta-
bolic and synthesis pathways.
Analysis of specific genes whose expression changed in
MPD neutrophils identified several genes in the NF-κB
pathway. Change in expression of 3 of these genes was
confirmed by qRT-PCR. The expression of several NF-κB
genes were increased and several were decreased so the
overall effect on the pathway is not certain, however, the
Analysis of differentially expressed MPD neutrophil microRNA by quantitative real time PCR (qRT-PCR)Figure 5
Analysis of differentially expressed MPD neutrophil microRNA by quantitative real time PCR (qRT-PCR). The
expression of miR-133a and miR-219 were analyzed by qRT-PCR. The expression of miR-133a was down-regulated in both
MPD and G-CSF-mobilized neutrophils while that of miR-219 was up-regulated in MPD and G-CSF-mobilized neutrophils. In
fact, no miR-219 transcripts were detected in neutrophils from healthy subjects. The results of analysis by qRT-PCR and micro-
RNA expression profiling were similar.
Table 5: MPD neutrophil differentially expressed microRNA
(miR)*
Up-regulated miR Down-regulated miR
Description Fold change Description Fold change
hsa-miR-219 4.11 hsa-miR-133a 3.41
hsa-miR-515-5p 2.63 hsa-miR-504 2.73
hsa-miR-142-5p 2.47 hsa-mir-565 2.52
hsa-miR-143 2.43 hsa-miR-1 2.16
hsa-miR-101 2.21 hsa-miR-216 2.14
hsa-miR-424 1.93 hsa-miR-485-5p 1.76
hsa-miR-450 1.92 hsa-miR-483 1.71
hsa-miR-301 1.86 hsa-mir-657 1.62
hsa-miR-33 1.86 hsa-miR-502 1.59
hsa-miR-19b 1.81 hsa-mir-615 1.43
hsa-miR-29b 1.76 hsa-mir-421 1.32
hsa-miR-30a-5p 1.73
hsa-miR-29c 1.70
hsa-miR-185 1.66
hsa-miR-21 1.63
hsa-miR-19a 1.6
hsa-miR-200b 1.48
hsa-miR-542-3p 1.43
hsa-mir-625 1.42
hsa-miR-106b 1.33
hsa-miR-20b 1.31
* p < 0.05 compared to healthy subject neutrophils
Journal of Translational Medicine 2009, 7:39 />Page 13 of 17
(page number not for citation purposes)
NF-κB pathway is likely important in MPD. NF-κB pro-
motes the survival, proliferation, differentiation and sur-
vival of lymphocytes and plasma cells [44,45]. NF-κB is
also activated in chronic myeloid leukemia (CML) [46],
but it has not been reported to be activated in MPDs [44].
In CML increased levels of NF-κB may be a down stream
effect of brc-abl activation [46]. In our studies we also
found that the expression of many NF-κB pathway genes
were changed in neutrophils by G-CSF and it may be that
constitutive activation of JAK2 in MPD results in NF-κB
activation in PV and ET neutrophils.
The expression of CCR1 was increased in MPD patients.
CCR1 is an important leukocyte chemokine receptor for
several ligands including CCL3 or MIP-1α. The levels of
11 serum factors were elevated in ET and PV patients
including CCL3 which can be a chemoattractant to acti-
vated neutrophils. These results suggest that the increased
expression of CCR1 and CCL3 may contribute to the pro-
inflammatory profile of MPD neutrophils.
Changes in serum protein levels and neutrophil antigen
expression in PV and ET patients do not appear to be sim-
ply a result of constitutive activation of neutrophil JAK2.
G-CSF signals through JAK2, but changes in these markers
are different in healthy subjects given G-CSF than those in
MPD patients. The levels of several factors are elevated in
subjects given G-CSF that were not elevated in MPD
patients including E-selectin, L-selectin, MMP-1, MMP-8,
IL-2R, IL-10, IL-2R, TNFR1, hepatocyte growth factor
(HGF) and SAA [16]. In addition several serum factors
were changed in MPD patients that were not changed in
healthy subjects given G-CSF including CXCL11, CCL3,
PDGFBB, IL-1a, TIMP1, and P-selectin [16]. Changes in
the levels of these serum proteins may be due to shedding
Comparison of serum protein levels among MPD patients and healthy subjectsFigure 6
Comparison of serum protein levels among MPD
patients and healthy subjects. Levels of each of the 64
factors were measured by nested ELISA in 6 MPD patients
and 7 healthy subjects and the levels were analyzed by super-
vised hierarchical clustering of Eisen. Higher factor levels
were indicated in red and lower levels in green. Samples
from MPD patients are shown by the purple bar and from
healthy subjects by the yellow bar.
Table 6: Serum factors whose levels differed between MPD patients and healthy subjects.
Factor Healthy Subjects (n = 7) MPD Patients
(n = 6)
P
VCAM 1,707,211 ± 5,080 10,467,524 ± 7,793,493 0.0123
MMP-10 716 ± 195 1,672 ± 854 0.0145
MIP-1α (CCL3) 62.6 ± 9.9 93.5 ± 27.8 0.0185
MMP-13 54.1 ± 63.1 1,181 ± 1091 0.0190
IL-6R 5,215 ± 1,606 8,421 ± 2,684 0.0220
TIMP-1 287,485 ± 89,954 930,916 ± 650,021 0.0209
P selectin 131,558 ± 35,298 527,593 ± 45,1417 0.0249
ITAC (CXCL11) 21.0 ± 13.0 338 ± 330 0.0263
G-CSF 61.1 ± 7.5 109.0 ± 52.9 0.0352
PDGFBB 473.1 ± 239 1,962 ± 1,665 0.0381
IL-1α 11.1 ± 6.5 39.4 ± 32.1 0.0421
Values are expressed as mean ± SD in pg/ml
Journal of Translational Medicine 2009, 7:39 />Page 14 of 17
(page number not for citation purposes)
or internal cellular sequestration of their receptors in
hematopoietic cells, an inability of the receptor to bind
the factor normally, or to increased protein production.
The elevation of many of these proteins could contribute
to the clinical manifestations of ET and PV. Changes in
serum and plasma protein levels have been studied in
patients with PMF which is characterized by bone marrow
myelofibrosis, extramedullary hematopoiesis and the
presence of immature myeloid cells in the peripheral
blood [47]. The release of proteolytic enzymes by PMF
mononuclear cells is thought to contribute to the abnor-
mal trafficking of CD34+ cells in PMF patients by degrad-
ing HPC adhesion molecules expressed on bone marrow
stromal cells and thereby releasing hematopoietic progen-
itor cells (HPCs) into the circulation. The levels of soluble
proteases MMP-9 and neutrophil elastase and VCAM-1
are increased in PMF patients [48]. MMP-9 and elastase
are thought to cleave VCAM-1 expressed by stromal cells
which leads to the disruption of the interaction of VCAM-
1 and very late antigen -4 (VLA-4) expressed by HPCs
resuling in the release of HPCs. The levels of peripheral
blood CD34+ cells are also increased in PV patients and
proteases likely contribute to the mobilization of HPCs in
PV patients. We found that VCAM-1 levels were also
increased in MPD patients as well as the levels of the pro-
teolytic enzymes MMP-13 and MMP-10. The levels of
MMP-9 and MMP-2 were also greater in MPD patients,
but the difference was not significant.
Other factors may also contribute to the increased levels
of circulating HPCs in MPD patients. G-CSF is an impor-
tant mobilizer of HPCs and CD34+ cells. We found that
G-CSF levels were increased in MPD patients. The levels of
CCL3, a chemokine that can mobilize HPCs, were also
increased in the MPD patients. Elevated levels of both G-
CSF and CCL3 may contribute to HPC mobilization in
MPD patients.
We also compared the expression of neutrophil surface
proteins in ET and PV patients and healthy subjects, but
found few differences. Neutrophil expression of CD18
and CD15 was up-regulated in MPD patients. Others have
found that the expression of CD18 and CD11b was up-
regulated on MPD neutrophils [49,50]. CD15 functions
as a neutrophil adhesion molecule [51] and it is expressed
by some types of leukemic cells [52] and by Reed-Stern-
berg cells [53] but its expression has not been previously
analyzed on MPD neutrophils. We confirmed using a
larger sample size the findings of Klippel and colleagues
that the expression of CD177 is not increased although
CD177 mRNA levels are markedly elevated in MPD neu-
trophils [54].
Comparison of MPD and G-CSF-mobilized neutrophil
gene and antigen expression suggests that the changes in
MPD neutrophils differ from those induced by G-CSF.
These differences may be due to MPD-associated changes
in other cell types. While G-CSF primarily affects neu-
trophils and neutrophil precursors, JAK2 V617F is found
in neutrophils, neutrophil precursors, megakaryoctyes
and red cell precursors. It may be that the constitutive acti-
vation of JAK2 in megakaryocytes and/or red cell precur-
Table 7: Comparison of neutrophil expression of CD11b, CD15, CD16, CD18, and CD177 among MPD patients, healthy subjects, and
healthy subjects given G-CSF
Healthy Subjects
(n = 43)
All MPD Patients
(n = 24)
Polycythemia Vera
(n = 11)
Essential Thrombocytosis
(n = 13)
G-CSF-Treated Subjects
(n = 27)
% Reactive cells
CD11b 55 ± 26 54 ± 28 66 ± 27 44 ± 26† 64 ± 24
CD15 21 ± 25 50 ± 31*† 51 ± 31*† 49 ± 33*† 23 ± 29
CD16 81 ± 22 82 ± 19 83 ± 24 82 ± 16 89 ± 5
CD18 48 ± 33 73 ± 26* 73 ± 30* 73 ± 23* 62 ± 35
CD177 53 ± 23 59 ± 28† 59 ± 29† 58 ± 27† 82 ± 26*
Mean Fluorescence Intensity
CD11b 182 ± 51 187 ± 107 171 ± 100 200 ± 115 155 ± 67
CD15 480 ± 284 374 ± 236 373 ± 265 377 ± 221 441 ± 443
CD16 2,946 ± 1,345 2,580 ± 1,138† 2,410 ± 1,430† 2,725 ± 853† 890 ± 336*
CD18 451 ± 300 250 ± 81* 267 ± 100 237 ± 61* 253 ± 107*
CD177 625 ± 383 575 ± 267† 587 ± 251† 566 ± 290† 2,012 ± 1088*
* p < 0.05 compared to healthy subjects
† p < 0.05 compared to subjects given G-CSF
Fluor = fluorescence
Journal of Translational Medicine 2009, 7:39 />Page 15 of 17
(page number not for citation purposes)
sors results in the secretion of factors by these cells that
affects neutrophils.
JAK2 V617F is an important biomarker for MPD, but it
would be useful to identify additional new MPD biomar-
kers. While the levels of 11 serum factors were elevated in
ET and PV patients including VCAM-1, MMP-13, CXCL11,
IL-1a, TIMP-1, PDGF-BB and P-selectin whose levels were
more than 3-fold greater than the levels in healthy sub-
jects, it is not likely that any of these factors can be used
alone as a biomarker for MPD since none was elevated in
all MPD patients. The measurement of a combination of
factors might serve as a useful biomarker for PV or ET,
however, most of the elevated factors are important
inflammatory factors and they are likely to be elevated in
other disorders. Larger studies are needed which compare
the levels of these factors among patients with PV and ET,
healthy subjects, and subjects with other hematologic and
inflammatory diseases to determine if unique combina-
tions of changes in soluble factor levels are characteristic
of these disorders.
Conclusion
This study provides new sights into the molecular changes
in ET and PV. PV and ET neutrophils were characterized by
the down-regulation of miR-1 and miR-133a and changes
in the expression of many genes involved in inflamma-
tion including those in the NF-κB pathway.
Competing interests
The authors declare that they have no competing interests.
Authors' contributions
SS designed the study, performed research, analyzed data
and wrote the paper; PJ designed the study, performed
research, analyzed data and wrote the paper; LC designed
Comparison of the expression of CD15, CD18, and CD177 by neutrophils from MPD patients, healthy subjects, and healthy subjects given G-CSFFigure 7
Comparison of the expression of CD15, CD18, and CD177 by neutrophils from MPD patients, healthy subjects,
and healthy subjects given G-CSF. Neutrophil expression of CD15, CD18, and CD177 was analyzed by flow cytometry in
24 MPD patients and 43 healthy subjects. The results are expressed as a percent of neutrophils that were reactive with each
antibody. The expression of CD15 and CD18 was significantly greater in MPD neutrophils compared to those from healthy
subjects, but there was no difference in the expression of CD15 and CD18 between neutrophils from healthy subjects given G-
CSF and those who were not. The expression of CD177 was increased in G-CSF-mobilized neutrophils compared to unmobi-
lized healthy subject and MPD neutrophils, but there was no difference in CD177 expression between MPD and unmobilized
healthy subject neutrophils.
0
10
20
30
40
50
60
70
80
90
100
Reactive Neutrophils (%)
CD15
CD18
CD177
G-CSF Mobilized
Healthy Subjects
MPD Patients
G-CSF Mobilized
Healthy Subjects
MPD Patients
G-CSF Mobilized
Healthy Subjects
MPD Patients
Journal of Translational Medicine 2009, 7:39 />Page 16 of 17
(page number not for citation purposes)
the study, preformed research, analyzed data and wrote
the paper; JR designed the study, preformed research, and
analyzed data; MB designed the study, analyzed the data
and wrote the paper; NZ preformed research and analyzed
the data; SA preformed research and analyzed the data;
EW designed the study and wrote the paper; JA designed
the study and wrote the paper; GS designed the research
and wrote the paper; and DS designed the study, analyzed
data and wrote the paper.
Acknowledgements
This study was funded by the Department of Transfusion Medicine, Clinical
Center, National Institutes of Health, Bethesda, Maryland, USA
References
1. Levine RL, Pardanani A, Tefferi A, Gilliland DG: Role of JAK2 in the
pathogenesis and therapy of myeloproliferative disorders.
Nat Rev Cancer 2007, 7:673-683.
2. James C, Ugo V, Le Couedic JP, Staerk J, Delhommeau F, Lacout C,
Garcon L, Raslova H, Berger R, Bennaceur-Griscelli A, Villeval JL,
Constantinescu SN, Casadevall N, Vainchenker W: A unique clonal
JAK2 mutation leading to constitutive signalling causes poly-
cythaemia vera. Nature 2005, 434:1144-1148.
3. Levine RL, Wadleigh M, Cools J, Ebert BL, Wernig G, Huntly BJ, Bog-
gon TJ, Wlodarska I, Clark JJ, Moore S, Adelsperger J, Koo S, Lee JC,
Gabriel S, Mercher T, D'Andrea A, Frohling S, Dohner K, Marynen P,
Vandenberghe P, Mesa RA, Tefferi A, Griffin JD, Eck MJ, Sellers WR,
Meyerson M, Golub TR, Lee SJ, Gilliland DG: Activating mutation
in the tyrosine kinase JAK2 in polycythemia vera, essential
thrombocythemia, and myeloid metaplasia with myelofibro-
sis. Cancer Cell 2005, 7:387-397.
4. Baxter EJ, Scott LM, Campbell PJ, East C, Fourouclas N, Swanton S,
Vassiliou GS, Bench AJ, Boyd EM, Curtin N, Scott MA, Erber WN,
Green AR: Acquired mutation of the tyrosine kinase JAK2 in
human myeloproliferative disorders. Lancet 2005,
365:1054-1061.
5. Kralovics R, Passamonti F, Buser AS, Teo SS, Tiedt R, Passweg JR,
Tichelli A, Cazzola M, Skoda RC: A gain-of-function mutation of
JAK2 in myeloproliferative disorders. N Engl J Med 2005,
352:1779-1790.
6. Cario H, Goerttler PS, Steimle C, Levine RL, Pahl HL: The
JAK2V617F mutation is acquired secondary to the predis-
posing alteration in familial polycythaemia vera. Br J Haematol
2005, 130:800-801.
7. Bellanne-Chantelot C, Chaumarel I, Labopin M, Bellanger F, Barbu V,
De Toma C, Delhommeau F, Casadevall N, Vainchenker W, Thomas
G, Najman A: Genetic and clinical implications of the
Val617Phe JAK2 mutation in 72 families with myeloprolifer-
ative disorders. Blood 2006, 108:346-352.
8. Landgren O, Goldin LR, Kristinsson SY, Helgadottir EA, Samuelsson
J, Bjorkholm M: Increased risks of polycythemia vera, essential
thrombocythemia, and myelofibrosis among 24,577 first-
degree relatives of 11,039 patients with myeloproliferative
neoplasms in Sweden. Blood 2008, 112:2199-2204.
9. Levine RL, Gilliland DG: Myeloproliferative disorders.
Blood
2008, 112:2190-2198.
10. Tefferi A, Thiele J, Orazi A, Kvasnicka HM, Barbui T, Hanson CA,
Barosi G, Verstovsek S, Birgegard G, Mesa R, Reilly JT, Gisslinger H,
Vannucchi AM, Cervantes F, Finazzi G, Hoffman R, Gilliland DG,
Bloomfield CD, Vardiman JW: Proposals and rationale for revi-
sion of the World Health Organization diagnostic criteria for
polycythemia vera, essential thrombocythemia, and primary
myelofibrosis: recommendations from an ad hoc interna-
tional expert panel. Blood 2007, 110:1092-1097.
11. Wang E, Miller LD, Ohnmacht GA, Liu ET, Marincola FM: High-fidel-
ity mRNA amplification for gene profiling. Nat Biotechnol 2000,
18:457-459.
12. Jin P, Wang E, Ren J, Childs R, Shin JW, Khuu H, Marincola FM, Stron-
cek DF: Differentiation of two types of mobilized peripheral
blood stem cells by microRNA and cDNA expression analy-
sis. J Transl Med 2008, 6:39.
13. Eisen MB, Spellman PT, Brown PO, Botstein D: Cluster analysis
and display of genome-wide expression patterns. Proc Natl
Acad Sci USA 1998, 95:14863-14868.
14. Dennis G Jr, Sherman BT, Hosack DA, Yang J, Gao W, Lane HC, Lem-
picki RA: DAVID: Database for Annotation, Visualization, and
Integrated Discovery. Genome Biol. 2003, 4(5):P3.
15. Chen C, Ridzon DA, Broomer AJ, Zhou Z, Lee DH, Nguyen JT, Bar-
bisin M, Xu NL, Mahuvakar VR, Andersen MR, Lao KQ, Livak KJ, Gue-
gler KJ: Real-time quantification of microRNAs by stem-loop
RT-PCR. Nucleic Acids Res 2005, 33:e179.
16. Stroncek D, Slezak S, Khuu H, Basil C, Tisdale J, Leitman SF, Marincola
FM, Panelli MC: Proteomic signature of myeloproliferation and
neutrophilia: analysis of serum and plasma from healthy sub-
jects given granulocyte colony-stimulating factor. Exp Hema-
tol 2005, 33:1109-1117.
17. Ross DT, Scherf U, Eisen MB, Perou CM, Rees C, Spellman P, Iyer V,
Jeffrey SS, Van de RM, Waltham M, Pergamenschikov A, Lee JC,
Lashkari D, Shalon D, Myers TG, Weinstein JN, Botstein D, Brown
PO: Systematic variation in gene expression patterns in
human cancer cell lines. Nat Genet 2000, 24:227-235.
18. Wang E, Miller LD, Ohnmacht GA, Mocellin S, Perez-Diez A,
Petersen D, Zhao Y, Simon R, Powell JI, Asaki E, Alexander HR, Duray
PH, Herlyn M, Restifo NP, Liu ET, Rosenberg SA, Marincola FM: Pro-
spective molecular profiling of melanoma metastases sug-
gests classifiers of immune responsiveness. Cancer Res 2002,
62:3581-3586.
19. Basil CF, Zhao Y, Zavaglia K, Jin P, Panelli MC, Voiculescu S, Mandruz-
zato S, Lee HM, Seliger B, Freedman RS, Taylor PR, Hu N, Zanovello
P, Marincola FM, Wang E: Common cancer biomarkers. Cancer
Res 2006, 66:2953-2961.
20. Wang Y, Liu S, Zhu H, Zhang W, Zhang G, Zhou X, Zhou C, Quan L,
Bai J, Xue L, Lu N, Xu N: FRAT1 overexpression leads to aber-
rant activation of beta-catenin/TCF pathway in esophageal
squamous cell carcinoma. Int J Cancer 2008, 123:561-568.
21. Kumar R, Manning J, Spendlove HE, Kremmidiotis G, McKirdy R, Lee
J, Millband DN, Cheney KM, Stampfer MR, Dwivedi PP, Morris HA,
Callen DF: ZNF652, a novel zinc finger protein, interacts with
the putative breast tumor suppressor CBFA2T3 to repress
transcription. Mol Cancer Res 2006, 4:655-665.
22. Holm R, Knopp S, Kumar R, Lee J, Nesland JM, Trope C, Callen DF:
Expression of ZNF652, a novel zinc finger protein, in vulvar
carcinomas and its relation to prognosis. J Clin Pathol 2008,
61:59-63.
23. Murphy NC, Scarlett CJ, Kench JG, Sum EY, Segara D, Colvin EK,
Susanto J, Cosman PH, Lee CS, Musgrove EA, Sutherland RL, Linde-
man GJ, Henshall SM, Visvader JE, Biankin AV: Expression of LMO4
and outcome in pancreatic ductal adenocarcinoma. Br J Can-
cer 2008, 98:537-541.
24. Goerttler PS, Kreutz C, Donauer J, Faller D, Maiwald T, Marz E, Rum-
berger B, Sparna T, Schmitt-Graff A, Wilpert J, Timmer J, Walz G,
Pahl HL: Gene expression profiling in polycythaemia vera:
overexpression of transcription factor NF-E2. Br J Haematol
2005, 129:138-150.
25. Ishiguro H, Tsunoda T, Tanaka T, Fujii Y, Nakamura Y, Furukawa Y:
Identification of AXUD1, a novel human gene induced by
AXIN1 and its reduced expression in human carcinomas of
the lung, liver, colon and kidney. Oncogene 2001, 20:5062-5066.
26. Opferman JT: Life and death during hematopoietic differenti-
ation. Curr Opin Immunol 2007, 19:497-502.
27. Cheng JF, Jack R: CCR1 antagonists. Mol Divers 2008, 12:17-23.
28. Cheng HY, Papp JW, Varlamova O, Dziema H, Russell B, Curfman JP,
Nakazawa T, Shimizu K, Okamura H, Impey S, Obrietan K: micro-
RNA modulation of circadian-clock period and entrainment.
Neuron 2007, 54:813-829.
29. Esau C, Kang X, Peralta E, Hanson E, Marcusson EG, Ravichandran LV,
Sun Y, Koo S, Perera RJ, Jain R, Dean NM, Freier SM, Bennett CF,
Lollo B, Griffey R: MicroRNA-143 regulates adipocyte differen-
tiation. J Biol Chem 2004, 279:52361-52365.
30. Bruchova H, Merkerova M, Prchal JT: Aberrant expression of
microRNA in polycythemia vera. Haematologica 2008,
93:1009-1016.
31. Akao Y, Nakagawa Y, Kitade Y, Kinoshita T, Naoe T: Downregula-
tion of microRNAs-143 and -145 in B-cell malignancies. Can-
cer Sci 2007, 98:1914-1920.
32. Slaby O, Svoboda M, Fabian P, Smerdova T, Knoflickova D, Bednarik-
ova M, Nenutil R, Vyzula R: Altered expression of miR-21, miR-
Publish with BioMed Central and every
scientist can read your work free of charge
"BioMed Central will be the most significant development for
disseminating the results of biomedical research in our lifetime."
Sir Paul Nurse, Cancer Research UK
Your research papers will be:
available free of charge to the entire biomedical community
peer reviewed and published immediately upon acceptance
cited in PubMed and archived on PubMed Central
yours — you keep the copyright
Submit your manuscript here:
/>BioMedcentral
Journal of Translational Medicine 2009, 7:39 />Page 17 of 17
(page number not for citation purposes)
31, miR-143 and miR-145 is related to clinicopathologic fea-
tures of colorectal cancer. Oncology 2007, 72:397-402.
33. Chen JF, Mandel EM, Thomson JM, Wu Q, Callis TE, Hammond SM,
Conlon FL, Wang DZ: The role of microRNA-1 and microRNA-
133 in skeletal muscle proliferation and differentiation. Nat
Genet 2006, 38:228-233.
34. Sempere LF, Freemantle S, Pitha-Rowe I, Moss E, Dmitrovsky E,
Ambros V: Expression profiling of mammalian microRNAs
uncovers a subset of brain-expressed microRNAs with possi-
ble roles in murine and human neuronal differentiation.
Genome Biol 2004, 5:R13.
35. Walden TB, Timmons JA, Keller P, Nedergaard J, Cannon B: Distinct
expression of muscle-specific microRNAs (myomirs) in
brown adipocytes. J Cell Physiol 2009, 218:444-449.
36. Szafranska AE, Davison TS, John J, Cannon T, Sipos B, Maghnouj A,
Labourier E, Hahn SA: MicroRNA expression alterations are
linked to tumorigenesis and non-neoplastic processes in pan-
creatic ductal adenocarcinoma. Oncogene 2007, 26:4442-4452.
37. Care A, Catalucci D, Felicetti F, Bonci D, Addario A, Gallo P, Bang ML,
Segnalini P, Gu Y, Dalton ND, Elia L, Latronico MV, Hoydal M, Autore
C, Russo MA, Dorn GW, Ellingsen O, Ruiz-Lozano P, Peterson KL,
Croce CM, Peschle C, Condorelli G: MicroRNA-133 controls car-
diac hypertrophy. Nat Med 2007, 13:613-618.
38. Luo X, Lin H, Pan Z, Xiao J, Zhang Y, Lu Y, Yang B, Wang Z: Down-
regulation of miR-1/miR-133 contributes to re-expression of
pacemaker channel genes HCN2 and HCN4 in hypertrophic
heart. J Biol Chem 2008, 283:20045-20052.
39. McCarthy JJ, Esser KA: MicroRNA-1 and microRNA-133a
expression are decreased during skeletal muscle hypertro-
phy. J Appl Physiol 2007, 102:306-313.
40. Wong TS, Liu XB, Wong BY, Ng RW, Yuen AP, Wei WI: Mature
miR-184 as Potential Oncogenic microRNA of Squamous
Cell Carcinoma of Tongue. Clin Cancer Res 2008, 14:2588-2592.
41. Wong TS, Liu XB, Chung-Wai HA, Po-Wing YA, Wai-Man NR, Ignace
WW: Identification of pyruvate kinase type M2 as potential
oncoprotein in squamous cell carcinoma of tongue through
microRNA profiling. Int J Cancer 2008, 123:251-257.
42. Datta J, Kutay H, Nasser MW, Nuovo GJ, Wang B, Majumder S, Liu
CG, Volinia S, Croce CM, Schmittgen TD, Ghoshal K, Jacob ST:
Methylation mediated silencing of MicroRNA-1 gene and its
role in hepatocellular carcinogenesis. Cancer Res 2008,
68:5049-5058.
43. Nasser MW, Datta J, Nuovo G, Kutay H, Motiwala T, Majumder S,
Wang B, Suster S, Jacob ST, Ghoshal K: Down-regulation of
micro-RNA-1 (miR-1) in lung cancer. Suppression of tumor-
igenic property of lung cancer cells and their sensitization to
doxorubicin-induced apoptosis by miR-1. J Biol Chem 2008,
283:33394-33405.
44. Okamoto T, Sanda T, Asamitsu K: NF-kappa B signaling and car-
cinogenesis. Curr Pharm Des 2007, 13:447-462.
45. Naugler WE, Karin M: NF-kappaB and cancer-identifying tar-
gets and mechanisms. Curr Opin Genet Dev 2008, 18:19-26.
46. Cilloni D, Martinelli G, Messa F, Baccarani M, Saglio G: Nuclear fac-
tor kB as a target for new drug development in myeloid
malignancies. Haematologica 2007, 92:1224-1229.
47. Barosi G, Viarengo G, Pecci A, Rosti V, Piaggio G, Marchetti M, Fra-
ssoni F: Diagnostic and clinical relevance of the number of cir-
culating CD34(+) cells in myelofibrosis with myeloid
metaplasia. Blood 2001, 98:3249-3255.
48. Xu M, Bruno E, Chao J, Huang S, Finazzi G, Fruchtman SM, Popat U,
Prchal JT, Barosi G, Hoffman R: Constitutive mobilization of
CD34+ cells into the peripheral blood in idiopathic myelofi-
brosis may be due to the action of a number of proteases.
Blood 2005, 105:4508-4515.
49. Burgaleta C, Gonzalez N, Cesar J: Increased CD11/CD18 expres-
sion and altered metabolic activity on polymorphonuclear
leukocytes from patients with polycythemia vera and essen-
tial thrombocythemia. Acta Haematol 2002, 108:23-28.
50. Falanga A, Marchetti M, Evangelista V, Vignoli A, Licini M, Balicco M,
Manarini S, Finazzi G, Cerletti C, Barbui T: Polymorphonuclear
leukocyte activation and hemostasis in patients with essen-
tial thrombocythemia and polycythemia vera. Blood 2000,
96:4261-4266.
51. Gadhoum SZ, Sackstein R: CD15 expression in human myeloid
cell differentiation is regulated by sialidase activity. Nat Chem
Biol 2008, 4:751-757.
52. Derolf AR, Bjorklund E, Mazur J, Bjorkholm M, Porwit A: Expression
patterns of CD33 and CD15 predict outcome in patients
with acute myeloid leukemia. Leuk Lymphoma 2008,
49:1279-1291.
53. Gruss HJ, Kadin ME: Pathophysiology of Hodgkin's disease:
functional and molecular aspects. Baillieres Clin Haematol 1996,
9:417-446.
54. Klippel S, Strunck E, Busse CE, Behringer D, Pahl HL: Biochemical
characterization of PRV-1, a novel hematopoietic cell sur-
face receptor, which is overexpressed in polycythemia rubra
vera. Blood 2002, 100:2441-2448.