báo cáo hóa học:" Physiologic upper limit of pore size in the blood-tumor barrier of malignant solid tumors" ppt
Bạn đang xem bản rút gọn của tài liệu. Xem và tải ngay bản đầy đủ của tài liệu tại đây (1.57 MB, 13 trang )
BioMed Central
Page 1 of 13
(page number not for citation purposes)
Journal of Translational Medicine
Open Access
Research
Physiologic upper limit of pore size in the blood-tumor barrier of
malignant solid tumors
Hemant Sarin*
1,2
, Ariel S Kanevsky
2
, Haitao Wu
3
, Alioscka A Sousa
1
,
Colin M Wilson
3
, Maria A Aronova
1
, Gary L Griffiths
3
, Richard D Leapman
1
and Howard Q Vo
1,2
Address:
1
National Institute of Biomedical Imaging and Bioengineering, National Institutes of Health, Bethesda, Maryland 20892, USA,
2
Radiology and Imaging Sciences Program, Clinical Center, National Institutes of Health, Bethesda, Maryland 20892, USA and
3
Imaging Probe
Development Center, National Heart, Lung, and Blood Institute, National Institutes of Health, Bethesda, Maryland 20892, USA
Email: Hemant Sarin* - ; Ariel S Kanevsky - ; Haitao Wu - ;
Alioscka A Sousa - ; Colin M Wilson - ; Maria A Aronova - ;
Gary L Griffiths - ; Richard D Leapman - ; Howard Q Vo -
* Corresponding author
Abstract
Background: The existence of large pores in the blood-tumor barrier (BTB) of malignant solid
tumor microvasculature makes the blood-tumor barrier more permeable to macromolecules than
the endothelial barrier of most normal tissue microvasculature. The BTB of malignant solid tumors
growing outside the brain, in peripheral tissues, is more permeable than that of similar tumors
growing inside the brain. This has been previously attributed to the larger anatomic sizes of the
pores within the BTB of peripheral tumors. Since in the physiological state in vivo a fibrous
glycocalyx layer coats the pores of the BTB, it is possible that the effective physiologic pore size in
the BTB of brain tumors and peripheral tumors is similar. If this were the case, then the higher
permeability of the BTB of peripheral tumor would be attributable to the presence of a greater
number of pores in the BTB of peripheral tumors. In this study, we probed in vivo the upper limit
of pore size in the BTB of rodent malignant gliomas grown inside the brain, the orthotopic site, as
well as outside the brain in temporalis skeletal muscle, the ectopic site.
Methods: Generation 5 (G5) through generation 8 (G8) polyamidoamine dendrimers were
labeled with gadolinium (Gd)-diethyltriaminepentaacetic acid, an anionic MRI contrast agent. The
respective Gd-dendrimer generations were visualized in vitro by scanning transmission electron
microscopy. Following intravenous infusion of the respective Gd-dendrimer generations (Gd-G5,
N = 6; Gd-G6, N = 6; Gd-G7, N = 5; Gd-G8, N = 5) the blood and tumor tissue pharmacokinetics
of the Gd-dendrimer generations were visualized in vivo over 600 to 700 minutes by dynamic
contrast-enhanced MRI. One additional animal was imaged in each Gd-dendrimer generation group
for 175 minutes under continuous anesthesia for the creation of voxel-by-voxel Gd concentration
maps.
Results: The estimated diameters of Gd-G7 dendrimers were 11 ± 1 nm and those of Gd-G8
dendrimers were 13 ± 1 nm. The BTB of ectopic RG-2 gliomas was more permeable than the BTB
Published: 23 June 2009
Journal of Translational Medicine 2009, 7:51 doi:10.1186/1479-5876-7-51
Received: 27 April 2009
Accepted: 23 June 2009
This article is available from: />© 2009 Sarin et al; licensee BioMed Central Ltd.
This is an Open Access article distributed under the terms of the Creative Commons Attribution License ( />),
which permits unrestricted use, distribution, and reproduction in any medium, provided the original work is properly cited.
Journal of Translational Medicine 2009, 7:51 />Page 2 of 13
(page number not for citation purposes)
of orthotopic RG-2 gliomas to all Gd-dendrimer generations except for Gd-G8. The BTB of both
ectopic RG-2 gliomas and orthotopic RG-2 gliomas was not permeable to Gd-G8 dendrimers.
Conclusion: The physiologic upper limit of pore size in the BTB of malignant solid tumor
microvasculature is approximately 12 nanometers. In the physiologic state in vivo the luminal fibrous
glycocalyx of the BTB of malignant brain tumor and peripheral tumors is the primary impediment
to the effective transvascular transport of particles across the BTB of malignant solid tumor
microvasculature independent of tumor host site. The higher permeability of malignant peripheral
tumor microvasculature to macromolecules smaller than approximately 12 nm in diameter is
attributable to the presence of a greater number of pores underlying the glycocalyx of the BTB of
malignant peripheral tumor microvasculature.
Background
The blood-tumor barrier (BTB) of malignant solid tumor
microvasculature is more permeable to macromolecules
than the endothelial barrier of normal tissue microvascu-
lature of the continuous type[1,2]. This hyper-permeabil-
ity of malignant solid tumor microvasculature to
macromolecules has been attributed to the local release of
vascular permeability factor in tumor tissue[3,4]. The BTB
of malignant solid tumors growing outside the brain in
peripheral tissues and organs is typically more permeable
than the BTB of similar malignant solid tumors growing
in the brain[5,6]. Furthermore, when a malignant periph-
eral tumor, such as a breast cancer tumor, metastasizes to
the brain, an ectopic site, the permeability of the BTB of
the breast cancer tumor growing in the brain is lower than
the BTB of the original tumor in breast tissue, the ortho-
topic site[5]. The brain tissue host site microenvironment
lowers the permeability of the BTB of metastatic malig-
nant peripheral tumors such that it approximates the per-
meability of the BTB of orthotopic brain tumors like
malignant gliomas[7,8].
Various sizes of pores have been identified in the BTB of
malignant solid tumor microvasculature, which is discon-
tinuous[1]. These include trans-endothelial cell fenestra-
tions, caveolae and vesiculo-vacuolar organelles (VVOs)
within endothelial cells, and inter-endothelial cell gaps
between endothelial cells[1,4,9-12]. Based on electron
microscopy, the anatomic pore size of the fenestrations,
caveolae, and VVOs of the BTB of both brain tumors and
peripheral tumors have been reported to range between
40 nm and 200 nm in diameter[10,13,14]. In contrast, the
pore size of inter-endothelial cell gaps within the BTB of
both brain tumors and peripheral tumors is much larger.
In the case of brain tumors, inter-endothelial cell gaps
have been reported to range between 100 nm and 3000
nm in diameter[10,13] and in the case of peripheral
tumors the gaps have been reported to range between 300
nm and 4700 nm[12]. Although the diameters of the
trans-endothelial cell fenestrations, caveolae, and VVOs
are smaller than those of the inter-endothelial cell gaps,
these pores are more numerous than the inter-endothelial
cell gaps in the BTB of brain tumors and peripheral
tumors[4,9,10]. The higher permeability of the BTB of
peripheral tumors compared to the BTB of brain tumors
has been previously attributed to the presence of larger
inter-endothelial gaps in the BTB of peripheral
tumors[12,15].
The pore size within the BTB of malignant solid tumors
has been previously probed in vivo with intra-vital micro-
scopy after the intravenous infusion of particles in the
nanometer size range labeled on the exterior with rhod-
amine, a cationic fluorescent dye[15,16]. Cationic parti-
cles are known to be toxic to the negatively charged
glycocalyx[17,18], which is the fibrous carbohydrate layer
that coats the luminal surface of endothelial cells[19]. As
a result cationic particles have been shown to increase the
permeability of the BTB by disrupting the glycocalyx of the
BTB [20-22]. With intra-vital fluorescence microscopy the
transvascular extravasation of cationic nanoparticles
across the BTB of malignant tumor microvasculature has
been visualized and it has been reported that the upper
limit of pore size within the BTB of malignant brain
tumors ranges between 7 nm and 100 nm, whereas that
the upper limit of pore size within the BTB of peripheral
tumors ranges between 200 nm and 1200 nm[15].
In the case of malignant brain tumors, we recently probed
the upper limit of pore size within the BTB of orthotopic
RG-2 rat gliomas with dynamic contrast-enhanced MRI
using dendrimer nanoparticles labeled on the exterior
with gadolinium (Gd)-diethyltriaminepentaacetic acid
(DTPA), an anionic MRI contrast agent[22]. Based on this
work, we reported that the upper limit of pore size within
the BTB of orthotopic RG-2 rat gliomas in vivo was approx-
imately 12 nm[22]. These previously reported findings
suggest that the impediment to the transvascular extrava-
sation of particles across the BTB of brain tumors is at the
level of the glycocalyx that coats the surface of the pores in
the BTB and is a "nanofilter" for the transvascular flow of
particles across the BTB[23].
Journal of Translational Medicine 2009, 7:51 />Page 3 of 13
(page number not for citation purposes)
It is possible that the physiologic upper limit of pore size
within the BTB of peripheral tumors previously reported
as being between 200 nm and 1200 nm[15] may be a
gross over-estimation of the actual physiologic upper
limit of pore size within the BTB of peripheral solid
tumors. Therefore, if the actual physiologic upper limit of
pore size within the BTB of peripheral tumors is signifi-
cantly lower than what has been previously reported, and
approximates that of the BTB of brain tumors, then this
finding would suggest that more pores in BTB of periph-
eral tumors are the primary reason for the higher permea-
bility of the BTB of malignant peripheral tumors
compared to that of malignant brain tumors. Further-
more, such findings would have important implications
on the size range of therapeutics that could be effectively
delivered across the BTB of malignant solid tumors inde-
pendent of tumor host site.
In our previous dynamic contrast-enhanced MRI-based
work[22], we had characterized the upper limit of pore
size within the BTB of orthotopic RG-2 malignant gliomas
using successively higher generation (G) polyamidoam-
ine (PAMAM) dendrimers labeled with Gd-DTPA. With
dynamic-contrast enhanced MRI, we found there to be
significant positive contrast enhancement of brain tumor
tissue following the intravenous infusion of Gd-G1
through Gd-G7 dendrimers, but not following the intra-
venous infusion of Gd-G8 dendrimers. Based on this
observation, we established that Gd-G8 dendrimers were
larger than the physiologic upper limit of pore size within
the BTB of orthotopic RG-2 gliomas. With this dynamic
contrast-enhanced MRI approach, in addition to being
able to image the tumor tissue pharmacokinetics of Gd-
G1 through Gd-G8 dendrimers, we were also able to
image at the same time the blood pharmacokinetics of the
respective Gd-dendrimer generations in the large vessels
within the brain. We found that the higher generation Gd-
G5 through Gd-G8 dendrimers maintained steady state
blood concentrations over the 120 minute long imaging
session. Since Gd-G5, Gd-G6, and Gd-G7 dendrimers
maintained steady state blood concentrations over the
120 minute imaging session and were permeable to the
BTB of orthotopic RG-2 brain tumors, these higher gener-
ation Gd-dendrimers continued to accumulate within the
tumor tissue extravascular space over time, and remained
there for sufficiently long to localize within individual gli-
oma tumor cells. Although these imaging sessions were
long enough to determine the physiologic upper limit of
pore size in the BTB of orthotopic brain tumors as well as
qualitatively assess the blood half-lives of lower genera-
tion Gd-dendrimers, we were unable to qualitatively
assess the blood half-lives of the higher generation Gd-
dendrimers, since the higher generation Gd-dendrimers
maintained steady state blood concentrations over 120
minutes.
In present study, we imaged the blood and tumor tissue
pharmacokinetics of higher generation Gd-dendrimers
over 600 to 700 minutes in order to characterize the dif-
ferences in the permeability of the BTB of orthotopic and
ectopic RG-2 malignant gliomas and define the upper
limit of pore size within the BTB of brain tumors and
peripheral tumors. We determined the differences in the
permeability of the BTB of an ectopic RG-2 glioma and an
orthotopic RG-2 glioma within the same rat at the same
time. For each animal, RG-2 glioma cells were inoculated
in the right anterior brain, which was the orthotopic site,
and the left temporalis muscle, which was the ectopic site.
The change in blood and tumor tissue Gd concentration,
a surrogate for the Gd-dendrimer concentration, was
determined by calculating the molar relaxivity of the
respective Gd-dendrimer generation in vitro, and the
change in the longitudinal relaxation time before and
after Gd-dendrimer bolus for each imaged volume ele-
ment (voxel) in vivo over time.
Methods
PAMAM dendrimer functionalization and characterization
Bifunctional chelating agents and functionalized gadolin-
ium-benzyl-diethyltriaminepentaacetic acid (Gd-Bz-
DTPA) PAMAM dendrimers were synthesized according
to procedures previously described[22]. With a molar
reactant ratio of = 2:1 bifunctional chelate to dendrimer
surface amine groups, isothiocyanate activated DTPA was
reacted with the amine groups for 48 hours. Gadolinium
was then chelated after the removal of the t-butyl protec-
tive groups on the DTPA. The percent by mass of Gd in
each Gd-dendrimer generation was determined by ele-
mental analysis to be: Gd-G5 (13.2%), Gd-G6 (13.0%),
Gd-G7 (12.3%), and Gd-G8 (11.9%). Gd-G5 and Gd-G6
dendrimer molecular weights were determined by matrix
assisted laser desorption/ionization time-of-flight
(MALDI TOF) mass spectroscopy (Scripps Center for Mass
Spectrometry, La Jolla, CA). Gd percent by mass of the Gd-
dendrimer, in its solid form, was determined with the
inductively coupled plasma-atomic emission spectros-
copy (ICP-AES) method (Desert Analytics, Tucson, AZ).
Gd-dendrimer infusions were normalized to 100 mM
with respect to Gd.
In vitro scanning transmission electron microscopy
For in vitro transmission electron microscopy (TEM)
experiments, a 5 μL droplet of phosphate-buffer saline
solution containing a sample of either Gd-G5, Gd-G6,
Gd-G7 or Gd-G8 dendrimers was adsorbed onto a 3 nm-
thick carbon support film covering lacey carbon electron
microscopy grids. After adsorption for 2 minutes, the grids
were blotted with filter paper to remove excess solution,
washed 5 times with 5 μL aliquots of deionized water, and
left to dry in air. Annular dark-field (ADF) scanning trans-
mission electron microscopy (STEM) images of the Gd-
Journal of Translational Medicine 2009, 7:51 />Page 4 of 13
(page number not for citation purposes)
dendrimers were recorded using a Tecnai TF30 electron
microscope (FEI, Hillsboro, OR, USA) equipped with a
Schottky field-emission gun and an in-column ADF detec-
tor (Fischione, Export, PA, USA). Molecular weight meas-
urements of Gd-G7 and Gd-G8 dendrimers were
performed with a combination STEM and energy-filtered
TEM (EFTEM) imaging approach[24,25].
In vitro magnetic resonance imaging for calculations of
Gd-dendrimer molar relaxivity
From each of the Gd-dendrimer stock solutions to be used
for in vivo imaging, 20 μL of Gd-dendrimer was with-
drawn and diluted in 200 μL microfuge tubes containing
PBS. The final concentrations of each Gd-dendrimer gen-
eration were 0.00 mM, 0.25 mM, 0.50 mM, 0.75 mM and
1.00 mM concentrations with respect to Gd. As an exter-
nal control, Magnevist (Bayer, Toronto, Canada), a form
of Gd-DTPA, was also diluted in 200 μL microfuge tubes
containing PBS at the above concentrations. The micro-
fuge tubes were secured in level and upright positions
within a plastic container filled with deionized ultra pure
water. The container was placed in a 7 cm small animal
solenoid radiofrequency coil (Philips Research Laborato-
ries, Hamburg, Germany), which was then centered
within a 3.0 tesla MRI scanner (Philips Intera; Philips
Medical Systems, Andover, MA). Gd signal intensity meas-
urements were made using a series of T
1
weighted spin
echo sequences with identical T
E
(echo time, 10 ms) but
different T
R
(repetition times; 100 ms, 300 ms, 600 ms,
and 1200 ms). Using the measured Gd signal intensities
and known T
R
and T
E
values, the equilibrium magnetiza-
tion (M
0
) and the longitudinal relaxivity (1/T
1
) values
were determined by non-linear regression (Eq. 1)[26].
The Gd-dendrimer molar relaxivities (r
1
) was calculated
by linear regression (Eq. 2)[26].
The in vitro and in vivo Gd-dendrimer molar relaxivities
were assumed to be equivalent for the purposes of this
work[27].
Orthotopic and ectopic RG-2 glioma induction and animal
preparation for imaging
All animal experiments were approved by the National
Institutes of Health Clinical Center Animal Care and Use
Committee. Cryofrozen pathogen-free RG-2 glioma cells
were obtained from the American Type Culture Collection
(Rockville, MD) and cultured in sterile DME supple-
mented with 10% FBS and 2% penicillin-streptomycin in
an incubator set at 37°C and 5% CO
2
. The anesthesia
route for all animal experiments was isoflurane by inhala-
tion with nose cone, 5% for induction and 1 to 2% for
maintenance. On experimental day 0, the head of anes-
thetized adult male Fischer344 rats (F344) weighing 190
to 200 grams (Harlan Laboratories, Indianapolis, IN) was
secured in a stereotactic frame with ear bars (David Kopf
Instruments, Tujunga, CA). The right brain caudate
nucleus (orthotopic RG-2 glioma)[28] and left temporalis
muscle (ectopic RG-2 glioma) locations were stereotacti-
cally inoculated with 10
5
RG-2 glioma cells in 5 μL of ster-
ile PBS. In each location, the cells were injected over 8
minutes, using a 10 μL Hamilton syringe with a blunt tip
32-gauge needle for the brain inoculate and a sharp tip
26-gauage needle for the temporalis muscle inoculate. On
experimental days 11 to 12, brain imaging of re-anesthe-
tized rats was performed following placement of polyeth-
ylene femoral venous cannula (PE-50; Becton-Dickinson,
Franklin Lakes, NJ) for contrast agent infusion. Gd-den-
drimers were infused at dose of 0.09 mmol Gd/kg.
In vitro magnetic resonance imaging of RG-2 gliomas
For imaging, the animal was positioned supine, with face,
head, and neck snugly inserted into a nose cone within
the 7 cm small animal solenoid radiofrequency coil,
which was then centered within the 3.0 tesla MRI scanner.
Coronal, sagittal, and axial localizer scans were used in
order to identify the coronal plane most perpendicular to
the rat brain dorsum. After orienting the rat brain in the
image volume, a fast spin echo T
2
weighted anatomical
scan was performed. Image acquisition parameters for the
T
2
scan were: T
R
of 6000 ms, T
E
of 70 ms, image matrix of
256 by 256, and slice thickness of 1 mm. In order to quan-
tify contrast agent concentration during post imaging
processing, two separate three-dimensional fast field echo
T
1
weighted scans were performed, one at a 3° low flip
angle (low FA) of and the other at a 12° high flip angle
(high FA). Image acquisition parameters for both scans
were: T
R
of 8.1 ms, T
E
of 2.3 ms, image matrix of 256 by
256, and slice thickness of 1 mm. The low FA scan was
performed over 1.67 min, without any Gd-dendrimer on
board. For the high FA scans, which were the dynamic
scans, the entire brain volume was acquired once every 20
seconds.
At the beginning of the first high FA scan, three to five pre-
contrast brain volumes were acquired to guarantee the
integrity of the T
1
map without contrast agent (T
10
). Fol-
lowing acquisition of the pre-contrast brain volumes, a
0.09 mmol/kg dose of the respective Gd-dendrimer gener-
ation was infused. The Gd-dendrimer was infused as a
slow bolus, over 1 minute, so that the blood pharmacok-
inetics of the respective Gd-dendrimer generation could
be accurately measured during the early time points. The
initial series of high FA dynamic scans were acquired for
15 minutes and subsequent high FA dynamic scans were
acquired over 2 minutes at various time points. For each
SM
T
R
T
T
E
T
=
æ
è
ç
ö
ø
÷
æ
è
ç
ç
ö
ø
÷
÷
-
æ
è
ç
ö
ø
÷
0
1
12
exp exp
(1)
1
1
1
10
1
TT
rGd=+[]
(2)
Journal of Translational Medicine 2009, 7:51 />Page 5 of 13
(page number not for citation purposes)
of the imaging sessions to acquire the Gd signal intensity
data for measurement of the change in blood and tumor
tissue Gd concentration over 600 to 700 minutes, the rat
brains of 2 to 3 rats were imaged as frequently as possible
one after the other, once every 30 to 90 minutes. For each
of subsequent high FA dynamic scan, the animal was re-
anesthetized and re-imaged. For each of the Gd-den-
drimer generations, one additional rat head was imaged
every 10 min following the initial 15 minute dynamic
scan, for a total of 175 minutes, while the animal was
maintained under anesthesia for the duration of the scan-
ning session. This was to image more frequently the
change in Gd signal intensity and produce voxel-by-voxel
Gd concentration maps.
Dynamic contrast-enhanced MRI data processing and
analysis
Imaging data was analyzed using the Analysis of Func-
tional NeuroImaging (AFNI; />)
software suite[29]. Motion correction was performed by
registering each volume of the high FA dynamic scans to
the low FA scan. After volume registration, a T
1
without
contrast (T
10
) map was generated for each voxel by using
the low FA signal data and the mean of the high FA
dynamic scan signal data before contrast enhancement
from the Gd-dendrimer bolus was visualized on the high
FA dynamic scan (Eq. 3)[26].
After generating the T
10
map, a T
1
map was generated for
each voxel of each dynamic image of each high FA
dynamic scan data set after the contrast enhancement. For
the high FA scan data of the 2 minute scan sessions, the
average Gd signal intensity data from the 6 dynamic scans
was used for the T
1
map calculation. Using the T
10
and T
1
signal intensity map values, in addition to the Gd-den-
drimer molar relaxivity value, each Gd signal data set was
converted to a Gd concentration space data set (Eq. 2).
To determine the Gd concentration in the blood and RG-
2 gliomas, blood and tumor voxels, respectively, were
selected on coronal images of the high FA dynamic scan
data sets. The Gd concentration in blood was determined
in the common carotid arteries, since these were the larg-
est caliber brain vessels in the imaging field-of-view. From
within the common carotid arteries, 5 to 10 voxels that
had physiologically reasonable blood T
10
values of
approximately 1100 ms were selected. To determine the
change in blood Gd concentration over time the selected
blood voxels were identified on the co-registered high FA
dynamic scan data sets of the subsequent time points. The
average blood Gd concentration values were then calcu-
lated for each time point.
To determine the Gd concentration in orthotopic and
ectopic RG-2 gliomas, tumor tissue voxels were selected by
identifying the respective tumors on the T
2
weighted ana-
tomical scans in addition to the pattern of positive contrast
enhancement within the tumor tissue extravascular space on
one of the 2 minute high FA dynamic scan data sets acquired
between 175 and 225 minutes, since this was the time frame
of maximal contrast enhancement within the tumor tissue
extravascular space for Gd-G5, Gd-G6, and Gd-G7 den-
drimer animal groups. For the Gd-G8 animal group,
although there was no significant positive contrast enhance-
ment within the tumor tissue extravascular space on the
dynamic scan data sets, the outline of the positive contrast
enhancement within the tumor microvasculature on one of
the dynamic scan data sets acquired between 175 and 225
minutes was sufficient to identify tumor tissue. The selected
orthotopic and ectopic RG-2 glioma tumor tissue voxels rep-
resented the respective whole tumor volumes. To determine
the change in Gd concentration over time, the whole tumor
volumes were then identified on the co-registered high FA
dynamic scan data sets of the other time points. The average
whole tumor Gd concentration values were then calculated
for each time point.
For each Gd-dendrimer generation, the average Gd con-
centrations obtained from the common carotid arteries,
the orthotopic RG-2 glioma, and the ectopic RG-2 glioma
were plotted over time using Matlab (Version 7.1; The
MathWorks Inc, Natick, MA). The pharmacokinetics of
Gd-dendrimers in blood were qualitatively assessed due
to limited number of voxels available from the common
carotid artery for analysis in the context of the known lim-
itations of dynamic contrast-enhanced MRI-based acqui-
sition of arterial input functions.
It was possible to quantify the pharmacokinetics of Gd-
dendrimer generations in tumor tissues over 600 to 700
minutes. Best fit curves were calculated using the Matlab
Curve Fitting Toolbox (Version 1.1.4; The MathWorks
Inc) using a bi-exponential function (Eq. 4).
where
[Gd]
t
= predictive Gd concentration at time t min (mM)
a (mM), b (min
-1
), c (mM), d (min
-1
) = parameters to be
determined for best fit
The first term, ae
bt
, represents the fast initial exponential
rise in Gd concentration and the second term, ce
dt
, repre-
S
ME
E
E
T
R
T
10
10
0
1
10
1
10 10
=
-
()
-
=-
æ
è
ç
ö
ø
÷
sin
cos
exp
q
q
where
(3)
Gd ae ce
t
bt dt
[]
=+
(4)
Journal of Translational Medicine 2009, 7:51 />Page 6 of 13
(page number not for citation purposes)
sents the slow subsequent exponential decay in Gd con-
centration over time. The 95% confidence intervals (CI)
and the root mean squared errors (RMSE) for the ortho-
topic and ectopic RG-2 glioma Gd concentration curve
profiles were calculated.
Results
Physical properties of naked PAMAM and Gd-PAMAM
dendrimer generations
The physical properties of naked PAMAM dendrimers
(Starburst G5-G8, ethylenediamine core; Sigma-Aldrich,
St. Louis, MO) and Gd-DTPA functionalized PAMAM
dendrimers were characterized. Within each dendrimer
generation, the amount of increase in the molecular
weight between the naked dendrimer and the functional-
ized dendrimer is proportional to the percent conjugation
of Gd-DTPA (Table 1). For each successively higher den-
drimer generation, the percent conjugation of Gd-DTPA is
lower due to greater steric hindrance encountered in the
chelation reaction process (Table 1). The Gd-dendrimer
molar relaxivities, which are the constants of proportion-
ality required for calculation of Gd concentration from Gd
signal intensity, ranged between 9.81 and 10.05 1/mM*s
(Table 1).
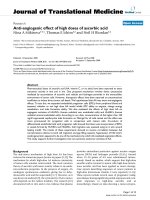
ADF STEM of Gd-G5 through Gd-G8 dendrimers demon-
strated uniformity in particle shape and size within any
particular Gd-dendrimer generation (Figure 1). ADF
STEM confirmed a small increase of approximately 2 nm
in particle diameter between successive generations (Fig-
ure 1). The masses of Gd-G7 and Gd-G8 dendrimers were
sufficient that the sizes and molecular weights of these
Gd-dendrimer generations could be measured by ADF
STEM and STEM-EFTEM, respectively. The molecular
weights and diameters of one hundred Gd-G7 and Gd-G8
dendrimers were measured. The average molecular weight
of Gd-G7 was 283 ± 5 kDa and that of Gd-G8 dendrimers
was 490 ± 5 kDa (mean ± standard error of the mean)
(Table 1). The average diameter of Gd-G7 dendrimers was
10.9 ± 0.7 nm and that of Gd-G8 dendrimers was 12.7 ±
0.7 nm (mean ± standard deviation).
Permeability of the BTB of orthotopic and ectopic RG-2
gliomas to Gd-PAMAM dendrimer generations
Gd-G5 dendrimers extravasated across the BTB of both
orthotopic and ectopic RG-2 gliomas and accumulated
within the respective tumor tissue extravascular spaces
(Figure 2, panels A and E). However, the Gd-G5 dendrim-
ers extravasated to a lesser extent across the BTB of ortho-
topic RG-2 gliomas than the BTB of ectopic RG-2 gliomas
indicating the BTB of orthotopic RG-2 gliomas was less
permeable than the BTB of ectopic RG-2 gliomas. Thus,
the peak Gd concentration of Gd-G5 dendrimers in ortho-
topic tumors was 0.147 mM, whereas the peak Gd con-
centration of Gd-G5 dendrimers in ectopic tumors was
0.195 mM (Table 2, Additional file 1).
Gd-G6 dendrimers also extravasated across the BTB of
both orthotopic and ectopic RG-2 gliomas and accumu-
lated within the respective tumor tissue extravascular
spaces (Figure 2, panels B and F). Gd-G6 dendrimers accu-
mulated to lesser extent than Gd-G5 dendrimers in both
orthotopic and ectopic tumor tissue extravascular spaces.
As was the case for Gd-G5 dendrimers, the Gd-G6 den-
drimers extravasated to a lesser extent across the BTB of
orthotopic RG-2 gliomas than the BTB of ectopic RG-2 gli-
omas, once again indicating the BTB of orthotopic RG-2
gliomas was less permeable than the BTB of ectopic RG-2
gliomas. Thus, the peak Gd concentration of Gd-G6 den-
drimers in orthotopic tumors was 0.106 mM, whereas the
peak Gd concentration of Gd-G6 dendrimers in ectopic
tumors was 0.144 mM.
Gd-G7 dendrimers minimally extravasated across the BTB of
both orthotopic and ectopic RG-2 gliomas and so minimally
accumulated within the respective tumor tissue extravascular
spaces (Figure 2, panels C and G). Gd-G7 dendrimers accu-
mulated to an even lesser extent than Gd-G6 dendrimers in
both orthotopic and ectopic tumor tissue extravascular
spaces. As was the case for Gd-G6 dendrimers, the Gd-G7
dendrimers extravasated to a lesser extent across the BTB of
orthotopic RG-2 gliomas than the BTB of ectopic RG-2 glio-
mas, once again indicating the BTB of orthotopic RG-2 glio-
Table 1: Physical properties of PAMAM and Gd-PAMAM dendrimers
Dendrimer generation
(G)
Terminal amines (#) Naked PAMAM
molecular weight #
(kDa)
Gd-PAMAM dendrimer
molecular weight (kDa)
Gd-DTPA conjugation
(%)
Molar relaxivity&
(1/mM*s)
G5 128 29 79† 52 9.81
G6 256 58 138† 45 10.04
G7 512 116 283‡ 43 9.82
G8 1024 233 490‡ 36 10.05
#molecular weight obtained from Dendritech, Inc.
†molecular weight measured by MALDI TOF MS
‡mean molecular weight measured by ADF STEM and EFTEM
&molar relaxivity of Gd-DTPA measured to be 4.13 1/mM*s
Journal of Translational Medicine 2009, 7:51 />Page 7 of 13
(page number not for citation purposes)
mas was less permeable than the BTB of ectopic RG-2
gliomas. Thus, the peak Gd concentration of Gd-G7 den-
drimers in orthotopic tumors was 0.064 mM, whereas the
peak Gd concentration of Gd-G7 dendrimers in ectopic
tumors was 0.084 mM (Table 2, Additional file 1).
Gd-G8 dendrimers did not extravasate across the BTB of
orthotopic and ectopic RG-2 gliomas. The change in Gd con-
centration over time for both orthotopic and ectopic RG-2
gliomas was similar (Figure 2, panels D and H). The peak Gd
concentrations of Gd-G8 dendrimers in both orthotopic and
ectopic tumors were similar: the peak Gd concentration of
Gd-G8 dendrimers in orthotopic tumors was 0.049 mM and
that in ectopic tumors was 0.052 mM (Table 2, Additional
file 1). The peak Gd concentrations in orthotopic and ectopic
tumors reflect the peak Gd-G8 dendrimer concentrations
within the microvasculature of the respective tumors and not
the extravascular tumor tissue space.
Physiologic upper limit of pore size within the BTB of
orthotopic and ectopic RG-2 gliomas as visualized on Gd
concentration maps
For each of the Gd-dendrimer generations, after the initial
15 minute dynamic scan, the orthotopic and ectopic RG-
2 gliomas of one additional animal were imaged every 10
minutes for a total of 175 minutes, while the animal was
under continuous anesthesia. The Gd concentration maps
from selected dynamic scans of these imaging sessions are
shown in Figure 3. The hemodynamic depression associ-
ated with the continuous anesthesia is reflected in the
lower peak contrast enhancement observed.
Gd-G5 dendrimers readily extravasated across the BTB of
both orthotopic and ectopic RG-2 gliomas and accumu-
lated over time within the respective tumor tissue
extravascular spaces, as evidenced by the significant posi-
tive contrast enhancement over time in the respective
tumor tissues (Figure 3, first row). Gd-G6 dendrimers also
extravasated across the BTB of both orthotopic and
ectopic RG-2 gliomas and accumulated over time within
the respective tumor tissue extravascular spaces (Figure 3,
second row), although to a lesser extent than Gd-G5 den-
drimers (Figure 3, first row).
Gd-G7 dendrimers minimally extravasated across the BTB
of both orthotopic and ectopic RG-2 gliomas and so min-
imally accumulated over time within the respective tumor
tissue extravascular spaces (Figure 3, third row). Gd-G8
dendrimers did not extravasate over time across the BTB of
both orthotopic and ectopic RG-2 gliomas, but instead
Transmission electron microscopy of higher generation Gd-dendrimersFigure 1
Transmission electron microscopy of higher generation Gd-dendrimers. Annular dark-field scanning transmission
electron microscopy (ADF STEM) images of unstained Gd-G5, Gd-G6, Gd-G7, and Gd-G8 dendrimers adsorbed onto an
ultrathin carbon support film. The diameters of one hundred Gd-G7 and Gd-G8 dendrimers were measured. Scale bar = 20
nm.
Table 2: Gd-PAMAM dendrimer peak concentrations in orthotopic RG-2 gliomas versus ectopic RG-2 gliomas*
Gd-dendrimer generation
(G)
Peak concentration in
orthotopic RG-2 gliomas
(mM)
Peak concentration time
point (min)
Peak concentration in
ectopic RG-2 gliomas (mM)
Peak concentration time
point (min)
Gd-G5 0.147 167 0.195 149
Gd-G6 0.106 200 0.144 189
Gd-G7 0.064 75 0.084 107
Gd-G8 0.049 77 0.052 81
*95% confidence intervals (CI) and root mean squared errors (RMSE) for best fit curve concentrations from the bi-exponential function [Gd]
t
=
ae
bt
+ ce
dt
are reported in Additional file 1
Journal of Translational Medicine 2009, 7:51 />Page 8 of 13
(page number not for citation purposes)
remained within the tumor microvasculature, as evi-
denced by the lack of contrast enhancement over time
within the respective tumor tissue extravascular spaces
(Figure 3, fourth row). Therefore, the physiologic upper
limit of pore size within the BTB of both malignant brain
tumors and peripheral solid tumors is equivalent. Since
the diameter of our Gd-G7 dendrimers and Gd-G8 den-
drimers was 10.9 ± 0.7 nm and 12.7 ± 0.7 nm (mean ±
standard deviation), the upper limit of pore size within
the BTB of both orthotopic RG-2 gliomas and ectopic RG-
2 gliomas is approximately 12 nm.
Discussion
In the BTB of malignant solid tumor microvasculature, the
anatomic pore sizes of trans-endothelial cell fenestrations,
caveolae and VVOs range between 40 nm to 200
nm[10,13,14], and the sizes of inter-endothelial cell gaps
range between 100 nm and 4700 nm[10,12,13]. Irrespec-
tive of tumor host site, trans-endothelial cell fenestra-
tions, caveolae, and VVOs are present more often than the
inter-endothelial cell gaps in the BTB of malignant solid
tumors[4,9,10]. Due to host site influence the BTB of
peripheral tumors has more frequent trans-endothelial
cell fenestrations, caveolae and VVOs, and larger inter-
endothelial cell gaps than the BTB of malignant brain
tumor microvasculature[6,10]. The higher permeability of
the BTB of peripheral tumors than that of brain tumors
has been attributed to the larger anatomic pore sizes of the
inter-endothelial cell gaps[12,15]. We reasoned that in the
physiologic state in vivo the intact luminal glycocalyx layer
would be the primary impediment to the transvascular
passage of even small nanoparticles across the BTB of
malignant solid tumors independent of tumor host site.
In this study, with dynamic contrast-enhanced MRI we
imaged the blood and tumor tissue pharmacokinetics of
intravenously infused Gd-PAMAM dendrimer nanoparti-
cles G5 through G8 over 600 to 700 minutes. We com-
pared the permeability of the BTB of RG-2 gliomas grown
within the brain, the orthotopic site, to that of the BTB of
RG-2 gliomas grown outside the brain in the temporalis
skeletal muscle, the ectopic site. We used this animal
model to characterize the differences in the permeability
of the BTB of a malignant brain tumor to that of the BTB
of a peripheral solid tumor, and to define the upper limit
of pore size within the BTB of the respective solid tumors.
Using this approach, we found that the physiologic upper
limit of pore size in the BTB of brain RG-2 gliomas and
peripheral RG-2 gliomas is approximately 12 nm.
In the case of brain RG-2 gliomas, we report here that the
physiologic upper limit of pore size in the BTB of ortho-
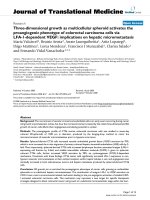
Pharmacokinetics of Gd-dendrimer generations in orthotopic RG-2 gliomas and ectopic RG-2 gliomas over 600 to 700 minutesFigure 2
Pharmacokinetics of Gd-dendrimer generations in orthotopic RG-2 gliomas and ectopic RG-2 gliomas over
600 to 700 minutes. Respective Gd-dendrimer generation was intravenously infused over 1 minute (0.09 mmol Gd/kg) dur-
ing the initial 15 minute dynamic contrast-enhanced MRI scan session. Subsequent dynamic scan sessions of re-anesthetized ani-
mals were conducted at 30 to 90 minute time intervals. Whole tumor tissue Gd concentrations for the orthotopic and ectopic
RG-2 gliomas were calculated for each of the dynamic scan session time points. Shown is the change in the Gd concentration
of respective Gd-dendrimer generations in orthotopic RG-2 gliomas and ectopic RG-2 gliomas over 600 to 700 minutes.
Superimposed is the best fit curve Gd concentration curve for the respective Gd-dendrimer generations. Panels A through D
are orthotopic glioma Gd concentrations over time. Panels E through H are ectopic glioma Gd concentrations over time A.
Gd-G5 (Orthotopic, N = 6), B. Gd-G6 (Orthotopic, N = 6), C. Gd-G7 (Orthotopic, N = 5), D. Gd-G8 (Orthotopic, N = 5), E.
Gd-G5 (Ectopic, N = 6), F. Gd-G6 (Ectopic, N = 6), G. Gd-G7 (Ectopic, N = 5), H. Gd-G8 (Ectopic, N = 5).
Journal of Translational Medicine 2009, 7:51 />Page 9 of 13
(page number not for citation purposes)
topic RG-2 gliomas growing in brain tissue is approxi-
mately 12 nm. Our present finding is in agreement with
our previously reported finding that the upper limit of
pore size in the BTB of orthotopic RG-2 gliomas is approx-
imately 12 nm[22]. Both in our prior and present work,
we probed the upper limit of the pore size within the BTB
with dynamic contrast-enhanced MRI using successively
higher generation Gd-DTPA labeled PAMAM dendrimer
nanoparticles with a neutralized particle exterior. The pos-
itive charge on exterior of the naked PAMAM dendrimer
generations was neutralized by the conjugation of Gd-
DTPA (charge -2) to approximately 40% to 50% of the ter-
minal amines on the exterior. Therefore, the Gd-DTPA
labeled dendrimer generations that were used for this
study would have not been toxic to the negatively charged
glycocalyx overlaying the endothelial cells of the BTB.
In the case of peripheral RG-2 gliomas, we report here that
the physiologic upper limit of pore size in the BTB of
ectopic RG-2 gliomas growing in skeletal muscle is equiv-
alent to the upper limit of pore size in the BTB of ortho-
topic RG-2 gliomas growing in brain tissue, and is also
approximately 12 nm. The physiologic upper limit of pore
size in the BTB of peripheral RG-2 gliomas that we report
here is significantly lower than what has been previously
reported[15]. In the past, the physiologic upper limit of
the pore size within the BTB of orthotopic and ectopic
malignant peripheral tumors has been probed by intra-
vital fluorescence microscopy 24 hours after the intrave-
nous infusion of liposomes and microspheres with a cati-
onic exterior, and it has been reported the upper limit of
the pore size within the BTB of peripheral tumors is
between 200 nm and 1200 nm[15]. This higher upper
limit of pore size would be most likely due to the toxicity
of the cationic liposomes and microspheres to the nega-
tively charged glycocalyx overlaying the endothelial cells
of the BTB. The circulation of cationic particles for 24
hours would be sufficient time to expose the underlying
smaller-sized trans-endothelial cell fenestrations and
VVOs as well as the larger-sized inter-endothelial cell
gaps. The transvascular extravasation of the particles
across the exposed inter-endothelial cell gaps into the
tumor tissue extravascular space, or alternatively, entrap-
ment in the peri-vascular space along the basement mem-
brane would result in the over-estimation of the actual
physiologic upper limit of pore size within the BTB.
We found that Gd-G5, Gd-G6, and Gd-G7 dendrimers
extravasated across the BTB of ectopic RG-2 gliomas as
well as that of orthotopic RG-2 gliomas. However, these
Gd-dendrimer generations extravasated to a greater extent
across the BTB of ectopic RG-2 gliomas than the BTB of
orthotopic RG-2 gliomas, as Gd-G5, Gd-G6, and Gd-G7
dendrimers achieved higher peak concentrations in the
tumor tissue extravascular space of ectopic RG-2 malig-
nant gliomas than in the tumor tissue extravascular space
of orthotopic RG-2 malignant gliomas. Based on these
findings, the BTB of the ectopic RG-2 malignant gliomas
is more permeable than the BTB of orthotopic RG-2
malignant gliomas. The observed higher permeability of
the BTB of ectopic RG-2 gliomas in this animal model
may be in part due to host site dependent differences in
tumor volume, since the tumor volumes of the ectopic
RG-2 gliomas where generally larger than those of the
orthotopic RG-2 gliomas (Figure 4). Although this may be
the case, the higher permeability of BTB of ectopic RG-2
gliomas compared to that of the BTB of orthotopic RG-2
gliomas is consistent with the reported higher permeabil-
ity of the BTB of malignant peripheral tumors compared
to that of the BTB of malignant brain tumors[5,7].
With each successively higher Gd-dendrimer generation
there was an approximately 2 nm increase in Gd-den-
drimer diameter. Although there were relatively small
increases in Gd-dendrimer particle sizes, there were signif-
icant decreases in particle extravasation across the BTB
with increasing Gd-dendrimer generation, irrespective of
RG-2 glioma host site. Gd-G7 dendrimers extravasated
only minimally across the BTB, and the Gd-G8 dendrim-
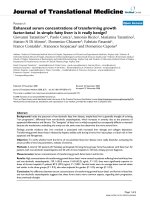
Gd concentration maps of Gd-dendrimer contrast enhance-ment over 175 minutesFigure 3
Gd concentration maps of Gd-dendrimer contrast
enhancement over 175 minutes. For one additional ani-
mal in each Gd-dendrimer generation group the respective
Gd-dendrimer generation was intravenously infused over 1
minute (0.09 mmol Gd/kg) while the animal was maintained
under anesthesia for the duration of the 175 minute dynamic
contrast-enhanced MRI session. Voxel-by-voxel Gd concen-
tration maps were generated. Shown are the voxel-by-voxel
Gd concentration maps for the respective Gd-dendrimer
generations at the 15 minute time point and then at 30
minute time intervals thereafter. First row, Gd-G5 den-
drimer (Orthotopic RG-2 glioma tumor volume, 45 mm
3
;
ectopic RG-2 glioma tumor volume, 113 mm
3
). Second row,
Gd-G6 dendrimer (Orthotopic RG-2 glioma tumor volume,
97 mm
3
; ectopic RG-2 glioma tumor volume, 184 mm
3
).
Third row, Gd-G7 dendrimer (Orthotopic RG-2 glioma
tumor volume, 53 mm
3
; ectopic RG-2 glioma tumor volume,
135 mm
3
). Fourth row, Gd-G8 dendrimer (Orthotopic RG-2
glioma tumor volume, 50 mm
3
; ectopic RG-2 glioma tumor
volume, 163 mm
3
).
Journal of Translational Medicine 2009, 7:51 />Page 10 of 13
(page number not for citation purposes)
ers were large enough that these particles did not extrava-
sate across either the BTB of ectopic RG-2 gliomas or that
of orthotopic RG-2 gliomas. As a result, Gd-G8 dendrim-
ers did not accumulate over time in the respective tumor
tissue extravascular spaces, and instead remained in the
tumor microvasculature. The peak Gd concentrations of
Gd-G8 dendrimers in ectopic RG-2 gliomas and ortho-
topic RG-2 gliomas were similar and reflect the peak Gd-
G8 dendrimer concentrations within the microvascula-
ture of the respective tumors.
We found that the blood half-lives of Gd-G5 and Gd-G6
dendrimers to be longer than those of Gd-G7 and Gd-G8
dendrimers (Figure 5). In case of Gd-G5 and Gd-G6 den-
drimers, the relatively longer blood half-lives are due to
the sizes of these Gd-dendrimer generations being large
enough to evade kidney filtration following transvascular
extravasation across the discontinuous microvasculature
of the glomeruli of the kidneys[30], yet small enough to
evade liver and spleen reticuloendothelial system opsoni-
zation following transvascular extravasation across the
discontinuous microvasculature of the liver and
spleen[31]. Therefore, Gd-G5 and Gd-G6 dendrimers
were not effectively cleared from blood circulation and
had longer blood half-lives than Gd-G7 and Gd-G8 den-
drimers. In the case of Gd-G7 and Gd-G8 dendrimers, due
to the relatively few number of voxels available for analy-
sis and the finite sensitivity of dynamic contrast-enhanced
MRI-based analysis, it was not possible to accurately
detect the relatively small changes in blood Gd concentra-
tion at the latter imaging time points when the Gd-G7 and
Gd-G8 dendrimer generations had been cleared from the
blood circulation (Figure 5, panels C and D). However, it
was possible to qualitatively assess the differences in the
blood half-lives of Gd-G7 and Gd-G8 dendrimers com-
pared to those of the Gd-G5 and Gd-G6 dendrimers. The
blood half-lives of Gd-G7 and Gd-G8 dendrimers were
shorter than those of the Gd-G5 and Gd-G6 dendrimers
likely due to the sizes of these Gd-dendrimers being too
large to evade opsonization by reticuloendothelial system
of the liver and spleen[31]. Even though Gd-G7 dendrim-
ers were small enough to extravasate across the BTB and
Gd-G8 dendrimers were too large to extravasate across the
BTB, both Gd-G7 and Gd-G8 dendrimers were effectively
cleared from blood circulation and had shorter blood
half-lives than Gd-G5 and Gd-G6 dendrimers. These find-
ings suggest that nanoparticles within the size range of
Tumor volumes of orthotopic and ectopic RG-2 gliomas of each Gd-dendrimer generationFigure 4
Tumor volumes of orthotopic and ectopic RG-2 glio-
mas of each Gd-dendrimer generation. Whole tumor
tissue volumes, in mm
3
, were determined for the orthotopic
and ectopic RG-2 gliomas of each of the Gd-dendrimer gen-
eration groups using the T
2
weighted anatomical scans and
dynamic contrast-enhanced MRI data sets as described in the
Methods section. Shown are the average whole tumor vol-
umes of orthotopic and ectopic RG-2 gliomas of each Gd-
dendrimer generation. A. Gd-G5 (Orthotopic, N = 6;
Ectopic, N = 6), B. Gd-G6 (Orthotopic, N = 6; Ectopic, N =
6), C. Gd-G7 (Orthotopic, N = 5; Ectopic, N = 5), D. Gd-G8
(Orthotopic, N = 5; Ectopic, N = 5). Error bars represent
standard deviation.
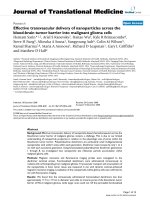
Blood pharmacokinetics of Gd-dendrimer generations over 600 to 700 minutesFigure 5
Blood pharmacokinetics of Gd-dendrimer generations over 600 to 700 minutes. Five to ten voxels were selected
from within the common carotid arteries. For the selected voxels, the average blood Gd concentrations were determined for
each of the dynamic scan session time points. Shown is the change in average blood Gd concentration of the respective Gd-
dendrimer generations over 600 to 700 minutes. A. Gd-G5 (N = 6), B. Gd-G6 (N = 6), C. Gd-G7 (N = 5), D. Gd-G8 (N = 5).
Journal of Translational Medicine 2009, 7:51 />Page 11 of 13
(page number not for citation purposes)
Gd-G5 and Gd-G6 dendrimers would be both permeable
to the BTB of malignant solid tumor microvasculature and
also possess blood half-lives sufficiently long to allow for
particles to effectively accumulate over time within the
tumor tissue extravascular space by the enhanced permea-
tion and retention (EPR) effect[32].
Since the sizes of hydrated dendrimer generations, meas-
ured by small-angle X-ray scattering (SAXS)[33] and
small-angle neutron scattering (SANS)[34], are similar to
the sizes of respective dehydrated and stained dendrimer
generations measured by TEM[35], here we used ADF
STEM to the measure the sizes of the Gd-G7 dendrimers
and Gd-G8 dendrimers dried on ultrathin carbon support
film[24,25]. We found the diameters of the Gd-G7 den-
drimers to be 10.9 ± 0.7 nm and those of the Gd-G8 den-
drimers to be 12.7 ± 0.7 nm (mean ± standard deviation).
Since Gd-G7 dendrimers were permeable to both the BTB
of ectopic RG-2 gliomas and orthotopic RG-2 gliomas, but
the Gd-G8 dendrimers were not, this establishes the effec-
tive physiologic upper limit of pore size in both the BTB
of ectopic RG-2 gliomas and orthotopic RG-2 gliomas as
being approximately 12 nm.
The previously reported higher physiologic upper limit of
pore size in the BTB of malignant solid tumors, based on
intra-vital fluorescence microscopy of tumor tissue 24
hours following the intravenous infusion of cationic nan-
oparticles, appears to have been a gross over-estimation of
the actual physiologic upper limit of pore size. The most
plausible explanation for this is that the positively
charged exterior of the cationic nanoparticles was toxic to
the negatively charged glycocalyx surface coat of the BTB.
We report here, based on dynamic contrast-enhanced MRI
of tumor tissue following the intravenous infusion of neu-
tralized nanoparticles, that the physiologic upper limit of
pore size is much lower, being approximately 12 nm,
when the luminal fibrous glycocalyx of the BTB is main-
tained intact.
The ultrastructure of the glycocalyx has been previously
investigated in frog mesentery capillaries since the mor-
phology of this type of microvasculature is similar to that
of mammalian microvasculature of the continuous type,
for example that of skeletal muscle[36,37]. In such contin-
uous microvasculature, there are small pores in the
endothelial barrier underlying the glycocalyx that allow
for the minimal transvascular extravasation of macromol-
ecules smaller than 4 to 5 nm in diameter across the bar-
rier[38,39]. It has been reported that when the fibrous
meshwork of the glycocalyx layer overlaying these small
pores is enzymatically degraded, then there is an increase
in the transvascular extravasation of macromolecules
across the endothelial barrier[40,41] even though there
are no accompanying anatomic changes in the underlying
pores[41]. Based on such work, it would be reasonable to
speculate that the observed increase in transvascular
extravasation of macromolecules across the endothelial
barrier of continuous microvasculature is a result of an
increase in the physiologic upper limit of pore size in the
barrier due to the disruption of the glycocalyx layer. The
damage that occurs to the glycocalyx of the endothelial
barrier of continuous microvasculature following enzy-
matic degradation would be analogous to that which
occurs to the glycocalyx of the BTB of malignant tumor
microvasculature following prolonged exposure to the
positive exterior of cationic particles.
In the case of the BTB of malignant solid tumor microvas-
culature, we report here that in the physiologic state in vivo
that only particles smaller than approximately 12 nm in
diameter can effectively extravasate across the BTB inde-
pendent of tumor location. Although we found that the
physiologic upper limit of pore size in the BTB of brain
tumors (orthotopic RG-2 gliomas) as well as peripheral
tumors (ectopic RG-2 gliomas) was equivalent, the trans-
vascular extravasation of the permeable particles (i.e. Gd-
G5, Gd-G6, and Gd-G7 dendrimers) was greater across the
BTB of the peripheral tumors. Even though in this work
we did not study the ultrastructure of the glycocalyx of the
BTB of brain and peripheral tumor microvasculature, we
suspect that there are similarities in the arrangement and
spacing of the glycocalyx fibers overlaying the pores
within the BTB of brain and peripheral tumor microvascu-
lature. This would account for the physiologic upper limit
of pore size in the BTB of malignant solid tumor microv-
asculature being equivalent and independent of tumor
location. The higher permeability of the BTB of malignant
peripheral tumors to macromolecules, in this case the Gd-
G5, Gd-G6 and Gd-G7 dendrimer nanoparticles, may
then be explained by the presence of more pores underly-
ing the glycocalyx, which would allow for the transvascu-
lar extravasation of greater numbers of particles smaller
than approximately 12 nm in diameter.
Conclusion
We report here that the physiologic upper limit of pore
size in the BTB of malignant solid tumor microvasculature
is approximately 12 nanometers. Since in the physiologic
state in vivo the fibrous glycocalyx overlays the luminal
surface of the BTB of both brain tumor and peripheral
tumor microvasculature, the physiologic upper limit of
pore size in the BTB of malignant solid tumor microvascu-
lature is equivalent and independent of tumor host site.
The higher permeability of malignant peripheral tumor
microvasculature to macromolecules smaller than
approximately 12 nm in diameter is attributable to the
presence of a greater number of pores underlying the gly-
cocalyx of the BTB of peripheral tumor microvasculature.
Journal of Translational Medicine 2009, 7:51 />Page 12 of 13
(page number not for citation purposes)
Competing interests
The authors declare that they have no competing interests.
Authors' contributions
HS conceptualized and designed overall study; performed
MRI experiments, analyzed MRI data, interpreted overall
study results, and wrote the manuscript. ASK assisted with
MRI experiments, data analysis, and figure preparation.
HW synthesized functionalized dendrimers. AAS charac-
terized functionalized dendrimers with electron micros-
copy. CMW assisted with functionalized dendrimer
synthesis. MAA assisted with electron microscopic den-
drimer characterization. GLG supervised synthesis of the
functionalized dendrimers. RDL supervised characteriza-
tion of functionalized dendrimers with electron micros-
copy. HV assisted with MRI experiments, data analysis,
and figure preparation. All authors read and proofed the
final manuscript.
Additional material
Acknowledgements
This study was funded by the National Institute of Biomedical Imaging and
Bioengineering (NIBIB), and the Radiology and Imaging Sciences Program
(CC).
References
1. Jain RK: Transport of molecules across tumor vasculature.
Cancer Metastasis Rev 1987, 6:559-593.
2. Michel CC: Transport of macromolecules through microvas-
cular walls. Cardiovascular Research 1996, 32:644-653.
3. Senger DR, Perruzzi CA, Feder J, Dvorak HF: A highly conserved
vascular permeability factor secreted by a variety of human
and rodent tumor cell lines. Cancer Research 1986, 46:5629-5632.
4. Roberts WG, Palade GE: Neovasculature induced by vascular
endothelial growth factor is fenestrated. Cancer Res 1997,
57:765-772.
5. Monsky WL, Carreira CM, Tsuzuki Y, Gohongi T, Fukumura D, Jain
RK: Role of host microenvironment in angiogenesis and
microvascular functions in human breast cancer xenografts:
Mammary fat pad versus cranial tumors. Clinical Cancer
Research 2002, 8:1008-1013.
6. Roberts WG, Delaat J, Nagane M, Huang S, Cavenee WK, Palade GE:
Host microvasculature influence on tumor vascular mor-
phology and endothelial gene expression. American Journal of
Pathology 1998, 153:1239-1248.
7. Hasegawa H, Ushio Y, Hayakawa T: Changes of the blood-brain
barrier in experimental metastatic brain tumors. Journal of
Neurosurgery 1983, 59:304-310.
8. Molnar P, Blasberg RG, Horowitz M: Regional blood-to-tissue
transport in RT-9 brain tumors. Journal of Neurosurgery 1983,
58:874-884.
9. Feng D, Nagy JA, Dvorak AM, Dvorak HF: Different Pathways of
Macromolecule Extravasation from Hyperpermeable
Tumor Vessels. Microvascular Research 2000, 59:24-37.
10. Vick NA, Bigner DD: Microvascular abnormalities in virally-
induced canine brain tumors. Structural bases for altered
blood-brain barrier function. J Neurol Sci 1972, 17:29-39.
11. Feng D, Nagy JA, Dvorak HF, Dvorak AM: Ultrastructural studies
define soluble macromolecular, particulate, and cellular
transendothelial cell pathways in venules, lymphatic vessels,
and tumor-associated microvessels in man and animals.
Microscopy Research and Technique 2002, 57:289-326.
12. Hashizume H, Baluk P, Morikawa S, McLean JW, Thurston G, Roberge
S, Jain RK, McDonald DM: Openings between defective
endothelial cells explain tumor vessel leakiness. Am J Pathol
2000, 156:1363-1380.
13. Schlageter KE, Molnar P, Lapin GD, Groothuis DR: Microvessel
organization and structure in experimental brain tumors:
Microvessel populations with distinctive structural and func-
tional properties. Microvascular Research 1999, 58:312-328.
14. Dvorak AM, Kohn S, Morgan ES, Fox P, Nagy JA, Dvorak HF: The
vesiculo-vacuolar organelle (VVO): A distinct endothelial
cell structure that provides a transcellular pathway for mac-
romolecular extravasation. Journal of Leukocyte Biology 1996,
59:100-115.
15. Hobbs SK, Monsky WL, Yuan F, Roberts WG, Griffith L, Torchilin VP,
Jain RK: Regulation of transport pathways in tumor vessels:
role of tumor type and microenvironment. Proc Natl Acad Sci
USA 1998, 95:4607-4612.
16. Lutty GA: The acute intravenous toxicity of biological stains,
dyes, and other fluorescent substances. Toxicology and Applied
Pharmacology 1978, 44:225-249.
17. Hardebo JE, Kahrstrom J: Endothelial negative surface charge
areas and blood-brain barrier function. Acta Physiologica Scandi-
navica 1985, 125:495-499.
18. Lockman PR, Koziara JM, Mumper RJ, Allen DD: Nanoparticle Sur-
face Charges Alter Blood-Brain Barrier Integrity and Per-
meability. Journal of Drug Targeting 2004, 12:635-641.
19. Pries AR, Secomb TW, Gaehtgens P: The endothelial surface
layer. Pflugers Archiv European Journal of Physiology 2000,
440:653-666.
20. Campbell RB, Fukumura D, Brown EB, Mazzola LM, Izumi Y, Jain RK,
Torchilin VP, Munn LL: Cationic charge determines the distri-
bution of liposomes between the vascular and extravascular
compartments of tumors. Cancer Research 2002, 62:6831-6836.
21. Dellian M, Yuan F, Trubetskoy VS, Torchilin VP, Jain RK:
Vascular
permeability in a human tumour xenograft: Molecular
charge dependence. British Journal of Cancer 2000, 82:1513-1518.
22. Sarin H, Kanevsky AS, Wu H, Brimacombe KR, Fung SH, Sousa AA,
Auh S, Wilson CM, Sharma K, Aronova MA, et al.: Effective trans-
vascular delivery of nanoparticles across the blood-brain
tumor barrier into malignant glioma cells. J Transl Med 2008,
6:80.
23. Weinbaum S, Zhang X, Han Y, Vink H, Cowin SC: Mechanotrans-
duction and flow across the endothelial glycocalyx. Proceed-
ings of the National Academy of Sciences of the United States of America
2003, 100:7988-7995.
24. Sousa AA, Leapman RD: Quantitative STEM mass measure-
ment of biological macromolecules in a 300 kV TEM. J Microsc
2007, 228:25-33.
25. Sousa AA, Aronova MA, Wu H, Sarin H, Griffiths GL, Leapman RD:
Determining molecular mass distributions and compositions
of functionalized dendrimer nanoparticles. Nanomedicine 2009,
4:391-399.
26. Haacke EM, Brown RW, Thompson MR, Venkatesan M: Magnetic Res-
onance Imaging: Physical Principles and Sequence Design New York:
Wiley; 1999.
27. Rohrer M, Bauer H, Mintorovitch J, Requardt M, Weinmann HJ:
Comparison of magnetic properties of MRI contrast media
solutions at different magnetic field strengths. Invest Radiol
2005, 40:715-724.
28. Paxinos G, Watson C: The Rat Brain in Stereotaxic Coordi-
nates. 4th edition. New York: Elsevier; 2004.
Additional file 1
95% confidence intervals (CI) and root mean squared errors (RMSE)
for best fit curve concentrations from the bi-exponential function
[Gd]
t
= ae
bt
+ ce
dt
. The data in the table represent the statistical analysis
for the orthotopic and ectopic RG-2 glioma Gd concentration curve profiles
for the respective Gd-dendrimer generations over 600 to 700 minutes. A
best fit was established for each Gd concentration curve profile as indi-
cated by the corresponding low RMSE value. Note: 1 RMSE per profile.
Click here for file
[ />5876-7-51-S1.doc]
Publish with Bio Med Central and every
scientist can read your work free of charge
"BioMed Central will be the most significant development for
disseminating the results of biomedical research in our lifetime."
Sir Paul Nurse, Cancer Research UK
Your research papers will be:
available free of charge to the entire biomedical community
peer reviewed and published immediately upon acceptance
cited in PubMed and archived on PubMed Central
yours — you keep the copyright
Submit your manuscript here:
/>BioMedcentral
Journal of Translational Medicine 2009, 7:51 />Page 13 of 13
(page number not for citation purposes)
29. Cox RW: AFNI: software for analysis and visualization of
functional magnetic resonance neuroimages. Comput Biomed
Res 1996, 29:162-173.
30. Soo Choi H, Liu W, Misra P, Tanaka E, Zimmer JP, Itty Ipe B, Bawendi
MG, Frangioni JV: Renal clearance of quantum dots. Nat Biotech-
nol 2007, 25:1165-1170.
31. Kaminskas LM, Boyd BJ, Karellas P, Henderson SA, Giannis MP, Kripp-
ner GY, Porter CJ: Impact of surface derivatization of poly-L-
lysine dendrimers with anionic arylsulfonate or succinate
groups on intravenous pharmacokinetics and disposition.
Mol Pharm 2007, 4:949-961.
32. Maeda H, Wu J, Sawa T, Matsumura Y, Hori K: Tumor vascular
permeability and the EPR effect in macromolecular thera-
peutics: a review. J Control Release 2000, 65:271-284.
33. Prosa TJ, Bauer BJ, Amis EJ, Tomalia DA, Scherrenberg R: A SAXS
study of the internal structure of dendritic polymer systems.
Journal of Polymer Science Part B: Polymer Physics 1997, 35:2913-2924.
34. Nisato G, Ivkov R, Amis EJ: Size invariance of polyelectrolyte
dendrimers. Macromolecules 2000, 33:4172-4176.
35. Jackson CL, Chanzy HD, Booy FP, Drake BJ, Tomalia DA, Bauer BJ,
Amis EJ: Visualization of dendrimer molecules by transmis-
sion electron microscopy (TEM): Staining methods and cryo-
TEM of vitrified solutions. Macromolecules 1998, 31:6259-6265.
36. Mason JC, Curry FE, White IF, Michel CC: The ultrastructure of
frog mesenteric capillaries of known filtration coefficient. Q
J Exp Physiol Cogn Med Sci. 1979, 64(3):217-224.
37. Bruns RR, Palade GE: Studies on blood capillaries. I. General
organization of blood capillaries in muscle. Journal of Cell Biology
1968, 37:244-276.
38. Michel CC, Curry FE: Microvascular permeability. Physiological
Reviews 1999, 79:703-761.
39. Squire JM, Chew M, Nneji G, Neal C, Barry J, Michel C: Quasi-Peri-
odic Substructure in the Microvessel Endothelial Glycocalyx:
A Possible Explanation for Molecular Filtering?
Journal of Struc-
tural Biology 2001, 136:239-255.
40. Henry CBS, Duling BR: Permeation of the luminal capillary gly-
cocalyx is determined by hyaluronan. Am J Physiol. 1999, 277(2
Pt 2):H508-H514.
41. Adamson RH: Permeability of frog mesenteric capillaries after
partial pronase digestion of the endothelial glycocalyx. Jour-
nal of Physiology 1990, 428:1-13.