Báo cáo hóa học: " Comparison of T-cell receptor repertoire restriction in blood and tumor tissue of colorectal cancer patients" docx
Bạn đang xem bản rút gọn của tài liệu. Xem và tải ngay bản đầy đủ của tài liệu tại đây (985.95 KB, 9 trang )
Ochsenreither et al. Journal of Translational Medicine 2010, 8:35
/>Open Access
RESEARCH
BioMed Central
© 2010 Ochsenreither et al; licensee BioMed Central Ltd. This is an Open Access article distributed under the terms of the Creative Com-
mons Attribution License ( which permits unrestricted use, distribution, and reproduc-
tion in any medium, provided the original work is properly cited.
Research
Comparison of T-cell receptor repertoire restriction
in blood and tumor tissue of colorectal cancer
patients
Sebastian Ochsenreither
1
, Alberto Fusi
1
, Susanne Wojtke
1
, Antonia Busse
1
, Natascha C Nüssler
2
, Eckhard Thiel
1
,
Ulrich Keilholz
1
and Dirk Nagorsen*
1,3,4
Abstract
Several immunotherapeutic approaches rely on antigen-specific T-cells. Restrictions in the T-cell receptor (TCR)
repertoire were reported as indicator of anti-tumor cytotoxic T-lymphocyte (CTL) response in various tumor entities. It
is unclear yet whether a TCR restriction in peripheral blood mirrors the tumor compartment. We compared the
expression of TCR Vβ-families for the quantification of TCR repertoire alterations in blood and tissue samples from
patients with colorectal carcinoma. Blood samples from patients with colorectal carcinoma and healthy volunteers and
tissue samples of normal colonic mucosa and colorectal carcinoma were analyzed. Relative Vβ-family quantification
was performed based on quantitative reverse transcribed PCR. Standard deviation and average mean of the single
families were determined. Two variables describing the degree of Vβ-repertoire restriction were defined. Forty-eight
blood samples and 37 tissue samples were analyzed. TCR repertoire restriction was higher in blood of tumor patients
than in blood of healthy controls (p < 0.05). No difference in the degree of TCR repertoire restriction was found
between carcinoma and unaffected colon tissue. We found no corresponding elevated TCR families among the
different compartments blood, normal colon, and carcinoma tissue of the same patient. In conclusion, we observed a
repertoire restriction in peripheral blood as well as in tumor tissue of cancer patients. However, in tumor tissue,
repertoire alterations were comparable to normal mucosa, suggesting compartment-specific TCR distribution rather
than alterations due to tumor-T-cell interaction questioning the presence of highly restricted clonal T-cell expansions in
colorectal cancer as they have been described in other, assumingly more immunogenic tumor entities.
Background
Understanding the interaction between tumor and
immune system might help improving immunotherapeu-
tic approaches for malignant diseases. T-cells directed
against tumor associated antigens (TAA) could play a key
role in the surveillance of and in the defense against
tumor cells [1]. In fact, spontaneous T-cell responses
against TAAs have been described in peripheral blood,
lymph nodes, and bone marrow of patients with various
malignant diseases prior to immunotherapy [2].
In colorectal cancer (CRC), spontaneous T-cell
responses against several TAAs have been detected in
peripheral blood, particularly in patients with metastatic
disease [3,4]. No evidence was found that these spontane-
ous, peripheral TAA-specific T-cells have an impact on
survival of CRC patients [5]. Therefore, the focus of inter-
est has moved to tumor-infiltrating T cells. CD8+ T-cell
infiltration of CRC is known to be associated with a bet-
ter prognosis, but it is still unknown whether these infil-
trating T cells, in fact, represent expanded tumor specific
T-cell clones [6-13].
In case of unknown or multiple epitopes, the analysis of
TCR repertoire both by FACS and PCR based methods
offers the opportunity to detect oligoclonal expansion of
specific T-cells [14-16]. The dimeric transmembrane T-
cell receptor (TCR) is the central mediator of epitope spe-
cific cytotoxic T-cell activation. Consisting of an α- and a
β-chain in most of the cases, diversity is generated during
T-cell evolution by recombinations of the gene segments
V (variable), in case of the β-chain D (diversity), and J
* Correspondence:
1
Charité, Campus Benjamin Franklin, Department of Hematology and
Oncology, Hindenburgdamm 30, 12200 Berlin, Germany
Full list of author information is available at the end of the article
Ochsenreither et al. Journal of Translational Medicine 2010, 8:35
/>Page 2 of 9
(joining) to a constant chain gene C [17]. V-genes are
grouped in families consisting of genes with sequence
homology of at least 50% [18]. For analysis of the TCR
repertoire, the β-chain is often preferred because of the
lower number of families even if a higher overall variabil-
ity of sequence compared to the α-chain has been
described [19]. Alterations in TCR repertoire can be eval-
uated either by length or sequence analysis of the highly
variable part of the α- or β-chain for each V-family
[14,20-22] or by quantification of the single families by
southern blot, FACS, or quantitative reverse transcribed
PCR (qRT PCR) [23-27].
In cancer research, a restricted TCR repertoire has
been found at the tumor site of various malignant dis-
eases [28-36], and in case of melanoma, a highly
restricted repertoire may be linked to regression during
cytokine therapy [37]. However, it is still a matter of
debate whether a restricted TCR repertoire in peripheral
blood of tumor patients exists and whether such a
peripheral restriction mirrows oligoclonal expansions of
specific T-cells in the tumor compartment [36,38-42].
We used a qRT PCR-based relative Vβ-family quantifi-
cation approach [27] for analysis of TCR Vβ-family
expression. Especially in the gut, lymphocytes bearing γδ
TCR are abundant, which are potentially involved in an
antitumoral response in an MHC-independent manner
[43]. Assessing Vβ-family restriction, clonal expansions
of γδ T-cells are not addressed. Aim of the study was the
application of mathematical markers to describe the
global restriction of the αβ TCR repertoire in the differ-
ent compartments rather than the detection of single
expanded T-cell clones. From this general point of view
we evaluated whether or not significant differences of
TCR repertoire restriction can be detected in samples
from carcinoma patients and healthy controls as well as
in tumor tissue compared to unaffected colonic mucosa.
Materials and methods
Specimen collection
Peripheral blood samples were drawn from patients and
healthy volunteers. Tissue samples both of carcinoma and
unaffected mucosal tissue were collected from patients
affected by CRC undergoing tumor resection. RNA was
extracted from the macroscopic center of the tumor and
from unaffected colonic mucosa at least 5 cm from the
macroscopic border of the malignant lesion. Age, sex, and
in CRC patients TNM and UICC stages were assessed.
Both patients and controls had given informed consent
for the use of their specimens before sampling.
RNA extraction, cDNA synthesis
Total RNA was extracted from peripheral blood mononu-
clear cells (PBMCs) or fresh tissue using TRIzol
®
(Invitro-
gen, Carlsbad, CA, USA) or RNeasy
®
Mini Kit (Qiagen,
Hilden, Germany). Reverse transcription was performed
with Omniscript Reverse Transcriptase
®
(Qiagen) as
described previously [44]. Samples were stored at -20°C.
Quantification of TCR expression
For determination of general TCR expression, the Cα-
chain was quantified on a LightCycler
®
instrument
(Roche, Basel, Switzerland). Values were normalized
using the low-abundance housekeeping gene porpho-
bilinogen deaminidase (PBGD) as previously described
[27]. For each cDNA synthesis reaction (+RT), a control
reaction without reverse transcriptase was performed (-
RT control). Samples with -RT/+RT ratio >0.1 for Cα-
chain or PBGD indicating DNA contamination and/or
RNA degradation were excluded from further analysis.
The aim of our study was the detection of TCR repertoire
restriction due to T-cell expansions associated with sig-
nificant TCR expression of the expanded clones. Low
overall TCR transcription in tissue could lead to putative
oligoclonality due to the generally high sensitivity of PCR
based approaches. Consequently, samples with HAC/
PBGD < 0.1 were excluded from analysis to avoid this
bias.
Relative quantification of Vβ-families
Relative quantification of the expression of a single TCR
Vβ-chain was performed as described [27]. Shortly, qRT
PCRs were performed with a universal reverse primer
and TaqMan probe, both annealing at the constant part of
the β-chain (Cβ), and 28 Vβ-family-specific forward
primers (Vβ-family 1 to 24, Vβ-families 5, 6, 12, 13 subdi-
vided into two subgroups each). Slope of each family spe-
cific reaction was estimated analyzing a dilution series
spanning three orders of magnitude of a cDNA mixture
of diagnostic samples. Calculation of the relative concen-
tration P
j
[%] of a Vβ-family j was carried out using the
formula
with Cp [amplification cycles] is the Crossing point and
[ΔCp/log(concentration)] is the average slope of all fam-
ilies.
Normalization, quantification of Vβ-restriction
The approach calculating relative concentrations of dif-
ferent Vβ-families regarding slopes and crossing points,
as a matter of fact, leads to per-sample normalized values.
P
Cp
j
s
Cp
i
s
i
j
=
−
⎛
⎝
⎜
⎜
⎞
⎠
⎟
⎟
⋅
−
⎛
⎝
⎜
⎞
⎠
⎟
⎡
⎣
⎢
⎢
⎢
⎤
⎦
⎥
⎥
⎥
=
∑
10 100
10
1
28
s
Ochsenreither et al. Journal of Translational Medicine 2010, 8:35
/>Page 3 of 9
A per-family normalization step was added to circumvent
different weighting of family alterations due to different
physiological family expressions and PCR amplification
efficacies. For this purpose, the mean percentage and
standard deviation SD
j
of every Vβ-family j of all analyzed
samples k were determined. It was decided not only to
use PBMCs from blood of healthy donors but all analyzed
samples for normalization leading to more reliable results
comparing repertoire restriction of tissue with blood.
Per-family normalized relative concentration P'
jk
of a fam-
ily j of sample k was calculated as follows:
For estimation of the general degree of alteration in the
Vβ-family repertoire, we defined a variable CD ('cumula-
tive deviation'). For each family j of a sample k, the value
of deviation from the mean percentage of all analyzed
samples was expressed as multitude of SD
j
of this fam-
ily. CD
k
of a sample was defined as sum of the moduli of
these normalized devitions:
P
j
′
=
−
P
P
jk
P
j
SD
j
jk
P
j
CD P
kik
i
=
′
=
∑
||
1
28
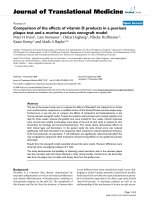
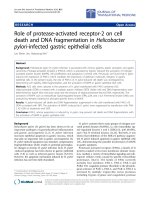
Figure 1 Normalization of the relative concentrations P
j
. Two exemplary samples are shown (PBMCs from peripheral blood of a healthy control:
left, carcinoma tissue: right). Shown are the single steps of normalization: relative concentration P
j
(A), P
j
minus the average value of Family j of all an-
alyzed samples (B), and deviation from average given in fold of standard deviation of the respective family (C). The sum of the modulus' normalized
concentrations of all families of the samples (CD) and the number of families elevated more than average plus two SD n(F) are indicated at the bottom
(D)
Ochsenreither et al. Journal of Translational Medicine 2010, 8:35
/>Page 4 of 9
To accommodate the fact, that in tumor immunological
settings, a mono- or oligoclonal T-cell response is postu-
lated [16], which is supposed to be associated with the
elevation of only a single or very few increased families,
we defined a second marker n(F). For each sample k, the
number n(F) of families was determined, which were
expressed higher than the mean percentage plus two
standard deviations SD
j
(P'
j
> 2). In contrast to CD depict-
ing the sum of expression deviations from the average of
all Vβ-families, only significantly elevated families were
relevant for the value of the second marker n(F). The
applied normalization procedure is depicted exemplary
in Figure 1.
Statistical methods
All statistical tests were performed as two-tailed tests and
a p-value < 0.05 was considered significant. Correlations
were tested by calculation of the Pearson coefficient.
Mann-Whitney U test was applied to unpaired samples,
Wilcoxon test was used for paired samples.
Results
Patients and specimens
Fifty-one samples from peripheral blood (21 samples of
healthy controls and 30 samples from carcinoma
patients) and 58 tissue specimens both from normal
colon tissue of CRC patients and colon carcinoma tissue
were analyzed. Fourteen samples (three from peripheral
blood, five samples of unaffected colon, and six samples
originating from carcinoma tissue) had -RT/+RT ratios >
0.1. Six tissue samples had a HAC/PBGD ratio < 0.1 cor-
responding to minimal TCR expression (one sample of
unaffected colon, five samples of tumor tissue). Alto-
gether 19 Samples fulfilling one or both precondition
were excluded from further analysis. Altogether, 48 blood
and 42 tissue samples were evaluable. In total, samples of
19 healthy donors (peripheral blood) and 40 CRC
patients (peripheral blood: n = 29, healthy colon: n = 24,
carcinoma: n = 18) were analyzed. Characteristics of
patients and healthy controls are depicted in Table 1.
To test the reliability of our normalization approach, we
calculated the theoretically expected percentage of sam-
ples with at least one family elevated more than two SD
(n(F) >0) and compared that value with results from all
samples analyzed. Assuming a symmetric Gaussian dis-
tribution of relative concentrations within a family, the
expected percentage of samples with n(F) >0 would be
49%. Of all 90 samples analyzed, 46 (51%) showed n(F) >0
demonstrating high reliability of our method. Families
with frequently low expression were tested negative more
often than others (negative correlation between average
relative concentrations and the number of negative
PCRs of a family j in all evaluable samples, R
p
= -0.4286, p
= 0.0229). However, after normalization, the absolute
number a family j was considered as elevated (n(F) >0) in
all evaluable samples was independent of the average rel-
ative expression of that family (data not shown).
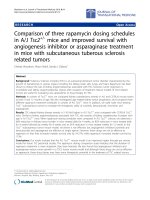
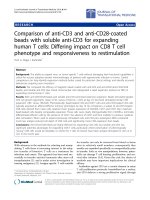
TCR Cα expression in blood and tissue specimens
As expected, Cα (HAC/PBGD) was expressed signifi-
cantly higher in peripheral blood than in tissue (p <
0.0001). HAC/PBGD was higher in blood samples of
healthy volunteers compared to carcinoma patients; but
no difference in Cα-expression was found between unaf-
fected colon and tumor tissue in a paired analysis (Figure
2). These results have to be interpreted with caution
because of the fact that HAC/PBGD was used as criteria
to select samples for further repertoire analysis. Without
excluding samples with HAC/PBGD < 0.1, Cα concentra-
tion was lower in the carcinoma samples than in samples
of unaffected mucosa (paired, p = 0.047).
P
j
P
j
P
j
Table 1: Characteristics of patients and healthy controls
Healthy controls
(n = 19)
CRC patients
(n = 40)
Age (years)
Range 40-63 43-90
Median 54 70
Gender (n)
Male 4 25
Female 15 15
UICC stage (n)
n. d. n.a. 4
14
216
310
46
n. d.: not determined
n.a. not applicable
Ochsenreither et al. Journal of Translational Medicine 2010, 8:35
/>Page 5 of 9
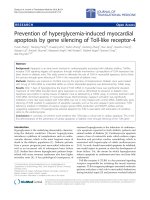
According to the differences of expression between
blood and tissue specimens, analyzing all evaluable sam-
ples irrespective of origin, we found a negative correla-
tion between HAC/PBGD and CD (Figure 3) as well as
HAC/PBGD and n(F) (not shown). However, separate
analysis of the samples originating from blood and origi-
nating from tissue samples resulted in no significant cor-
relations (Figure 3 and not shown).
Vβ repertoire restriction in peripheral blood
TCR repertoire analysis of PBMCs from 19 healthy
donors and 29 colon carcinoma patients showed in 16 out
of 48 samples one or more families with P
j
' >2 (2 out of 19
samples from healthy donors (11%), 14 out of 29 samples
from cancer patients (48%)) reflecting an non-normalized
expression of one or more families higher than the mean
percentage plus two standard deviations SD
j
(n(F) >0).
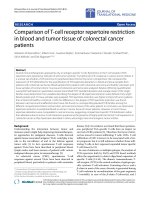
In the statistical analysis, both CD and n(F) were higher
in PBMCs from cancer patients than in PBMCs from
healthy volunteers (unpaired, p
CD
= 0.0316, p
n(F)
= 0.0195,
Figure 2B).
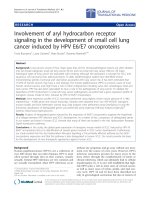
Vβ repertoire in tissue samples of CRC patients
Twenty-four samples of normal colon tissue and 18 carci-
noma samples were evaluable. The statistical analysis of
both CD and n(F) comparing all tissue samples (carci-
P
j
Figure 2 Relative Cα concentrations (HAC/PBGD) of the analyzed samples. (A) HAC/PBGD was significantly higher in blood samples (healthy
controls and carcinoma patients) compared to tissue samples (unaffected colon and carcinoma tissue, ** p < 0.0001). (B) HAC/PBGD was higher in
blood samples of healthy controls than in samples of carcinoma patients (* p = 0.0235, unpaired). No difference in HAC/PBGD was detected comparing
tissue samples of unaffected colon with samples of carcinoma tissue (p = 0.1147, paired).
Ochsenreither et al. Journal of Translational Medicine 2010, 8:35
/>Page 6 of 9
noma and unaffected colon) with all blood samples
(healthy controls and carcinoma patients) showed a sig-
nificantly higher repertoire restriction in tissue than in
blood (unpaired, p
CD
< 0.001, p
n(F)
< 0.001, Figure 4A).
However, no difference was observed between samples of
unaffected colon and carcinoma tissue (paired, p
CD
=
0.471, p
n(F)
= 0.2783, Figure 4C).
Comparison of elevated families in different compartments
For 16 patients, samples of tumor and tumor free colon
were available. In the carcinoma samples, altogether 30
families were elevated (0-5 families per patient). In the
corresponding samples of unaffected colon tissue, 14
families were elevated (0-4 families per patient). In only
two of these patients a single family was elevated in both
tumor tissue and corresponding unaffected colon. For
nine CRC patients, blood and tumor samples were avail-
able. Four of these patients had elevated families in
peripheral blood, but none of these families was elevated
in the corresponding tumor sample. Please refer to figure
4.
Discussion
In this study, TCR Vβ-family repertoire restrictions in
blood and tissue of patients with colorectal carcinoma
were compared using high throughput relative quantifi-
cation of TCR Vβ-families based on qRT PCR technol-
ogy. While a multitude of mathematical approaches have
been established to describe the degree of repertoire
restriction in single V-families from spectratype/
immunoscope data (reviewed in [45]), to our knowledge,
a model to describe global TCR repertoire restriction
based on V-family quantification has not been published
so far.
Colorectal carcinoma is thought to be of limited immu-
nogenicity. Nevertheless, global Vβ-repertoire restriction
degree in blood reflected by the CD and n(F) values was
significantly higher in carcinoma patients confirming the
results of former studies investigating Vβ-repertoire
restrictions in blood of patients with other tumor entities,
which have been interpreted as indication for the induc-
tion of specific clones reactive to autologous tumor
[26,42]. In fact, this TCR repertoire restriction in tumor
patients might be attributed to cumulative Vβ-alterations
caused by discrete epitope-specific T-cell expansions
triggered by several different antigens. Because of the
epitope-independency of the assay, unspecific antigen
confrontation due to barrier disruption as postulated in
the context of other tumor entities [28,32] causing addi-
tional repertoire alterations can not be excluded. We
observed a difference of Cα-chain expression between
healthy controls and carcinoma patients, which could
have impact on the TCR Vβ restriction grade. It remains
elusive whether or not this difference is a result of the
malignant disease or the higher median age of the patient
cohort compared to the healthy control group.
Corresponding significant TCR Vβ-family elevations in
blood and tumor tissue were not found in the present
study. From previous analyses in colorectal cancer, we
know, that TAA-specific T-cells circulated with frequen-
cies lower than 1% of CD8+ cells without proven clonality
[3]. As anticipated, the proportion of peripheral TAA-
specific T-cells was too low to be detected by TCR Vβ-
quantification due to physiological variation of the rela-
tive Vβ-family expressions. Assuming several TAAs,
expansions of T-cell clones would affect various Vβ-fami-
lies additionally reducing sensitivity of the relative Vβ-
quantification regarding single family percentages. It is
purely speculative to assume that such a specific T cell
clone might be trapped at the tumor site and is therefore,
not detectable in the peripheral blood.
In carcinoma tissues, we did not observe an elevated
repertoire restriction compared to corresponding tissue
of unaffected colon. Infiltration of CTLs in colon carci-
noma tissue had been identified as prognostic factor sug-
gesting TAA associated CTL activation [12].
Interestingly, we found no difference in the expression of
Cα comparing healthy colon and carcinoma tissue. These
inconsistent observations could be explained by recent
results of Salama et al., who showed, that CD8+ CTL
Figure 3 Correlation between relative Cα expression (HAC/PBGD)
and cumulative deviation CD. According to the higher HAC/PBGD
expression in blood samples compared to tissue specimens, we found
a strong negative correlation between HAC/PBGD and CD analyzing all
specimens irrespective of origin (regression line, R
p
= -0.4004, p =
0.0003). Regarding samples from blood (empty diamonds) and tissue
(filled diamonds) separately, no correlations between the mentioned
parameters were determined (R
p, blood
= -0.1108, p
blood
= 0.4585, R
p, tissue
= 0.01344, p
tissue
= 0.9286).
Ochsenreither et al. Journal of Translational Medicine 2010, 8:35
/>Page 7 of 9
density is reduced but CD4+/CD25+/FoxP3+ T regulator
cells are elevated in colon cancer compared to normal
colon tissue [46,47]. The fact that clonal CTL expansions
are not principally associated with restrictions in Vβ-
family usage of the T regulatory cell population of the
same compartment [42,47] might explain the absence of
TCR restriction differences between healthy colon and
CRC tissue. Independently of these considerations, we
have to conclude that the present molecular quantitative
TCR analysis is not suitable for the identification of local
expansions in colorectal cancer tissue (if they exist) com-
pared to normal colon tissue. This may differ in other
compartments and/or for other tumor entities.
Regarding p-values comparing the different sample
groups (blood of healthy controls, blood of carcinoma
patients, unaffected colonic mucosa, carcinoma tissue)
one has to keep in mind the differences in sample sizes
and applied tests. The highly significant difference in CD
between blood and tissue samples but the absence of a
significant difference between unaffected colon and
tumor tissue does not necessarily mean hat there would
be no difference to detect if we would compare the same
sample size of tissue samples as we used for comparing
tissue with blood samples (48 vs 42 instead of 24 vs 18).
Regarding the repertoire restriction in blood (healthy vs
carcinoma patients) and tissue (unaffected colon mucosa
vs carcinoma tissue), the results of the two statistical tests
cannot directly be compared because of differences in
distribution, range, and dependency of the data sets.
However comparing tumor tissue to unaffected mucosa,
we observed an even lower median value in carcinoma
tissue. Consequently, the absence of a significantly higher
Vβ restriction in tumor tissue must not be attributed to
the slightly smaller sample size compared to the blood
samples.
Taken together, we observed an increased TCR reper-
toire restriction in blood of colorectal carcinoma patients
compared to blood of healthy controls using qRT-PCR
Figure 4 Statistical comparison of repertoire restriction degree measured in CD and n(F). Compared were samples from blood with tissue (both
normal colon and carcinoma, A), blood from healthy controls with blood from carcinoma patients (B), and tumor free colon with carcinoma samples
both originating from CRC patients (C). * p < 0.05, ** p < 0.01.
Ochsenreither et al. Journal of Translational Medicine 2010, 8:35
/>Page 8 of 9
based Vβ-family quantification. A similar degree of TCR
restriction in colorectal carcinoma tissue in comparison
to normal colon tissue contrasts with the phenomenon of
high proliferative oligoclonal expansions of specific T-cell
populations as described for highly immunogenic malig-
nancies such as melanoma [16].
Competing interests
The authors declare that they have no competing interests.
Authors' contributions
SO conceived of the study, developed and supervised the molecular analyses
carried out in this trial, performed the statistical analysis and drafted the manu-
script.
AF carried out molecular measurements and analyses, and statistical analyses.
SW collected samples and carried out molecular measurements.
AB carried out molecular measurements and analyses.
NCN collected samples and participated in the conduct of the study.
ET participated in design and conduct of the study.
UK participated in design and conduct of the study.
DN conceived of the study, coordinated the study and drafted the manuscript.
All authors have read and approved the final manuscript.
Acknowledgements
The work was supported by grants from the German Research Foundation
(Deutsche Forschungsgemeinschaft, DFG NA 716/1-1 to DN).
Author Details
1
Charité, Campus Benjamin Franklin, Department of Hematology and
Oncology, Hindenburgdamm 30, 12200 Berlin, Germany,
2
Department of
General and Visceral Surgery, Klinikum Neuperlach, Städtisches Klinikum
München, Oskar-Maria-Graf Ring 51, 81737 Munich, Germany,
3
University of
Heidelberg, Medizinische Fakultät Mannheim, Department of Hematology/
Oncology, Theodor-Kutzer-Ufer 1, 68167 Mannheim, Germany and
4
Micromet
AG, Staffelseestr 2, 81477 Munich, Germany
References
1. Zitvogel L, Tesniere A, Kroemer G: Cancer despite immunosurveillance:
immunoselection and immunosubversion. Nat Rev Immunol 2006,
6:715-27.
2. Nagorsen D, Scheibenbogen C, Marincola FM, Letsch A, Keilholz U:
Natural T cell immunity against cancer. Clin Cancer Res 2003,
9:4296-303.
3. Nagorsen D, Keilholz U, Rivoltini L, Schmittel A, Letsch A, Asemissen AM,
Berger G, Buhr HJ, Thiel E, Scheibenbogen C: Natural T-cell response
against MHC class I epitopes of epithelial cell adhesion molecule, her-
2/neu, and carcinoembryonic antigen in patients with colorectal
cancer. Cancer Res 2000, 60:4850-4.
4. Arlen P, Tsang KY, Marshall JL, Chen A, Steinberg SM, Poole D, Hand PH,
Schlom J, Hamilton JM: The use of a rapid ELISPOT assay to analyze
peptide-specific immune responses in carcinoma patients to peptide
vs. recombinant poxvirus vaccines. Cancer Immunol Immunother 2000,
49:517-29.
5. Nagorsen D, Scheibenbogen C, Letsch A, Germer CT, Buhr HJ, Hegewisch-
Becker S, Rivoltini L, Thiel E, Keilholz U: T cell responses against tumor
associated antigens and prognosis in colorectal cancer patients. J
Transl Med 2005, 3:3.
6. Ropponen KM, Eskelinen MJ, Lipponen PK, Alhava E, Kosma VM:
Prognostic value of tumour-infiltrating lymphocytes (TILs) in colorectal
cancer. J Pathol 1997, 182:318-24.
7. Naito Y, Saito K, Shiiba K, Ohuchi A, Saigenji K, Nagura H, Ohtani H: CD8+ T
cells infiltrated within cancer cell nests as a prognostic factor in human
colorectal cancer. Cancer Res 1998, 58:3491-3494.
8. Oberg A, Samii S, Stenling R, Lindmark G: Different occurrence of CD8+,
CD45R0+, and CD68+ immune cells in regional lymph node
metastases from colorectal cancer as potential prognostic predictors.
Int J Colorectal Dis 2002, 17:25-9.
9. Diederichsen AC, Hjelmborg JB, Christensen PB, Zeuthen J, Fenger C:
Prognostic value of the CD4+/CD8+ ratio of tumour infiltrating
lymphocytes in colorectal cancer and HLA-DR expression on tumour
cells. Cancer Immunol Immunother 2003, 52:423-8.
10. Funada Y, Noguchi T, Kikuchi R, Takeno S, Uchida Y, Gabbert HE:
Prognostic significance of CD8+ T cell and macrophage peritumoral
infiltration in colorectal cancer. Oncol Rep 2003, 10:309-13.
11. Chiba T, Ohtani H, Mizoi T, Naito Y, Sato E, Nagura H, Ohuchi A, Ohuchi K,
Shiiba K, Kurokawa Y, Satomi S: Intraepithelial CD8+ T-cell-count
becomes a prognostic factor after a longer follow-up period in human
colorectal carcinoma: possible association with suppression of
micrometastasis. Br J Cancer 2004, 91:1711-7.
12. Galon J, Costes A, Sanchez-Cabo F, Kirilovsky A, Mlecnik B, Lagorce-Pagès
C, Tosolini M, Camus M, Berger A, Wind P, Zinzindohoué F, Bruneval P,
Cugnenc PH, Trajanoski Z, Fridman WH, Pagès F: Type, density, and
location of immune cells within human colorectal tumors predict
clinical outcome. Science 2006, 313:1960-4.
13. Loddenkemper C, Schernus M, Noutsias M, Stein H, Thiel E, Nagorsen D: In
situ analysis of FOXP3+ regulatory T cells in human colorectal cancer. J
Transl Med 2006, 4:52.
14. Pilch H, Höhn H, Freitag K, Neukirch C, Necker A, Haddad P, Tanner B,
Knapstein PG, Maeurer MJ: Improved assessment of T-cell receptor (TCR)
VB repertoire in clinical specimens: combination of TCR-CDR3
spectratyping with flow cytometry-based TCR VB frequency analysis.
Clin Diagn Lab Immunol 2002, 9:257-66.
15. Nagorsen D, Wang E, Marincola FM, Even J: Transcriptional analysis of
tumor-specific T-cell responses in cancer patients. Crit Rev Immunol
2002, 22:449-62.
16. Thor Straten P, Schrama D, Andersen MH, Becker JC: T-cell clonotypes in
cancer. J Transl Med 2004, 2:11.
17. Davis MM, Bjorkman PJ: T cell antigen receptor genes and T-cell
recognition. Nature 1988, 334:395-402.
18. Arden B, Clark SP, Kabelitz D, Mak TW: Human T-cell receptor variable
gene segment families. Immunogenetics 1995, 42:455-500.
19. Maciejewski JP, O'Keefe C, Gondek L, Tiu R: Immune-mediated bone
marrow failure syndromes of progenitor and stem cells: molecular
analysis of cytotoxic T cell clones. Folia Histochem Cytobiol 2007, 45:5-14.
20. Long SA, Khalili J, Ashe J, Berenson R, Ferrand C, Bonyhadi M:
Standardized analysis for the quantification of Vbeta CDR3 T-cell
receptor diversity. J Immunol Methods 2006, 317:100-113.
21. Thor Straten P, Barfoed A, Seremet T, Saeterdal I, Zeuthen J, Guldberg P:
Detection and characterization of alpha-beta-T-cell clonality by
denaturing gradient gel electrophoresis (DGGE). Biotechniques 1998,
25:244-250.
22. Collette A, Cazenave P-A, Pied S, Six A: New methods and software tools
for high throughput CDR3 spectratyping. Application to T lymphocyte
repertoire modifications during experimental malaria. J Immunol
Methods 2003, 278:105-116.
23. Willhauk M, Möhler T, Scheibenbogen C, Pawlita M, Brossart P, Schmier
JW, Keilholz U: T-cell receptor beta variable region diversity in
melanoma metastases after interleukin 2-based immunotherapy. Clin
Cancer Res 1996, 2:767-772.
24. Brewer JL, Ericson SG: An improved methodology to detect human T
cell receptor beta variable family gene expression patterns. J Immunol
Methods 2005, 302:54-67.
25. Lim A, Baron V, Ferradini L, Bonneville M, Kourilsky P, Pannetier C:
Combination of MHC-peptide multimer-based T cell sorting with the
Immunoscope permits sensitive ex vivo quantitation and follow-up of
human CD8+ T cell immune responses. J Immunol Methods 2002,
261:177-194.
26. Degauque N, Schadendorf D, Brouard S, Guillet M, Sébille F, Höhn H,
Pallier A, Ruiz C, Dupont A, Chapin S, Hofmann U, Maeurer M, Soulillou JP:
Blood T-cell Vbeta transcriptome in melanoma patients. Int J Cancer
2004, 110:721-729.
27. Ochsenreither S, Fusi A, Busse A, Nagorsen D, Schrama D, Becker J, Thiel E,
Keilholz U: Relative quantification of TCR Vbeta-chain families by real
time PCR for identification of clonal T-cell populations. J Transl Med
2008, 6:34.
Received: 4 November 2009 Accepted: 12 April 2010
Published: 12 April 2010
This article is available from: 2010 Ochse nreither et al; l icensee BioMed Ce ntral Ltd. This is an Open Access article distributed under the terms of the Creative Commons Attribution License ( ), which permits unrestricted use, distribution, and reproduction in any medium, provided the original work is properly cited.Journal of Translational Medicine 2010, 8:35
Ochsenreither et al. Journal of Translational Medicine 2010, 8:35
/>Page 9 of 9
28. Ikeda H, Sato N, Matsuura A, Kikuchi K: Analysis of T-cell receptor V
region gene usage of cytotoxic T-lymphocytes and tumor-infiltrating
lymphocytes derived from human autologous gastric signet ring cell
carcinomas. Cancer Res 1993, 53:3078-84.
29. Weidmann E, Elder EM, Trucco M, Lotze MT, Whiteside TL: Usage of T-cell
receptor V beta chain genes in fresh and cultured tumor-infiltrating
lymphocytes from human melanoma. Int J Cancer 1993, 54:383-90.
30. Merlo A, Filgueira L, Zuber M, Juretic A, Harder F, Gratzl O, De Libero G,
Heberer M, Spagnoli GC: T-cell receptor V-gene usage in neoplasms of
the central nervous system. A comparative analysis in cultured tumor
infiltrating and peripheral blood T cells. J Neurosurg 1993, 78:630-7.
31. Ohmen JD, Moy RL, Zovich D, Lieberman A, Wyzykowski RJ, Sullivan L,
Modlin RL, Uyemura K: Selective accumulation of T cells according to T-
cell receptor V beta gene usage in skin cancer. J Invest Dermatol 1994,
103:751-7.
32. Chikamatsu K, Eura M, Nakano K, Kanzaki Y, Matsuoka H, Masuyama K,
Ishikawa T: Analysis of T cell receptor variability in fresh tumor-
infiltrating lymphocytes from human head and neck cancer. Jpn J
Cancer Res 1994, 85:626-32.
33. Zeuthen J, Birck A, Straten PT: Analysis of T cell receptor alpha beta
variability in tumor-infiltrating lymphocytes in primary and metastatic
melanoma. Arch Immunol Ther Exp (Warsz) 1995, 43:123-33.
34. Gaudin C, Dietrich PY, Robache S, Guillard M, Escudier B, Lacombe MJ,
Kumar A, Triebel F, Caignard A: In vivo local expansion of clonal T cell
subpopulations in renal cell carcinoma. Cancer Res 1995, 55:685-90.
35. Mouri T, Nakamura S, Ohyama Y, Matsuzaki G, Shinohara M, Kishihara K,
Hiroki A, Oka M, Shirasuna K, Nomoto K: T cell receptor V alpha and V
beta gene usage by tumour-infiltrating lymphocytes in oral squamous
cell carcinoma. Cancer Immunol Immunother 1996, 43(1):10-8. Erratum
in: Cancer Immunol Immunother 1997, 45:61
36. Echchakir H, Asselin-Paturel C, Dorothee G, Vergnon I, Grunenwald D,
Chouaib S, Mami-Chouaib F: Analysis of T-cell-receptor beta-chain-gene
usage in peripheral-blood and tumor-infiltrating lymphocytes from
human non-small-cell lung carcinomas. Int J Cancer 1999, 81:205-13.
37. Möhler T, Willhauck M, Scheibenbogen C, Pawlita M, Bludau H, Brossart P,
Hunstein W, Keilholz U: Restriction of T cell receptor V beta repertoire in
melanoma metastasis responding to immunotherapy. Melanoma Res
1995, 5(2):129-32.
38. Velotti F, Chopin D, Gil-Diez S, Maille P, Abbou CC, Kourilsky P, Even J:
Clonality of tumor-infiltrating lymphocytes in human urinary bladder
carcinoma. J Immunother 1997, 20:470-8.
39. Zhang XY, Chan WY, Whitney BM, Fan DM, Chow JH, Liu Y, Ng EK, Chung
SC: T cell receptor Vbeta repertoire expression reflects gastric
carcinoma progression. Clin Immunol 2001, 101:3-7.
40. Weidmann E, Whiteside TL, Giorda R, Herberman RB, Trucco M: The T-cell
receptor V beta gene usage in tumor-infiltrating lymphocytes and
blood of patients with hepatocellular carcinoma. Cancer Res 1992,
52:5913-20.
41. Banér J, Marits P, Nilsson M, Winqvist O, Landegren U: Analysis of T-cell
receptor V beta gene repertoires after immune stimulation and in
malignancy by use of padlock probes and microarrays. Clin Chem 2005,
51:768-75.
42. Albers AE, Visus C, Tsukishiro T, Ferris RL, Gooding W, Whiteside TL, De Leo
AB: Alterations in the T-cell receptor variable beta gene-restricted
profile of CD8+ T lymphocytes in the peripheral circulation of patients
with squamous cell carcinoma of the head and neck. Clin Cancer Res
2006, 12:2394-403.
43. Corvaisier M, Moreau-Aubry A, Diez E, Bennouna J, Mosnier JF, Scotet E,
Bonneville M, Jotereau F: V gamma 9V delta 2 T cell response to colon
carcinoma cells. J Immunol 2005, 15;175(8):5481-8.
44. Keilholz U, Goldin-Lang P, Bechrakis NE, Max N, Letsch A, Schmittel A,
Scheibenbogen C, Heufelder K, Eggermont A, Thiel E: Quantitative
detection of circulating tumor cells in cutaneous and ocular melanoma
and quality assessment by real-time reverse transcriptase-polymerase
chain reaction. Clin Cancer Res 2004, 10:1605-1612.
45. Miqueu P, Guillet M, Degauque N, Doré JC, Soulillou JP, Brouard S:
Statistical analysis of CDR3 length distributions for the assessment of T
and B cell repertoire biases. Mol Immunol 2007, 44:1057-64.
46. Pacholczyk R, Kern J: The T-cell receptor repertoire of regulatory T cells.
Immunology 2008, 125:450-8.
47. Salama P, Phillips M, Grieu F, Morris M, Zeps N, Joseph D, Platell C,
Iacopetta B: Tumor-Infiltrating FOXP3 T Regulatory Cells Show Strong
Prognostic Significance in Colorectal Cancer. J Clin Oncol 2009,
27(2):186-92.
doi: 10.1186/1479-5876-8-35
Cite this article as: Ochsenreither et al., Comparison of T-cell receptor reper-
toire restriction in blood and tumor tissue of colorectal cancer patients Jour-
nal of Translational Medicine 2010, 8:35