Báo cáo hóa học: " Epidermal growth factor receptor gene copy number in 101 advanced colorectal cancer patients treated with chemotherapy plus cetuximab" doc
Bạn đang xem bản rút gọn của tài liệu. Xem và tải ngay bản đầy đủ của tài liệu tại đây (499.4 KB, 8 trang )
Campanella et al. Journal of Translational Medicine 2010, 8:36
/>Open Access
RESEARCH
BioMed Central
© 2010 Campanella et al; licensee BioMed Central Ltd. This is an Open Access article distributed under the terms of the Creative Com-
mons Attribution License ( which permits unrestricted use, distribution, and reproduc-
tion in any medium, provided the original work is properly cited.
Research
Epidermal growth factor receptor gene copy
number in 101 advanced colorectal cancer patients
treated with chemotherapy plus cetuximab
Carla Campanella
1
, Marcella Mottolese
†2
, Anna Cianciulli
3
, Angela Torsello
1
, Roberta Merola
3
, Isabella Sperduti
4
,
Elisa Melucci
2
, Salvatore Conti
2
, MariaGraziaDiodoro
2
, Massimo Zeuli
1
, Giancarlo Paoletti
5
, Francesco Cognetti
1
and
Carlo Garufi*
1
Abstract
Background: Responsiveness to Cetuximab alone can be mediated by an increase of Epidermal Growth factor
Receptor (EGFR) Gene Copy Number (GCN). Aim of this study was to assess the role of EGFR-GCN in advanced
colorectal cancer (CRC) patients receiving chemotherapy plus Cetuximab.
Methods: One hundred and one advanced CRC patients (43 untreated- and 58 pre-treated) were retrospectively
studied by fluorescence in situ hybridization (FISH) to assess EGFR-GCN and by immunohistochemistry (IHC) to
determine EGFR expression. Sixty-one out of 101 patients were evaluated also for k-ras status by direct sequencing.
Clinical end-points were response rate (RR), progression-free survival (PFS) and overall survival (OS).
Results: Increased EGFR-GCN was found in 60/101 (59%) tumor samples. There was no correlation between intensity
of EGFR-IHC and EGFR-GCN (p = 0.43). Patients receiving chemotherapy plus Cetuximab as first line treatment had a RR
of 70% (30/43) while it was 18% (10/56) in the group with previous lines of therapy (p < 0.0001). RR was observed in 29/
60 (48%) of patients with increased EGFR-GCN and in 6/28 (21%) in those without (p = 0.02). At multivariate analyses,
number of chemotherapy lines and increased EGFR-GCN were predictive of response; EGFR-IHC score, increased EGFR-
GCN and number of chemotherapy lines were significantly associated with a significant better PFS. Response to
therapy was the only prognostic predictive factor for OS. In the 60 patients analyzed for k-ras mutations, number of
chemotherapy lines, increased EGFR-GCN and k-ras wild type status predicted a better PFS.
Conclusion: In metastatic CRC patients treated with chemotherapy plus Cetuximab number of chemotherapy lines
and increased EGFR-GCN were significantly associated with a better clinical outcome, independent of k-ras status.
Introduction
Treatment of advanced colorectal cancer (CRC) patients
in the last ten years rapidly moved from a single agent 5-
fluorouracil (5-FU), modulated by Folinic Acid (FA), to
combination chemotherapy including oxaliplatin (L-
OHP) and irinotecan (CPT-11). The addiction of mono-
clonal antibodies directed to the vascular endothelial
growth factor (VEGF), or to the epidermal growth factor
receptor (EGFR) to a regimen with CPT-11-FA-5-FU
increased progression free-survival (PFS) and overall sur-
vival (OS) in randomized phase III trials [1,2]. EGFR,
whose locus is on the short arm of chromosome 7, is a
transmembrane glycoprotein, with an intracellular
tyrosine kinase domain. Binding of ligand to the EGFR
domain induces receptor homodimerization or heterodi-
merization with other HER family members, which
results in a transphophorilation of tyrosin-kinase and
subsequent activation of a complex downstream signal-
ling network [3]. EGFR activation appears to promote
tumor growth and progression by controlling transcrip-
tion, cell-cycle progression, apoptosis and differentiation
[4]. Cetuximab is a MoAb active against the ligand bind-
ing site of EGFR with high specificity and higher affinity
* Correspondence:
1
Department of Medical Oncology, Regina Elena Institute, via E Chianesi 53,
00144 Rome, Italy
†
Contributed equally
Full list of author information is available at the end of the article
Campanella et al. Journal of Translational Medicine 2010, 8:36
/>Page 2 of 8
for EGF receptor than the natural ligands TGF-α and
EGF. Preclinical models have demonstrated antitumor
activity of Cetuximab by several mechanisms including
inhibition of tumor cell proliferation, angiogenesis, inva-
sion and potentiation of apoptosis; it seems also to medi-
ate antibody-dependent cellular cytotoxicity [5]. In
preclinical studies Cetuximab was able to overcome resis-
tance to CPT-11 and to radiotherapy in colorectal cancer
models [6,7]. Cetuximab is active either as a single agent
and in combination with chemotherapy. Jonker et al.
showed that Cetuximab increased PFS and OS when
compared to best supportive care (BSC) in 572 patients
previously treated with chemotherapy [8]. Cetuximab
plus CPT-11 increased RR and PFS but not survival when
compared to Cetuximab alone in the Bond trial [9] and to
CPT-11 alone in the EPIC trial [10].
Phase II trials in untreated patients showed a high
activity of the combination of Cetuximab plus doublets
[11,12] or triplets [13]. A recent meta-analysis combining
the OPUS and CRYSTAL trials showed an increase of
overall survival adding Cetuximab to FOLFIRI (5-FU-FA-
CPT-11) and FOLFOX
4
(5-FU-FA-L-OHP)[14]. When
Pamitumumab, a fully humanized anti-EGFR anitibody,
was added to FOLFOX
4
in first line treatment or to FOL-
FIRI in second line treatment, it significantly increased
RR and PFS [15,16]. The clinical relevance of these infor-
mation indicate that chemotherapy plus an anti-EGFR
antibody can be now considered as one standard option
for patients with advanced CRC in first or second line of
treatment. However these benefits are limited to a minor-
ity of patients and the identification of markers predictive
of activity/resistance is clearly needed. EGFR expression,
detected by immunohistochemistry (IHC), it does not
represent a good predictive marker of response [17].
Moroni et al [18] were the first authors who evaluated
the EGFR-gene copy number (GCN) in 31 selected
patients with metastatic CRC treated with Cetuximab or
Panitumumab. Eight out of nine patients who obtained a
partial response had an increased EGFR gene copy num-
ber (GCN). By contrast, only one out of the twenty-one
non-responders had an increased EGFR-GCN (p <
0.0001). However, there is no consensus on the predictive
role of increased EGFR-GCN due to difficulty in repro-
ducibility of the method of analysis, the limited number
of patients evaluated and their heterogenic features.
Lievre et al were the first who identified the mutation sta-
tus of k-ras as the strongest predictive factor for resis-
tance to anti-EGFR antibody showing that patients with
mutated k-ras are genetically resistant to these agents.
Therefore, the approved use of Cetuximab and Panitu-
mumab is limited to patients with a wild-type k-ras sta-
tus, because benefits in RR PFS and OS are limited only
to k-ras wild-type patients.
The aim of the present study was to support further
evidence of the predictive role of EGFR-GCN in terms of
RR, PFS and OS in a retrospective series of 101 patients
affected by advanced CRC and treated with chemother-
apy plus Cetuximab. The role of kras status was also eval-
uated in a subset of 61 out of these 101 patients.
Patients and Methods
Patients eligibility
One hundred-one consecutive patients with pathologi-
cally confirmed metastatic CRC screened for EGFR
immunostaining were retrospectively evaluated. Patients
treated with Cetuximab as first line therapy had been pre-
viously included in controlled clinical trials, 2042 GOIM
[12] and POCHER study [13] respectively. Pretreated
patients received Cetuximab with CPT-11 alone or with
FOLFIRI. Only one patients with pelvic recurrence and
lung metastases was treated with Cetuximab and
received a single course of radiotherapy.
Eligibility criteria included: age ≥ 18 years, Eastern
Cooperative Oncology Group performance status of 0,1-
2; life expectancy of at least 3 months; normal
hematopoietic, hepatic, and renal functions; no history of
brain metastases and no prior treatment with EGFR-tar-
geting agents. Patients gave written informed consent
before treatment.
Dosage and Drug Administration
Cetuximab was delivered with the same dosage and
schedule both as single agent or in combination: a 2-hour
intravenous infusion at 400 mg/m
2
followed by weekly 1-
hour infusion of 250 mg/m
2
.
In the GOIM study Cetuximab was administrated in
combination with FOLFOX
4
; whereas in the POCHER
trial Cetuximab was added to chrono-IFLO (5-FU at the
dose of 550 mg/m2/d × 4 days, L-OHP at 15 mg/m2/d × 4
days, FA 150 mg/m2/d × 4 and CPT-11 at 130 mg/m2/d1)
with courses every 2 weeks.
Toxicity was graded according to the National Cancer
Institute Common Toxicity Criteria (version 2.0).
Pretreatment and Follow-Up Studies
History, physical examinations, and a safety assessment
were performed pre-treatment and weekly thereafter.
Electrolytes, serum chemistries, liver and kidney function
examinations were performed at baseline, every 2 weeks
and at the end of treatment.
Tumors were measured pre-treatment and every 6
weeks and tumor response was assessed with CT scan
according to the RECIST criteria [19].
EGFR Immunohistochemistry
Immunohistochemical stains were performed on 5 μ par-
affin embedded tissue sections. Sections were deparaf-
finized and rehydrated in a series of alcohols and xylene
Campanella et al. Journal of Translational Medicine 2010, 8:36
/>Page 3 of 8
according to established procedures. The sections were
immunostained for EGFR using DAKO EGFR PharmDX
kit (Dako, Milan, Italy). Antigen retrieval was performed
using proteinase K for 5 min. Sections were then visual-
ized with 3,3'-diaminobenzidine (DAB) as chromogenic
substrate and counterstained with Mayer's haematoxylin.
Negative controls included replacement of the primary
antibody with non-reacting antibodies.
EGFR expression is defined positive as any membrane
staining above background level was visualized. More-
over, an intensity score was applied as follows: negative
no reaction; 1+ if the neoplastic cells displayed an incom-
plete, weak plasmamembrane/cytoplasmic; 2+ if neoplas-
tic cells displayed a complete plasmamembrane
immunostaining with a moderate intensity; and 3+ if neo-
plastic cells displayed a complete plasmamembrane
strong immunostaining. Evaluation of the immunohis-
tochemical results was performed independently and in
blinded manner by two investigators (MM, MGD).
FISH analysis
The fluorescent-labeled probes used in the present study
were LSI EGFR (Spectrum Orange), specific for the EGFR
human gene locus (7p12) and the chromosome enumera-
tion probe (CEP 7, Spectrum Green) for alpha-satellite
DNA located at the centromere (7p11.1-q11.1) (Vysis,
Downers Grove, IL). The assay was performed according
to the manifacturer's instructions. In brief, the target
DNA were heat-codenatured (2 minutes at 72°C) with
probe mixtures and hybridized overnight at 37°C, using a
Vysis Hybrite system. After hybridization for ~16 hours,
hybridized samples were washed in 0.4× standard saline
citrate (SSC)-0.3% NP40 at 73°C for 2 minutes and 2×
SSC-0.1% NP40 at room temperature for 1 minute,
Nuclei were counterstained with 4',6-diamidino-2-phe-
nylindole (DAPI II).
Two hundred nuclei per specimen were observed using
a fluorescence microscope with a 100× lens using an
Olympus BX 61 fluorescence microscope equipped with
a 100 watt mercury lamp and with the Triple Bandpass
Filter set (Vysis) for DAPI, SpectrumOrange and Spec-
trumGreen. Fluorochrome signals were captured individ-
ually and images were generated via a computer with
Quips genetic workstations and imaging software (Vysis).
EGFR gene was visualized as a red signal and the CEP 7
was visualized as a green signal. EGFR gene status was
scored as the average number of EGFR red signals per
nucleus and as the ratio between EGFR red signals and
CEP7 green signals. Centromeric enumeration probe
CEP7 was used as a control to determine copy number of
chromosome 7, to adjust for the effects of aneuploid
chromosome 7 when the EGFR gene copy numbers were
counted Only nuclei with unambiguous chromosome 7
centromeric hybridization signals were scored for the
EGFR signal numbers.
Polysomy of EGFR gene consisted of an increase of
EGFR red signals (≥ three signals per nucleus) paralleled
by the same increase of chromosome 7 (on which the
EGFR gene is located) as measured by the number of
CEP7 green signals per nucleus in at least 50% of neoplas-
tic cells. Samples with a ratio EGFR gene/CEP7 ≥ 2.0 were
esteemed amplified whereas samples displaying a CEP7 ≥
3 were defined polysomic.
DNA extraction and k-ras mutation analysis
DNA was extracted from 10 μ paraffin-embedded tumor
sections after macrodissection using the DNA extraction
kits QIAmp DNA kit (Qiagen-Explera, Jesi, Italy). accord-
ing to the manufacturer's instructions. About 100-200 ng
of genomic DNA was used in a PCR to amplify the region
of exon 2 of K-Ras containing codon 12 an 13. The PCR
reaction was as follows: 95°C for 5 min, 35 cycles of 94°C
for 10 sec, 58°C for 10 sec, 72°C for 1 sec, and 72°C for 2
min. The PCR reaction buffer (KAPA2 Fast Hot start,
Resnova, Genzano di Roma, Italy) out in a volume of 50
μl contained buffer A 1×, 200 μM dNTPs, 10 pmol Ki-ras
sense primer (5'-AGGCCTGCTGAA AATGACT-
GAATA-3'), 10 pmol K-ras antisense primer (5'-CTG-
TATCAAAGAATGGTCCTGCAC-3'), and 1 U of Taq
polymerase (Resnova). An additional no-template control
containing only mix was run for every PCR reaction.
The PCR products were purified using Nucleospin
Extract II Purification kit (M-Medical). Cycle sequencing
was performed using BigDye Terminator v 3.1 kit
(Applied Biosystems, Monza, Italy), and analyzed with a
ABI 3130 capillary electrophoresis system (Applied Bio-
systems).
The presence of an heterozygous k-ras mutation in the
tumor was defined as the appearance of a mutant peak
with an height of at least one-third of that of the wild
type. All sequencing analyses were performed at least
twice on two independents PCRs.
In all the 61 CRC patients analysed, DNA was extracted
from the primary tumour.
Statistical Analysis
Descriptive statistics were used to summarize pertinent
study information. The association between variables was
tested by the Pearson Chi-Square test or the Fisher's
Exact test. Logistic regression multivariate analysis was
used to assess the impact of the following variables on the
response rate: number of lines, EGFR IHC score, GCN,
number of metastatic lines, liver metastases, primary
tumor site. Results are reported as odd ratio (OR) with
95% CI. PFS and OS were calculated by the Kaplan-Meier
product-limit method from the date of the first day of
treatment until progression of disease or death for any
cause or for disease. If a patient had not progressed/died,
survival or progression was censored at the time of the
Campanella et al. Journal of Translational Medicine 2010, 8:36
/>Page 4 of 8
last visit. The log-rank test was used to assess differences
between subgroups. Significance was defined at the p <
0.05 level [20]. The Hazard risk and the confidence limits
were estimated for each variable using the Cox univariate
model and adopting the most suitable prognostic cate-
gory as referent group [21]. A multivariate Cox propor-
tional hazard model was also developed using stepwise
regression (forward selection) with predictive variables
which were significant in the univariate analyses. Enter
limit and remove limit were p = 0.10 and p = 0.15 respec-
tively. The SPSS (13.0) statistical program was used for
analysis.
Results
EGFR Protein Expression and EGFR-GCN
EGFR protein was over-expressed in 90 out of 101
patients (89%), 22 with a 1+ staining score, 40 with a 2+
score and 28 with a 3+ score.
An increased EGFR-GCN was present in 60/101 (59%)
patient tumor samples. Gene amplification was seen only
in 4/101 patient tumor samples (4%) as previously
reported [22] (Table 1). There was no correlation
between intensity of EGFR IHC score and increased
EGFR-GCN by FISH (p = 0.43).
Response to Chemotherapy plus Cetuximab
From February 2004 to May 2007 101 CRC patients (62
male, 39 females; median age 63 years, range 26-80) were
screened for EGFR tumor expression and treated with
Cetuximab (Table 2). Forty-three patients were treated
with chemotherapy plus Cetuximab as first line. Fifty-
eight patients received Cetuximab as second or more
lines of chemotherapy with a median number of two
(range 1-5) and a median interval of 18 months (range 1-
60) between starting of chemotherapy and Cetuximab.
Only 12 patients received Cetuximab as monochemo-
therapy.
Ninety-nine out of 101 patients were evaluable for
response: 40 patients (40%, CI 31-50) had a partial
response, 31 (31%) had a stable disease, 20 patients (20%)
had a progression and eight (8%) had non-measurable
disease. In those patients who received Cetuximab as first
line treatment we observed a RR of 70% (30/43) while it
reached 18% (10/56) in the group with 2
nd
or further line
of therapy (p < 0.0001).
Response was observed in 29/60 (48%) of patients with
increased EGFR-GCN and in 6/28 (21%) in those without
increased EGFR-GCN (p = 0.02); 13 patients were not
evaluable at FISH analysis.
Multivariate regression analysis showed that patients
treated as first line had a better chance of response than
pretreated patients [HR 13.90 (4.41-43.83) p < 0.0001]
and those with increased EGFR-GCN better than non-
increased [HR 6.27 (1.72-22.89) p < 0.005].
Relation between EGFR-GCN and Protein Expression with
PFS and OS
At time analysis was done 65 patients (64%) progressed
and only 19 patients (19%) deceased. Median follow-up
for all patients was 12 months (range 1-34).
In the group of patients as first line treatment median
PFS was 12 months (95% CI 9-15) versus a median PFS of
6 months (95% CI 4-9) for the group of patients who
received Cetuximab as a II or more line therapy, p = 0.01.
As illustrated in Table 3, Cox model analysis showed
IHC EGFR score 2-3 increased EGFR-GCN and first line
chemotherapy significantly associated with a better PFS.
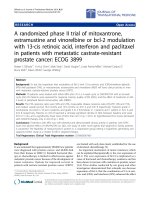
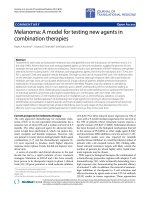
When patients were divided into four groups, according
to line of therapy and EGFR-GCN, a statistically signifi-
cant difference for PFS was observed, with first-line
patients/increased EGFR-GCN having the best PFS and
pre-treated/non-increased EGFR-GCN the worst (p <
0.0001) (Figure 1).
At multivariate analysis response to therapy was the
only prognostic predictive factor for OS. No difference in
OS was observed among the four groups of patients (data
not shown).
K-ras analysis and EGFR-GCN
k-ras analysis was performed in 61/101(59.4%) patients.
There were no differences in clinical data, in patients with
or without K-ras analysis, such as median age, EGFR
expression, EGFR-GCN, site of primary tumor, incidence
of liver metastasis, response to treatment and line of che-
motherapy treatment (data not shown). There was no
correlation between patients with increased EGFR-GCN
Table 1: FISH Data
Patterns FISH Patients %
Increased EGFR gene copy number in
>50% of cells
56/101 56
EGFR gene copy number
<40% of cells
28/101 28
EGFR gene amplification 4 4
Not evaluable 13 12
Campanella et al. Journal of Translational Medicine 2010, 8:36
/>Page 5 of 8
Table 2: Patient characteristics
Patient characteristics Number %
Total evaluated 101 100
Gender
Male 62 61
Female 39 39
Median age (years range) 63(26-80)
Performance Status
07978
12020
>1 2 2
Primary tumor site
Colon 79 78
Rectum 22 22
Liver metastases 79 78
Number of metastatic sites
17776
>1 24 24
Previous chemotherapy lines
04342
1-2 40 40
>2 18 18
Median number of previous lines (range) 2 (1-5)
Median interval time between first-line
treatment and Cetuximab (months, range)
18 (1-60)
Type of chemotherapy associatad with
Cetuximab
CPT-11 19 19
CPT-11, L-OHP, 5-FU 29 29
FOLFIRI 21 21
FOLFOX 20 20
Only Cetuximab 12 12
Campanella et al. Journal of Translational Medicine 2010, 8:36
/>Page 6 of 8
and wild-type status 23/35 (65%) and patients with non-
increased EGFR-GCN and wild-type status 11/18 (61%).
K-ras mutations were found in 23/61 (37.7%). There
was no correlation between k-ras status and response to
treatment with 18/38 objective response (47.4%) in k-ras
wt patients and 10/22 (45,5%) in k-ras mutation, with an
OR = 1.08 [(CI 95% 0.38-3.10), p = 0.89]. One patient was
not evaluable for response. In the 61 patients analyzed for
k-ras increased EGFR-GCN maintained its predictive
role for PFS together with EGFR-score 2-3 and k-ras sta-
tus wild-type (Table 3).
Discussion
The availability of anti-EGFR antibodies in advanced col-
orectal cancer and the need to increase their limited effi-
ciency in unselected patients are factors requiring the
development and validation of laboratory tests which
could predict who might benefit from this treatment in
terms of activity and efficacy.
We studied a population of patients mainly treated with
chemotherapy plus Cetuximab, 42% of whom treated as
first line treatment. We demonstrated that: a) there is no
correlation between EGFR immunostaining and EGFR-
GCN; b) increased EGFR-GCN, first line chemotherapy,
EGFR score 2-3 were predictive factors for PFS; c) these
data were confirmed as independent from k-ras status.
We are aware that interpretation of these results seem
to be difficult because of a mixed sample of patients
treated as first or further lines of chemotherapy and
mostly having received chemotherapy plus Cetuximab
and not Cetuximab alone.
However the increase of RR due to Cetuximab addic-
tion in CPT-11 containing regimens in first or second line
of therapy is in the same range. In the Crystal trial RR was
59.3% with FOLFIRI plus Cetuximab versus 43.2% in
FOLFIRI alone (wild type patients) [2]. In the EPIC trial
RR was 4.2% with CPT-11 and 16.4% with CPT-11 plus
Cetuximab [10]. In The Peeters trial [16] in second line of
treatment RR was 10% with FOLFIRI alone and 35%
FOLFIRI plus Panitumumab. So it could be reasonable to
analyse patients in first or more line of chemotherapy
together.
The role of increased EGFR-GCN and of number of
chemotherapy lines as prognostic factors in the Kaplan-
Meier curves for PFS are clearly shown in Figure 1 where
four distinct groups of patients can be separated accord-
ing to the line of chemotherapy and EGFR-GCN. Patients
treated as first line and with an increased EGFR-GCN
had the best PFS but a significant difference in PFS was
also found in patients treated with Cetuximab plus che-
motherapy as second or more line with or without an
increased EGFR-GCN (p = 0.03).
In our population 89/101 patients were treated with
combination of chemotherapy plus Cetuximab. Literature
concerning the role of EGFR-GCN in patients treated
with chemotherapy alone is very limited. Our data indi-
cate that, in the context of combination of chemotherapy
Figure 1 PFS in four group of patients. For corresponding lines see the
key in figure 1. Group A: +GCN/1st line; Group B: -GCN/1st line; Group C:
+GCN/more lines; Group D: - GCN/more lines; (+: increased; -: non-in-
creased; GCN: EGFR Gene Copy Number) P value adj: Groups A vs D: p
< 0.0001; Groups D vs C: p = 0.03; Groups D vs B: p = 0.06; Groups A vs
B: ns; Groups A vs C: ns; Groups B vs C: ns.
Months
121086420
Probability of Survival
1,0
,9
,8
,7
,6
,5
,4
,3
,2
,1
0,0
Progression-Free Survival
Gr oups A vs D: p <0.0001
Gr oups D vs C: p= 0.03
Gr oups D vs B: p= 0.06
Gr oups A vs B: ns
Groups A vs C: ns
Gr oups B vs C: ns
Group A
Group B
Group C
Group D
Table 3: Multivariate analysis for Progression Free Survival
Variables Entire Population 101 patients K-ras Population 61 patients
HR (CI 95%) p value HR (CI 95%) p value
Increasd EGFR-GCN: no
vs yes
1.84 (1.07 - 3.15) 0.03 2.20 (1.03 4.70) 0.04
Number of Lines: II-III
vs I
2.20 (1.25 - 3.89) 0.01 4.60 (1.87 11.31) 0.001
EGFR score: 0-1 vs 2-3 2.27 (1.35 - 3.82) 0.002 1.99 (0.89 4.44) 0.09
k-ras mut vs wt - - 2.14 (0.97 4.73) 0.06
Mut: mutant; wt: wild-type
Campanella et al. Journal of Translational Medicine 2010, 8:36
/>Page 7 of 8
plus an anti-EGFR antibody, the assessment of EGFR-
GCN can be a valuable tool for better selecting potential
responding patients. The recent survival gain in the Crys-
tal Study [14] will increase the number of k-ras wild type
patients treated simultaneously with both therapeutic
agents. Our results are further supported by the evidence
that an increase of EGFR-GCN had a significant positive
impact on PFS independently of k-ras status.
Recently Moroni et al. have highlighted the most rele-
vant elements of the clinical significance of EGFR FISH in
CRC [23]. According to this author reproducibility
remains a large obstacle for its practical usefulness. How-
ever when we look at the different cut-off values in the lit-
erature they do appear not to differ significantly. Using
FISH Sartore-Bianchi identified GCN ≥ 2,5/nucleus or
Chromosome 7 polysomy or amplification ≥ 40% of neo-
plastic cells [24], Cappuzzo et al used GCN>2.92 and
found a significant relationship with RR and PFS but not
with OS [25], Personeni et al defined GCN as ≥ 2.83 and
confirmed a relationship with RR and OS [26]. In our
series a sample was defined polysomic for the EGFR gene
when at least 50% of examined neoplastic cells had ≥ 3
signals per nucleus paralleled by the same increase of
chromosome 7 on which the EGFR gene is located.
Therefore, much of the data from literature is similar
although an international consensus on the definition of
cut-off points is needed.
Is the information coming from GCN useful in clinical
practice for the patient? EGFR-GCN is indicative of a
subgroup of patients who will most likely benefit from
this combination but currently FISH results do not enable
us to discriminate the responsive patient.
The molecular picture of colorectal cancer seems to be
so complex that it is difficult to identify a single molecu-
lar marker to assess responsiveness or a better outcome.
K-ras mutation has emerged as the strongest predictive
factor for resistance to anti-EGFR moAbs [27] but its role
as a marker of survival has been demonstrated only in
wild-type and not in the mutated patients when treated
with panitumumab [28]. Recent data from Crystal and
OPUS studies showed that addiction of Cetuximab to
FOLFIRI (183 patients) versus FOLFIRI alone (214
patient) was associated with a non statistically significant
increase in RR, PFS, and OS in k-ras mutant patients [14].
Etienne-Grimaldi et al showed that advanced CRC
patients treated with 5-FU without anti-EGFR moAb had
the same response potentiality and the same survival
rates independent from k-ras mutational status [29].
Another point to be addressed is the role of IHC for
EGFR. To date, it has been demonstrated that the tumor
EGFR expression detected by IHC does not represent a
good predictive marker of response to Cetuximab. The
analysis of our results showed that the intensity of EGFR
tumor expression (IHC score 2-3 vs 0-1) was significantly
related to a prolonged PFS (Table 3). At our knowledge,
this is the first study in which EGFR overexpression
(score 2+/3+) detected by IHC appears to be relevant in
predicting PFS demonstrating that patients bearing
advanced CRC strongly positive for EGFR may benefit
from therapy with MoAbs. Up to now, we have no expla-
nation for this result which is contrary to that reported in
the literature and needs to be confirmed in a larger and
more homogeneous series.
In conclusion, in our advanced CRC population treated
with Cetuximab plus chemotherapy an increased EGFR-
GCN conferred a treatment advantage in untreated and
pretreated patients. This effect was maintained in the
subset of k-ras evaluated patients. Integration of this
information with that coming from other molecular path-
ways could lead to a personalized "targeted" therapy for
these patients.
Competing interests
The authors declare that they have no competing interests.
Authors' contributions
CC: study design, acquisition, analysis and interpretation of data; drafting the
manuscript. MM: the EGFR IHC analysis; drafting the manuscript. AC: FISH anal-
ysis. AT: involved in acquisition and interpretation of data; drafting the manu-
script; RM: FISH analysis. IS: statistical analysis. EM: DNA extraction and k-ras
mutation analysis. SC: DNA extraction and k-ras mutation analysis. MGD: patho-
logical sample evaluation. MZ: acquisition of data. GP: in acquisition of data.
FC:drafting the manuscript; CG: study design, acquisition, analysis and interpre-
tation of data; drafting the manuscript. All authors read and approved the final
manuscript.
Acknowledgements
The authors thank Barbara Vanni, Maurizio Cosimelli, Fabrizio Ambesi-Impio-
bato, Vittoria Stigliano, Giulia Piaggio, Mauro Caterino, Salvo Giunta from the
Regina Elena Institute of, Rome for patients referral and radiologic evaluations.
This work was presented in part at the 42nd Annual Meeting of the American
Society of Clinical Oncology, June 2-6, 2006, Atlanta, Georgia.
Author Details
1
Department of Medical Oncology, Regina Elena Institute, via E Chianesi 53,
00144 Rome, Italy,
2
Department of Pathology, Regina Elena Institute, via E
Chianesi 53, 00144 Rome, Italy,
3
Department of Clinical Pathology, Regina
Elena Institute, via E Chianesi 53, 00144 Rome, Italy,
4
Department of Statistics,
Regina Elena Institute via E Chianesi 53, 00144, Rome, Italy and
5
Department
of Medical Oncology, Regina Elena Institute, via E Chianesi 53, 00144 Rome,
Italy
References
1. Hurwitz H, Fehrenbacher L, Novtony W, et al.: Bevcizumab plus
Irinotecan, Fluoracil, and leucovirin for Metastatic Colorectal Cancer. N
Engl J Med 2004, 350:2335-42.
2. Van Cutsem E, Kohne CH, Mitre E, et al.: Cetuximab and chemotherapy as
initial treatment for metastatic colorectal cancer. N Engl J Med 2009,
360:1408-17.
3. Klapper LN, Kirshbaum MH, Sela M, et al.: Biochemical and clinical
implications of the ErbB/HER signaling network of growth factor
receptors. Adv Cancer Res 2000, 77:25-79.
4. Diasio RB, Furie J: Targeting the epidermal growth factor receptor in the
treatment of colorectal cancer. State of the art Drugs 2006,
66(11):1441-1463.
5. Mellstedet H: Monoclonal antibodies in human cancer. Drugs Today
(Barc) 2003, 39(Suppl C):1-16.
Received: 12 June 2009 Accepted: 16 April 2010
Published: 16 April 2010
This article is available from: 2010 Campanella et al; licensee BioMed Central Ltd. This is an Open Access article distributed under the terms of the Creative Commons Attribution License ( which permits unrestricted use, distribution, and reproduction in any medium, provided the original work is properly cited.Journal of Tr anslational Medi cine 2010, 8:36
Campanella et al. Journal of Translational Medicine 2010, 8:36
/>Page 8 of 8
6. Prewett M, Hooper A, Bassi R, et al.: Enanched antitumor activity of anti-
epidermal growth factor receptor monoclonal antibody IMC-C225 in
combination with irinotecan (CPT-11) against human colorectal
xenografts. Clin Cancer Res 2002, 8:994-1003.
7. Dittmann K, Mayer C, Rodemann HP: Inhibition of radiation-induced
EGFR nuclear import by C225 (cetuximab) suppresses DNA-PK activity.
Radiother Oncol 2005, 76:157-1561.
8. Jonker DJ, O'Callagan CJ, Karapetis CS, et al.: Cetuximab of treatment of
colorectal cancer. N Engl J Med 2007, 357(20):2040-2048.
9. Cunningham D, Humblet Y, Siena S, et al.: Cetuximab monotherapy and
cetuximab plus irinotecan in irinotecan refractory metastatic
colorectal cancer. N Engl J Med 2004, 351:337-345.
10. Sobrero A, Maurel J, Fehrenbacher L, et al.: EPIC: phase III trial of
cetuximab puls irinotecan after fluoropyrimidine and oxaliplatin
failure in patients with metastatic colorectal cancer. J Clin Oncol 2008,
26:2311-2319.
11. Tabernero J, Van Cutsem E, Diaz-Rubio E, et al.: Phase II trial of cetuximab
in combination with fluorouracil, leucovorin, and oxaliplatin in the
first-line treatment of metastatic colorectal cancer. J Clin Oncol 2007,
20:5225-5232.
12. Colucci G, Giuliani F, Mattioli R, et al.: FOLFOX4 + Cetuximab in untreated
patients with advanced colorectal cancer. A phase II study of the
Gruppo Oncologico dell'Italia Meridionale (Prot GOIM 2402). J Clin
Oncol 2006, 24:18S. abs 3559
13. Garufi C, Torsello A, Tumolo S, et al.: POCHER (PreOperative
Chemotherapy for Hepatic Resection) study with cetuximab (C-225)
plus chronomodulated (chrono) CPT-11/5-fluorouracil (5-FU)/
leucovorin(FA)/oxaliplatin (L-OHP) (CPT-FFL) in colorectal liver
metastases (CLM). 2008 (ASCO GI) Gastrointestinal Cancers Symposium
Proceedings, January 25-27, Orlando 2008.
14. Van Cutsem E, Rouge P, Kohne CH, et al.: A meta-analysis of the Crystal
and Opus studies combinino Cetuximab with chemotherapy (CT) gas
1
st
- line treatment for patients (pts) with metastatic colorectal cancer
(mCRC): Results according to K-Ras and BRAF mutation status. ECCO
15-ESMO 34 2009.
15. Douillard J, Siena S, Cassidy J, et al.: Randomized phase 3 study of
panitumumab with FOLFOX4 compared to FOLFOX4 alone as 1
st
-line
treatment (tx) for metastatic colorectal cancer (mCRC):the prime trial.
ECCO15-ESMO34 .
16. Peeters M, Price T, Hotko Y, et al.: Randomized phase 3 study of
panitumumab with FOLFIRI vs FOLFIRI alone as second-line
treatmentTx) in patients (pts) with metastatic colorectal cancer
(mCRC). ECCO 15 ESMO 34:.
17. Chung KY, Shia J, Kemency NE, et al.: Cetuximab shows activity in
colorectal cancer patients with tumours that do not express the
epidermal growth factor receptor by immunohistochemestry. J Clin
Oncol 2005, 23(9):1803-1811.
18. Moroni M, veronese S, Benvenuti S, et al.: Gene copy number for
epidermal growth factor receptor and clinical response to anti-EGFR
treatment in colorectal cancer: a cohrt study. Lancet Oncology 2005,
6:279-286.
19. Therasse P, Arbuck SG, Eisenhauer EA, et al.: New guidelines to evaluate
the response to treatment in solid tumours. European Organization for
Reserch and Treatment of Cancer, National Cancer Institute of the
United States, National Cancer Institute of Canada. J Natl Cancer Inst
2000, 92:205-16.
20. Kaplan EL, Meier P: Non parametric estimation from incomplete
observations. J Am Stat Assoc 1958, 53:457-481.
21. Cox DR: Regression models and life tables. J Royal Stat Soc 1972,
4:187-200.
22. Garufi C, Mottolese M, Cianciulli A, Zeuli M, Buglioni S, Torsello A, Vanni B,
Campanella C, Merola R, Terzoli E: Epidermal growth factor gene
amplification is not frequent and cannot account for antitumor activity
of cetuximab plus chemotherapy in advanced colorectal cancer
patients. J Clin Oncol 2006, 24:18S.
23. Moroni M, sartore-Bianchi A, Veronese S, Siena S: EGFR FISH in colorectal
cancer: what is the current reality? Lancet Oncology 2008, 9:402-403.
24. Sartore-Bianchi A, Moroni M, Veronese S, et al.: Epidermal growth factor
receptor gene copy number and clinical out come of metastatic
colorectal cancer treated with panitumumab. J Clin Oncol 2007,
25:3238-3245.
25. Cappuzzo F, Finocchiaro G, Rossi E, et al.: EGFR FISH assay predicts for
response to cetuximab in chemotherapy refractory colorectal cancer
patients. Ann Oncol 2007, 19(4):717-723.
26. Personeni N, Fieuws S, Piessevaux H, et al.: Cinical usefulness of EGFR
gene copy number as a predictive marker in colorectal cancer patients
treated with cetuximab:a fluorescent in situ hybridization study. Clin
Cancer Res 2008, 14:5869-5876.
27. Lièvre A, Bachet JB, Boige V, et al.: KRAS mutations as an indipendent
prognostic factor in patients with advanced colorectal cancer treated
with cetuximab. J Clin Oncol 2008, 26(3):374-379.
28. Karapetis CS, Khambata-Ford S, Jonker DJ, et al.: K-ras mutations and
benefit from cetuximab in advanced colorectal cancer. N Engl J Med
2008, 359:1757-1756.
29. Etienne-Grimaldi MC, Formento JL, Francoual M, et al.: K-ras mutattions
and treatment out come in colorectal cancer patients receiving
exclusive fluoropyrimidine therapy. Clin Cancer Res 2008, 14:4830-4835.
doi: 10.1186/1479-5876-8-36
Cite this article as: Campanella et al., Epidermal growth factor receptor
gene copy number in 101 advanced colorectal cancer patients treated with
chemotherapy plus cetuximab Journal of Translational Medicine 2010, 8:36