AQUATIC EFFECTS OF ACIDIC DEPOSITION - CHAPTER 7 pot
Bạn đang xem bản rút gọn của tài liệu. Xem và tải ngay bản đầy đủ của tài liệu tại đây (793.04 KB, 19 trang )
155
7
Nitrogen Dynamics
7.1 Nitrogen Cycle
Nitrogen is a critical element that controls species composition, biological
diversity, and ecosystem functioning in a variety of ecosystem types, includ-
ing forests, grasslands, fresh waters, estuarine, and near-coastal environ-
ments. Where N is limiting, many species are adapted to low levels of
available N and can be adversely impacted when the N supply is increased.
Fossil fuel combustion, agriculture, fertilizer production, and other human
activities have greatly increased the availability and mobility of N over large
areas, and in the process have substantially altered the global N cycle
(Vitousek et al., 1997).
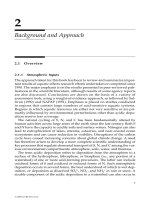
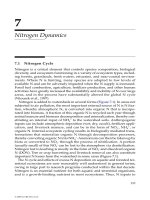
Nitrogen is added to watersheds in several forms (Figure 7.1). In areas not
subjected to air pollution, the most important external source of N is N fixa-
tion, whereby atmospheric N
2
is converted into organic N that is incorpo-
rated into biomass. A fraction of this organic N is recycled each year through
animal manure and biomass decomposition and mineralization, thereby con-
stituting an internal input of NH
4
+
to the watershed soils. Anthropogenic
inputs can include atmospheric deposition (wet, dry, occult), fertilizer appli-
cation, and livestock manure, and can be in the form of NO
3
-
, NH
4
+
, or
organic N. Internal ecosystem cycling results in biologically mediated trans-
formations that mineralize organic N through decomposition processes,
thereby converting organic N into NH
4
+
. Ammonium can then be taken up by
biota or converted to NO
3
-
through the process of nitrification. A portion
(usually small) of this NO
3
-
can be lost to the atmosphere via denitrification.
Nitrogen lost to leaching is mostly in the form of NO
3
-
and dissolved organic
N (DON). Tree or crop harvesting and livestock removal can also constitute
important N losses from the watershed in some cases (Figure 7.1).
The N cycle and effects of excess N deposition on aquatic and forested ter-
restrial ecosystems are now reasonably well understood in general terms,
owing in large part to research programs conducted within the last decade.
Nitrogen is an essential nutrient for both aquatic and terrestrial organisms,
and is a growth-limiting nutrient in most ecosystems. Thus, N inputs to
1416/frame/C07 Page 155 Wednesday, February 9, 2000 2:15 PM
© 2000 by CRC Press LLC
156
Aquatic Effects of Acidic Deposition
natural systems are not necessarily harmful. For each ecosystem, there is an
optimum N level that will maximize ecosystem productivity without causing
significant changes in species distribution or abundance. Above the optimum
level, harmful effects can occur in both aquatic and terrestrial ecosystem com-
partments (Gunderson, 1992).
Nitrogen compounds are found in the atmosphere in reduced (NH
3
, NH
4
+
)
and oxidized (NO, NO
2
, HNO
2
, HNO
3
, PAN) forms. Whereas S emissions in
North America and Europe increased to maximum levels in the 1970s or
1980s and have subsequently been declining, N emissions have remained sta-
ble in recent years or in some areas have been increasing. Emissions into the
atmosphere of N oxides (NO
x
) are mainly derived from fossil fuel combus-
tion. Important sources include motor vehicles, power plants, biomass burn-
ing, and industry. Reduced N is mainly emitted into the atmosphere from
agricultural sources, especially animal production and the production and
application of fertilizers.
Many forested areas in Europe currently receive N deposition in excess
of 20 kg N/ha per year. This elevated deposition of N to European forests
is a chronic addition to the natural background flux of mineral N from net
mineralization. N deposition levels in North America tend to be much
FIGURE 7.1
Major components of the nitrogen cycle.
1416/frame/C07 Page 156 Wednesday, February 9, 2000 2:15 PM
© 2000 by CRC Press LLC
Nitrogen Dynamics
157
lower, only exceeding 10 to 12 kg N/ha per year in limited areas. Recent
studies have also indicated that some watersheds in Japan are N saturated
(Ohrui and Mitchell, 1997; Mitchell et al., 1997). Forest decline has also
been reported at some Japanese sites that receive high levels of N deposi-
tion (Katoh et al., 1990). Recently, Vitousek et al. (1997) discussed alter-
ations to the global N cycle caused by human activities, and Fenn et al.
(1998) provided an overview of the effects of excess N deposition on sen-
sitive North American ecosystems.
The biogeochemical cycling of S and its role in watershed acidification has
been better understood for a longer period of time than is the case for N. The
N cycle is extremely complex and controlled by many factors besides atmo-
spheric emissions and consequent deposition. Also, N inputs that may be ben-
eficial to some species or ecosystems may be harmful to others. Increased
atmospheric deposition of N does not necessarily cause adverse environmental
impacts. In most areas, added N is taken up by terrestrial biota and the most
significant effect seems to be an increase in forest productivity (Kauppi et al.,
1992). However, under certain circumstances, atmospherically deposited N
can exceed the capacity of forest ecosystems to take up N. In some areas, espe-
cially at high elevation, terrestrial ecosystems have become N saturated* and
high levels of deposition have caused elevated levels of NO
3
-
in drainage
waters (Aber et al., 1989, 1991; Stoddard, 1994). This enhanced leaching of NO
3
-
causes depletion of Ca
2+
and other base cations from forest soils and can cause
acidification of soils and drainage waters in areas of base-poor soils.
An international conference on N and its environmental effects was con-
vened in The Netherlands in March 1998, under the Convention on Long-
Range Transboundary Air Pollution of the United Nations Economic Com-
mission for Europe (UN/ECE). Conclusions and recommendations from the
conference included the following (Erisman et al., 1998):
• Increased growth of trees in European forests have been owing in
part to increased atmospheric deposition of N. Tree growth
increases as N deposition increases until the ecosystem becomes
N-saturated, and then growth may decline.
• Increased N deposition can cause nutrient imbalances in forest
vegetation and loss of biodiversity.
• An integrated approach to N-pollution abatement is needed, with
consideration of acidification, eutrophication, human health, and
climate change issues.
N inputs to forested and alpine ecosystems include atmospheric deposition
of NO
3
-
, NH
4
+
, and organic N, as well as N fixation, and in some cases can also
* The term nitrogen saturation has been defined in a variety of ways, all reflecting a condition
whereby the input of nitrogen (e.g., as nitrate, ammonium) to the ecosytem exceeds the require-
ments of terrestrial biota and a substantial fraction of the incoming nitrogen leaches out of the
ecosystem as NO
3
-
in groundwater and surface water.
1416/frame/C07 Page 157 Wednesday, February 9, 2000 2:15 PM
© 2000 by CRC Press LLC
158
Aquatic Effects of Acidic Deposition
include fertilization. N fixation provides variable quantities of N to the forest
and can be carried out by bacteria associated with plant roots, soil microbes,
and lichens found in the forest canopy (Bormann et al., 1993; Sollins et al.,
1980). In rare instances, geologic N can be an important contributor to the N
flux through forests (Dahlgren, 1994). Most of the N contributed to the forest
from the mix of potential N sources described previously is subsequently
retained to a significant extent within the watershed, largely by plant uptake,
microbial assimilation, and abiotic incorporation of N into soil humus.
Variation in the percent of N inputs that is retained in watershed soils and
biota is generally rather small (c.f., Kahl et al., in press); retention is typically
in the range of 80 to 100% at sites that receive low to moderate levels of atmo-
spheric N deposition (i.e., less than 20 kg N/ha per year). For example, esti-
mates of the retention of NO
3
-
and NH
4
+
at Hubbard Brook Experimental
Forest, New Hampshire were 85 and 84%, respectively, and 85% N retention
was estimated for Arbutus watershed in the Adirondack Mountains of New
York (Mitchell et al., 1996). At the experimental West Bear Brook catchment,
N retention has consistently been about 82% in all except the first year of acid-
ification (Kahl et al., in press). At the NITREX reference sites in Europe, only
those sites that receive fairly high levels of N deposition (greater than 15 kg
N/ha per year) leaked significant percentages of input N. The percent N
retention at the treated Sogndal catchment in Norway (SOG4) was identical
(88%) to that of the untreated reference catchment (SOG1) over a 9-year
period of record (Wright and Tietema, 1995). At the Gårdsjön NITREX site in
Sweden, percent N retention remained very high during the first 2 years of
experimental addition of N even though the total N deposition to the site
(ambient plus experimental loading) was greater than 40 kg N/ha per year.
The percent watershed retention of N was only 1% lower at the treatment
catchment (98.9%) than it was at the reference catchment (99.9%, Moldan et
al., 1995) after 2 years. After 5 years of experimental treatment, the catchment
was still retaining about 95% of the N input (Moldan and Wright 1998a).
Fertilization of a mixed hardwood forest plot at Harvard Forest, MA, with
very high levels of N over an 8-year period (greater than 900 kg N/ha)
resulted in virtually no net loss of NO
3
-
(Aber et al., 1995). The observed large
N-retention capacity of this forest is believed to have been caused in part by
intensive land management during previous decades.
Although there are certainly exceptions to this pattern, the percent N reten-
tion by forested ecosystems under depositional regimes that can reasonably
be expected to occur in the U.S. should generally be greater than 80%. For
alpine ecosystems that lack extensive soil coverage, it would not be unrea-
sonable to expect that the percent watershed retention of N could be much
less. We have insufficient data on alpine systems that receive more than about
5 kg N/ha per year to form a judgement at this time.
N saturation of watershed soils, and associated high levels of NO
3
-
leaching
in soil waters and surface waters can cause a wide range of environmental
problems in a wide array of ecosystems and ecosystem compartments. This
is a result of the critical importance of N for life processes (e.g., protein syn-
1416/frame/C07 Page 158 Wednesday, February 9, 2000 2:15 PM
© 2000 by CRC Press LLC
Nitrogen Dynamics
159
thesis) and the fact that N is poorly stored in soils in a form that is readily
available to biota.
Even though soils store very large quantities of N and, in fact, constitute by
far the largest ecosystem pool for N in forested ecosystems, biologically avail-
able N pools in the soil are generally very small relative to vegetative and
microbial demand. Thus, the N cycle of forest ecosystems is usually very tight,
turning over several times per year. Most biocycling involves NH
4
+
, that is pro-
duced by the mineralization (decomposition) of organic materials. NH
4
+
is
readily taken up by plant roots and microbes and converted into organic N that
is recycled back into the soil system through litterfall, death, and decomposi-
tion. A relatively small amount of the soil NH
4
+
is converted to NO
3
-
by the pro-
cess of nitrification, and only a small amount of that NO
3
-
is typically lost from
the ecosystem as NO
3
-
leaching or gaseous losses (e.g., N
2
O) via denitrification.
Nadelhoffer et al. (in press) conducted an
15
N tracer study at Bear Brook
watershed to characterize N cycling processes and identify sinks for experi-
mental NH
4
-N additions to the watershed. Changes in the
15
N content of
plant tissues, soils, and stream water after adding the isotopic tracer illus-
trated that soils were the dominant sink for the added NH
4
+
. Although the
(NH
4
)
2
SO
4
addition caused increased NO
3
-
leaching, the
15
N data suggested
that only 15% of the NO
3
-N exported from the watershed during 2 years of
tracer addition was derived from the 42 kg/ha of labeled NH
4
-N additions.
Thus, most of the exported NO
3
-
was derived from watershed N pools with
residence times greater than 2 years, and not directly from nitrification of the
recent deposition (Nadelhoffer et al. in press).
In areas of the U.S. heavily influenced by photochemical smog, such as the
Los Angeles Basin, deposition of oxidized N compounds can be quite high,
in some cases higher than 20 kg N/ha (Fenn and Bytnerowicz, 1993). Nitro-
gen deposition in these highly exposed areas has caused N saturation of
chaparral and mixed conifer stands and consequent high NO
3
-
concentra-
tions in stream water and soil water (Fenn and Bytnerowicz, 1993; Riggan et
al., 1985, 1994; Bytnerowicz and Fenn, 1996).
Dry deposition of N is of greater magnitude than wet deposition in many
parts of California owing to the arid climate, and this pattern is magnified in
areas that experience frequent temperature inversions. Bytnerowicz and
Fenn (1996) reviewed atmospheric concentrations and deposition of N com-
pounds and their biological effects in California forests that receive much
higher deposition of N than S.
7.2 Environmental Effects
Excess N can affect the ecosystem at many levels. At high concentration, NO
3
-
contaminates drinking water and can be directly toxic to aquatic life. NO
3
-
is
relatively efficient at mobilizing and transporting Al from soils to soil waters
1416/frame/C07 Page 159 Wednesday, February 9, 2000 2:15 PM
© 2000 by CRC Press LLC
160
Aquatic Effects of Acidic Deposition
and surface waters. Dissolved Al and associated acidity can deplete base cat-
ions (e.g., Ca
2+
, Mg
2+
) from the soil cation exchange complex and lead to toxic
responses in aquatic biota and plant roots. Because N is frequently limiting
for algal growth in aquatic ecosystems, eutrophication can result from excess
N, especially in estuarine systems. In pristine alpine and subalpine terrestrial
ecosystems, the limiting factor for primary production is often N supply that
is largely determined by the ability of soil microbes to fix atmospheric N
2
and
to mineralize organic N. Most terrestrial ecosystems are considered N limited
(Friedland et al., 1991; Bowman et al., 1993). Inputs of anthropogenic atmo-
spheric N to plant communities have the potential to alter plant community
structure and increase sensitivity to water stress, frost, and herbivory (Bow-
man et al., 1993), as well as to contribute NO
3
-
to drainage waters.
The end results of N saturation can include forest decline, reduced forest
growth, increased forest susceptibility to disease and insect infestation,
eutrophication of estuaries and near-shore oceans, fresh water and soil acid-
ification, loss of fish and other aquatic life, and changes in terrestrial and
aquatic biodiversity. Fortunately, atmospheric N inputs to most forests are
not high enough to cause such problems. Because of the severity of the poten-
tial effects, however, it is important that we understand the N cycle and the
extent to which it is being perturbed by atmospheric emissions.
The complexities of the N cycle make development of such understanding
challenging, to say the least. These complexities are also what makes it so
interesting to study environmental N effects. Study of the N cycle encom-
passes a huge diversity of disciplines, from atmospheric physics and hydrol-
ogy to chemistry and biology. All levels of life are directly tied to and/or
affected by the cycle, from microbes and mycorrhizal fungi to plants and ani-
mals. All major ecosystem compartments are involved in the cycling of N
through the system: foliage, roots, soil, microbial communities, soil water,
stream water, algal communities, and so forth.
To further complicate the situation, N cycling is also regulated to a signif-
icant degree by climate, disturbance, and land management. Such factors
are believed to have both short- and relatively long-lasting (i.e., decadal to
century) effects on the response of forest ecosystems to atmospheric N dep-
osition (Mitchell et al., 1996; Aber et al., 1989, 1995b, 1998; Fenn et al., 1998).
Thus, the extent to which the land was logged, burned, or used for agricul-
tural production in the past, perhaps even during the previous century, can
profoundly affect the N status of the soils and, therefore, the extent to which
N deposition will or will not cause environmental degradation. Many sci-
entists, policymakers, and concerned citizens long for simple environmen-
tal cause/effect relationships. Increase N deposition and bad things
happen. Decrease N deposition and good things happen. This is clearly not
how it works.
The concentration of NO
3
-
in runoff at the NITREX experimental N-addi-
tion site at Gårdsjön, Sweden, showed a pattern of higher N loss during win-
ter and lower N loss during summer. Moldan and Wright (1998a)
demonstrated a strong nonlinear inverse relationship between mean air
1416/frame/C07 Page 160 Wednesday, February 9, 2000 2:15 PM
© 2000 by CRC Press LLC
Nitrogen Dynamics
161
temperature and NO
3
-
leaching, with a threshold between about 2 and 5˚C,
below which NO
3
-
leaching losses greatly accelerated (Figure 7.2). Moldan
and Wright (1998a) speculated that the rates of most N uptake processes, for
example by microbes, fine roots, and mycorrhiza, are strongly reduced below
such a temperature threshold.
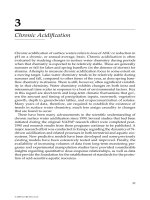
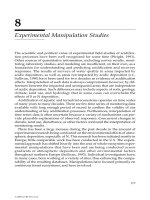
Interestingly, Murdoch et al. (1998) found pretty much the opposite effect
at Biscuit Brook, a headwater stream in the Catskill Mountains, NY. Volume-
weighted mean stream NO
3
-
concentration and both annual (Figure 7.3a) and
seasonal (data not shown) average air temperature were positively corre-
lated. Water year (WY) 1990 was an outlier in the observed relationship, and
this was attributed to higher N deposition and an unusually severe cold
weather period with little snow cover during the 1989–1990 winter. Similarly,
Murdoch et al. (1998) found that the concentration of NO
3
-
in stream water
during the late summer base flow period was highly correlated with average
annual air temperature (Figure 7.3b). They attributed these results to the tem-
perature-dependence of nitrification, whereby nitrification is greater at
higher temperatures (Figure 7.3c).
We do not know why the results at Gärdsjön and Biscuit Brook are oppo-
site, but it seems that nitrification and uptake processes are affected by tem-
perature in opposite directions. Where NO
3
-
leaching is limited by
nitrification, a positive relationship, such as was found at Biscuit Brook,
might be expected. Perhaps in other situations, NO
3
-
leaching is more limited
by N uptake, which is enhanced at warmer temperatures.
FIGURE 7.2
Observed relationship between NO
3
-
leaching loss in runoff and mean air temperature at
the G2 NITREX site at Gårdsjön, Sweden. Each point represents an average of 14 to 90 days.
(Reprinted from Forest Ecology and Management, Vol. 101, Moldan, F. and R.F. Wright,
Changes in runoff chemistry after five years of N addition to a forested catchment at
Gårdsjön, Sweden, p. 442, Copyright 1998. With permission from Elsevier Science.)
1416/frame/C07 Page 161 Wednesday, February 9, 2000 2:15 PM
© 2000 by CRC Press LLC
162
Aquatic Effects of Acidic Deposition
It has recently been hypothesized that prior land use history, extending
back 100 years or more, can have a major effect on forest response to N dep-
osition (Aber and Driscoll, 1997; Foster et al., 1997; Aber et al., 1997, 1998).
The greater the previous extraction of N from the site by agricultural conver-
sion, fire, logging, or other disturbance, the more N the forest will be able to
FIGURE 7.3
Relationships between nitrogen and temperature: (A) average annual stream NO
3
-
concen-
tration and average annual air temperature; (B) average annual air temperature and late
summer baseflow stream NO
3
-
concentration; and (C) net nitrification and soil temperature.
Stream data are from Biscuit Brook in the Catskill Mountains, NY, from 1984 to 1995;
nitrification data are from a nearby deciduous forest stand, July 1993 to July 1996. Water
year 1990 was identified as an outlier owing to unusually high dormant season N deposition
and extremely cold temperatures during December of that year. (Source: Reprinted with
permission from Murdoch et al., 1998, Environmental Science & Technology, Vol. 32, p. 1644-
1646, Figures 3A, 6, 7B, Copyright 1998, American Chemical Society.)
1416/frame/C07 Page 162 Wednesday, February 9, 2000 2:15 PM
© 2000 by CRC Press LLC
Nitrogen Dynamics
163
absorb without becoming N saturated. Aber et al. (1998) contended that pre-
vious land use is more important than either current or total accumulated N
deposition as a controlling factor for N saturation in the northeastern U.S.
N cycling operates on multiple time scales. Assimilation of N by microbes
and consequent mineralization can be very rapid (e.g., days) whereas N turn-
over and cycling between plants and soils can occur over much longer peri-
ods of time (e.g., year or longer; Fenn et al., 1998). Aber et al. (1989) provided
a conceptual model of the changes that occur within the terrestrial system
under increasing loads of atmospheric N. Stoddard (1994) described the
aquatic equivalents of the stages identified by Aber et al. (1989), and outlined
key characteristics of those stages as they influence seasonal and long-term
aquatic N dynamics. In a recent review for North American ecosystems, Fenn
et al. (1998) described the geographic extent of known N saturation and the
factors predisposing terrestrial ecosystems to N saturation.
Although some high-quality research has been conducted in the U.S. on the
environmental effects of atmospheric N deposition, such research has been
conducted to a far greater extent in Europe. The number, and quality, of Euro-
pean N studies have increased tremendously since the 1980's (Sullivan, 1993).
As new research initiatives are developed in the U.S. that include N, much
can be gained from examining recent findings and research priorities devel-
oped overseas. This information is critical to assure that new research priori-
ties, monitoring efforts, modeling studies, and process-level research on N
are fully integrated with, and complementary to, studies already conducted
or underway in Europe.
The European scientists have concluded that it is important to study N
questions as large multidisciplinary, multi-investigator research teams. This
is because of
1. The complexities of the N cycle.
2. The multitude of scientific disciplines involved in its study.
3. The importance of expensive, large-scale, whole-system manipu-
lations as a tool for studying N effects (see further discussion in
Chapter 8).
A high degree of international and interinstitutional cooperation has devel-
oped in recent years within Europe. This spirit of cooperation has been evi-
dent in several international umbrella projects on N effects, especially
NITREX and EXMAN (Wright and van Breemen, 1995; Beier and Rasmussen,
1993; Tietema and Beier, 1995).
NITREX (Nitrogen Saturation Experiments) is a consortium of experiments
in which N deposition has been drastically changed for whole catchments or
forest stands at eight sites spanning the present-day gradient of N deposition
across Europe (Dise and Wright, 1992; Wright and van Breemen, 1995). At
sites receiving low to moderate N deposition (3 to 20 kg N/ha per year), N
has been experimentally added to precipitation in an effort to induce N
1416/frame/C07 Page 163 Wednesday, February 9, 2000 2:15 PM
© 2000 by CRC Press LLC
164
Aquatic Effects of Acidic Deposition
saturation. At sites with high N deposition (20 to 54 kg N/ha per year) and
significant leaching losses of NO
3
-
, N is removed from precipitation by means
of roofs and ion-exchange systems. A variety of ecosystem processes are
investigated at each of the sites in an effort to quantify the factors that lead to
enhanced NO
3
-
leaching. EXMAN (Experimental Manipulation of Forest Eco-
systems in Europe) has involved a similar approach; N inputs, water avail-
ability, and nutrient inputs have been manipulated to varying degrees (Beier
and Rasmussen, 1993). These experimental programs are discussed in greater
detail in Chapter 8.
Emmett et al. (1998) summarized data on the N status of the forested
NITREX sites and ecosystem responses to experimental N additions and
exclusions. Nitrogen leaching losses were highly variable, ranging from less
than 5 to about 80% of inputs, and this seemed to depend on the initial N sta-
tus of the site and the form of deposited N (as NO
3
-
or NH
4
+
). At low N-status
stands, such as Gårdsjön and Klosterhede, both NO
3
-
and NH
4
+
were
strongly retained and, therefore, leaching losses of N were low in response
to both ambient and enhanced N deposition (Figure 7.4). At high N-status
FIGURE 7.4
Ambient inputs in throughfall and leaching losses in streams or soil water of inorganic N
at forested NITREX sites. (Source: Ecosystems, Predicting the effects of atmospheric nitrogen
deposition in conifer stands: evidence from the NITREX ecosystem-scale experiments, Em-
mett, B.A., D. Boxman, M. Bredemeier, P. Gundersen, O.J. Kjønaas, F. Moldan, P. Schleppi,
A. Tietema, and R.F. Wright, Vol. 1, p. 354, Figure 2, Copyright 1998, Springer-Verlag. With
permission.)
1416/frame/C07 Page 164 Wednesday, February 9, 2000 2:15 PM
© 2000 by CRC Press LLC
Nitrogen Dynamics
165
stands, N retention was lower, because N supply was somewhat greater
than demand, and the magnitude of leaching loss was apparently deter-
mined by the availability of NO
3
-
for leaching. Nitrate is made available for
leaching either directly through NO
3
-
deposition or is generated internally
by nitrification of available NH
4
+
in the soil. If the nitrification rate at the site
is low, leaching losses are much greater if N is deposited as NO
3
-
rather than
NH
4
+
. This situation was evident at the Aber site where NO
3
-
leaching losses
were double when N was applied as NO
3
-
relative to application of 50% NO
3
-
and 50% NH
4
+
. Where the nitrification rate is high, such as Ysselsteyn, leach-
ing losses of N can be higher than the input of NO
3
–
N. This is because a siz-
able component of the NH
4
+
input is nitrified and subsequently leached
(Emmett et al., 1998).
Terrestrial effects have not been pronounced at most of the NITREX sites in
response to the experimental treatments (Emmett et al., 1998). Measurements
included nutritional status of the trees, wood accumulation, mycorrhizal
diversity, fine root biomass, deposition processes, and invertebrate popula-
tions. However, at the highly N-saturated Ysselsteyn site that received 45 kg
N/ha per year of input, tree growth increased markedly following reduction
in N deposition (Boxman et al., 1998).
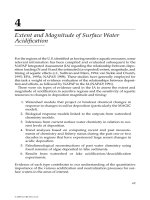
The C : N ratio of the forest floor was strongly related to the fraction of N
input leached from the European sites as NO
3
-
(Emmett et al., 1998; Figure
7.5). This has been attributed to the controlling influence of the forest floor
C : N ratio on soil nitrification (Gundersen et al., 1998). The NITREX results
suggested a threshold forest floor C : N below which NO
3
-
leaching is
enhanced. As illustrated by the data shown in Figure 7.5, it would be highly
desirable to obtain additional data on NO
3
-
leaching at sites that exhibit C : N
between about 23 and 30.
A number of factors can be involved in controlling the loss of N from a for-
ested watershed to drainage waters, including atmospheric inputs, forest
stand age and condition, the size of soil N and C pools, and flowpaths of per-
colation and melt-water within the catchment. The stages of N loss from the
watershed, as described by Stoddard (1994), are depicted in Figure 7.6.
Changes in both the seasonal and long-term patterns in surface water NO
3
-
concentrations reflect changes that occur within the watershed in N cycling
and the degree of N saturation. At Stage 0, NO
3
-
concentrations in drainage
waters are very low throughout most of the year, and increase to measurable
concentrations typically only during snowmelt or spring rainfall hydrologi-
cal events (Figure 7.6a). The loss of N in runoff is short-lived and small in
magnitude. This was viewed by Stoddard (1994) as the “natural” pattern. At
Stage 1, that pattern is amplified; spring concentrations of NO
3
-
in surface
waters reach relatively high concentrations and the seasonal onset of N limi-
tation is delayed (Figure 7.6b). In Stage 2, N begins to percolate beneath the
rooting zone of the soil, resulting in elevated groundwater concentrations of
NO
3
-
. Seasonality is damped because baseflow concentrations of NO
3
-
are
high (Figure 7.6c). In Stage 3, the watershed becomes a source, rather than a
sink, for atmospheric N. The combined inputs of N from deposition, miner-
1416/frame/C07 Page 165 Wednesday, February 9, 2000 2:15 PM
© 2000 by CRC Press LLC
166
Aquatic Effects of Acidic Deposition
alization, and nitrification produce concentrations of NO
3
-
in drainage water
of Stage 3 watersheds that can be higher than deposition (Figure 7.6d, Stod-
dard, 1994).
A variety of other symptoms, in addition to NO
3
-
leaching, are suggestive
or indicative of N overfertilization of forest ecosystems. Most have to do with
measurement of the ratio of N to one or more other elements in one or more
ecosystems compartments. In foliage, the N : Mg and N : P ratios are com-
monly employed. Soil C : N is also a common indicator of N saturation (Fenn
et al., 1998).
Although most forests retain the majority of N inputs that they receive,
some forested ecosystems leach significant amounts of NO
3
-
to drainage
water, and this occurs under a range of N deposition input levels. At some
sites in the U.S., relatively high levels of N deposition (10 to 30 kg N/ha per
year) have been shown to result in high N leaching losses (7 to 26 kg N/ha
per year). Good examples include watersheds in Great Smoky Mountains
National Park in Tennessee (Johnson et al., 1991) and the San Bernadino
Mountains in southern California (Fenn et al., 1996). At Fernow, WV, high N
loading (15 to 20 kg N/ha per year) has caused moderate N leaching losses
(approximately 6 kg N/ha per year; Gilliam et al., 1996; Peterjohn et al., 1996).
Despite the observed variability in ecosystem response, a number of general-
izations can be made. Coniferous forests and alpine ecosystems seem to be
more prone to N saturation than deciduous forests (Aber et al., 1995a, 1998;
FIGURE 7.5
Observed relationship between the proportion of N inputs leached (N
out
/N
in
) and the C/N
ratio of the forest floor at forested NITREX sites. (Source: Ecosystems, Predicting the effects
of atmospheric nitrogen deposition in conifer stands: evidence from the NITREX ecosystem-
scale experiments, Emmett, B.A., D. Boxman, M. Bredemeier, P. Gundersen, O.J. Kjønaas, F.
Moldan, P. Schleppi, A. Tietema, and R.F. Wright, Vol. 1, p. 355, Figure 4B, Copyright 1998,
Springer-Verlag. With permission.)
1416/frame/C07 Page 166 Wednesday, February 9, 2000 2:15 PM
© 2000 by CRC Press LLC
Nitrogen Dynamics
167
Williams et al., 1996a). Young and successional forests, with their greater
nutrient demand, are less prone to N saturation than mature stands (Peet,
1992). Climate, soil N pool size, and land use dramatically alter biological N-
demand (Cole et al., 1992; van Miegroet et al., 1992; Feger, 1992; Magill et al.,
1996; Fenn et al., 1998). It is not difficult to understand such observed differ-
ences. Because N is so critical to ecosystem primary productivity, other fac-
tors that influence plant and microbial growth (e.g., water availability,
temperature) or the abundance or availability of other nutrients (e.g., Ca, Mg,
P) will have significant effects on the ability of plants and microbes to utilize
N and, therefore, the extent to which N will leach in drainage waters.
Forest stand age has been found to be associated with N retention by the
forest system. Watersheds having older trees seem more likely to leach N to
a higher degree than forests having younger trees (e.g., Vitousek, 1977;
Elwood et al., 1991; Emmett et al., 1993). In general, forests in the eastern U.S.
have been logged on many more occasions and subjected to more intensive
forest management practices than forests in the western U.S. In addition,
stands of old growth trees that are generally absent from the eastern U.S.,
FIGURE 7.6
Example patterns of NO
3
-
concentration in surface water at various stages of watershed N
saturation. Stage 0, Black Pond in the Adirondack Mountains, NY. Nitrogen transformations
are dominated by plant uptake and microbial assimilation. Only small amounts of NO
3
-
leach out of the watershed, primarily during snowmelt. Stage 1, Constable Pond in the
Adirondack Mountains, NY. As compared to Stage 0, this stage is characterized by delayed
onset of N limitation during the spring and larger peaks of NO
3
-
in runoff. Stage 2, Watershed
#4 at Fernow Experimental Forest, WV. Uptake of N by plants and microbes is reduced, as
compared with Stage 1, resulting in loss of NO
3
-
to streams during winter and spring and
to groundwater during the growing season. Stage 3, Dicke Bramke, Harzburg Mountains,
Germany. Nitrate concentrations are chronically high throughout the year; the watershed
can become a source, rather than a sink, for atmospheric N. From Stoddard (1994).
1416/frame/C07 Page 167 Wednesday, February 9, 2000 2:15 PM
© 2000 by CRC Press LLC
168
Aquatic Effects of Acidic Deposition
can still be found scattered throughout areas of the West. It is anticipated
that, all other things being equal, the less intensively managed western for-
ests should be closer to a condition of N saturation than are eastern forests
that have been cut repeatedly and have been under more intensive forest
management for hundreds of years. Thus, results of studies conducted in the
east regarding thresholds of N saturation (e.g. Kahl et al., 1993a) may under-
estimate the sensitivity of otherwise generally comparable western forests to
increased N loading.
Emmett et al. (1993) surveyed 20 forested (10 to 55-year-old plantations of
Sitka spruce,
Picea sitchensis
) and 5 moorland catchments in northern and
central Wales to evaluate the relative importance of N deposition, vegetation
type, and plantation age on NO
3
-
leaching losses to stream water. Inorganic
N inputs, as reflected by the N content of throughfall, tended to increase with
stand age, and ranged from about 9 to 25 kg N/ha per year. In young stands
(less than 30 years), inorganic N outputs were less than 5 kg N/ha per year.
Older stands showed greater outputs of N, in excess of 30 kg N/ha per year
at some sites. The oldest stands (greater than 50 years) acted as net sources of
total N, based on throughfall fluxes of inorganic N and outputs of DON as
well as NO
3
-
.
Tietma and Beier (1995) integrated preliminary results from long-term
ecosystem manipulation experiments at 12 sites in northwest and central
Europe. The sites were included in the EXMAN (Rasmussen et al., 1990)
and/or NITREX (Dise and Wright, 1992) research programs. The integra-
tion focused on site properties indicative of aspects of N cycling, such as
ecosystem fluxes and elemental concentrations in the various ecosystem
compartments at the unmanipulated NITREX control plots. All of the sites
are located in coniferous forests except Sogndal, Norway, which is alpine.
Data were collected to describe the inorganic N input (as reflected in the N
concentrations in precipitation and throughfall) and output (in soil water
or drainage water) fluxes, stand age, and various parameters that charac-
terize internal N cycling. Regression analyses were conducted to ascertain
if N fluxes in precipitation and throughfall were correlated, if N concentra-
tions in ecosystem compartments were related to N inputs in deposition,
and the extent to which N output fluxes could be predicted on the basis of
inputs or N concentrations in various ecosystem compartments. Such
issues are critical to development of an understanding of N dynamics at
the plot or catchment scale and also for developing a foundation for pre-
dicting changes in N cycling processes and process rates under changing
levels of atmospheric inputs.
At the 8 forested sites characterized by high NH
4
+
inputs (greater than 50%
of total inorganic N), much of which occurred in the form of dry deposition,
Tietema and Beier (1995) found the total N flux in precipitation was highly
correlated (
r
2
= 0.93,
p
< 0.001) with NH
4
+
fluxes in throughfall. All of these
sites are located in areas of moderate to intensive agricultural activity. At the
other three forested sites located in less polluted areas (Switzerland, Wales,
Sweden), atmospheric inputs of N primarily occurred as NO
3
-
. The analyses
1416/frame/C07 Page 168 Wednesday, February 9, 2000 2:15 PM
© 2000 by CRC Press LLC
Nitrogen Dynamics
169
supported the conclusion that increased N concentrations in the various eco-
system compartments is caused by increased N inputs (McNulty et al., 1991;
Heinsdorf, 1993; Tietema, 1993). Total N wet deposition (kg N/ha per year)
was significantly correlated with N concentration in current year needles (
r
2
= 0.76,
p
< 0.05), needle litterfall (
r
2
= 0.80,
p
< 0.05), and the ectorganic forest
floor layer (
r
2
= 0.82,
p
< 0.005). Somewhat weaker but statistically significant
relationships were also found between NH
4
+
deposition in throughfall and
the N concentration in those ecosystem compartments.
Excluding 1 site in The Netherlands that exhibited an extremely high N
output flux (greater than 40 kg N/ha per year), total N output flux was highly
correlated with wet N deposition (
r
2
= 0.83, p < 0.001) and the N concentration
in each of the ecosystem compartments investigated. Multiple regressions
using N concentrations in current-year needles, needle litterfall, and in the
ectorganic layer as independent variables explained 96% of the variation in
N output. Thus, the N concentration in these ecosystem compartments pro-
vides a useful index of N-saturation status at the plot or catchment scale (Tie-
tema and Beier, 1995). These results, and those from additional study areas
have been, and are being, used as the basis for modeling N saturation.
A threshold of NO
3
-
leaching at deposition levels above about 10 kg N/ha
per year was found; no significant leaching was observed at deposition levels
below this threshold, in agreement with results of a survey of 65 forested
European plots and catchments by Dise and Wright (1995).
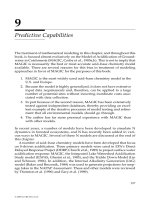
The conceptual model of N saturation that was presented by Aber et al.
(1989) was revised and updated in response to these and other more recent
research results. Aber et al. (1998) summarized the results of field experi-
ments in 4 forest stands in Massachusetts, Vermont, and Maine and also a
survey of 161 spruce–fir forest stands situated along an N depositional gra-
dient (4 to 13 kg N/ha per year) across New York and New England. The
manipulated plots included two coniferous stands (Harvard Forest pine
stand, MA, and Mt. Ascutney spruce–fir stand, VT) and two mixed hard-
wood stands (Harvard Forest and Bear Brook, ME). Results of these studies
and those of the European NITREX experiments were evaluated with respect
to their consistency with the ecosystem responses hypothesized earlier by
Aber et al. (1989). In most cases, the earlier hypotheses were supported by the
more recent data. Experimental sites showed increased net N mineralization,
as did the stands in the midpoint of the spruce–fir transect, relative to the
stands receiving the lowest N deposition. With one exception, net nitrifica-
tion was induced or increased, resulting in increased mobility and leaching
losses of NO
3
-
, as predicted by the earlier conceptual model. All sites showed
increases in foliar N concentrations, as hypothesized. Both of the experimen-
tally manipulated conifer stands and the regional survey showed declining
tree growth or increased tree mortality (McNulty et al., 1996; Aber et al.,
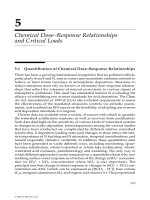
1998). There were also a number of surprises, however, that caused Aber et
al. (1998) to revise their conceptual model in several ways (Figure 7.7). First,
although net N mineralization increased initially, longer-term responses in
all except the Harvard Forest hardwood stand showed subsequent decreases
1416/frame/C07 Page 169 Wednesday, February 9, 2000 2:15 PM
© 2000 by CRC Press LLC
170 Aquatic Effects of Acidic Deposition
in net N mineralization from early peak values (that were 1.2 to 2.4 times
higher than low deposition or control values) down to near or below control
values. Gunderson et al. (1998) and Tietema (1998) also found that net N min-
eralization peaked at intermediate N deposition in Europe. Second, the
observed increases in NO
3
-
cycling and leaching were very small, relative to
N inputs. Nitrogen retention efficiencies were much higher than expected,
ranging from 85% at the high-N pine stand at Harvard Forest to values
between 93 and 99% at the other 8 treatments and sites. Third, increased foliar
N concentrations were accompanied by decreased foliar Mg : N and Ca : Al
ratios in all except one site. This observation may provide a link between
experimental N addition and forest health.
FIGURE 7.7
Hypothesized major responses of temperate forest ecosystems to long-term chronic N
addition. (Source: Aber et al., 1998. Reprinted with permission from BioScience, Vol. 48, p.
922, Figure 1, 1998, © 1998 American Institute of Biological Sciences.)
1416/frame/C07 Page 170 Wednesday, February 9, 2000 2:15 PM
© 2000 by CRC Press LLC
Nitrogen Dynamics 171
Aber et al. (1998) found that the deciduous forest stands did not progress
toward N saturation as rapidly or as far as the coniferous stands. Growth
declined or mortality increased at all of the coniferous stands, but not all the
deciduous stands.
7.3 Nitrogen in Surface Waters
Atmospheric deposition of N (as NO
3
-
and as NH
4
+
that can be quickly nitri-
fied to NO
3
-
) in some cases causes increased concentrations of NO
3
-
in drain-
age waters. An increase in the concentration of NO
3
-
will generally result in a
number of additional changes in water chemistry that are analogous to those
caused by SO
4
2-
. These can include:
• Increased concentration of base cations (Ca
2+
, Mg
2+
, K
+
, Na
+
).
• Decreased acid neutralizing capacity (ANC).
• Increased concentration of hydrogen ion (decreased pH).
• Increased concentration of dissolved Al.
Increased concentrations of H
+
and/or Al
n+
occur mostly in response to
higher concentrations of SO
4
2-
or NO
3
-
when ANC has decreased to near or
below zero. At higher ANC values, increases in SO
4
2-
or NO
3
-
concentrations
are mainly balanced by increasing base cation concentrations and some
decrease in ANC in some cases. High concentrations of H
+
or Al
n+
can be toxic
to fish and other aquatic biota.
If NO
3
-
leaches into stream or lake water as a result of increased N deposi-
tion, the result can be eutrophication or acidification. If N is limiting for
aquatic primary production, the added NO
3
-
will generally result in
increased algal productivity that can cause disruption of aquatic community
dynamics. If N is not limiting (e.g., P or some other nutrient can be limiting),
then the added NO
3
-
will remain in solution, possibly leading to acidification.
Except in cases of N saturation, the effects of N deposition on surface
waters are expected to be primarily episodic in nature. Unfortunately, data
required to make regional assessments of episodic effects generally are not
available. Such data need to be collected on an intensive schedule and must
include sample periods during late winter and early spring when snowmelt
often causes the most severe N-driven episodes of surface water acidifica-
tion. Sampling during this time of year is more difficult, dangerous, and
expensive than during the more common summer/fall sampling seasons.
Sampling during snowmelt can be particularly difficult in the high moun-
tains of the West when study sites are often inaccessible and where motor-
ized transport (e.g., via snowmobile) is not allowed in some places owing
to wilderness restrictions.
1416/frame/C07 Page 171 Wednesday, February 9, 2000 2:15 PM
© 2000 by CRC Press LLC
172 Aquatic Effects of Acidic Deposition
Most lakes receive the majority of their hydrologic input from water that
has previously passed through the terrestrial catchment. As long as N reten-
tion in the terrestrial system remains high, as is generally the case for forested
ecosystems, N concentrations in lakes will remain low in the absence of con-
tributions from land use (e.g., agriculture) or other pollution sources. How-
ever, if N retention in the catchment is low and the lake has not yet acidified,
N deposition can in some cases increase primary production. This is most
likely to happen in groundwater recharge lakes where nutrient inputs are
derived largely from deposition to the lake surface. Lakes that are most likely
to be low in base cations (therefore potentially sensitive to acid deposition)
and also N limited are often systems overlaying volcanic bedrock (these
rocks are often high in P).
The relationship between measured wet deposition of N and stream-water
output of NO
3
-
was evaluated by Driscoll et al. (1989a) for sites in North
America (mostly eastern areas), and augmented by Stoddard (1994). The
resulting data showed a pattern of N leaching at wet-inputs greater than
approximately 400 eq/ha (5.6 kg N/ha).
Stoddard (1994) presented a geographical analysis of patterns of watershed
loss of N throughout the northeastern U.S. He identified approximately 100
surface water sites in the region with sufficiently intensive data to determine
their N status. Sites were coded according to their presumed stage of N reten-
tion, and sites ranged from Stage 0 through Stage 2. The geographic pattern
in watershed N retention depicted by Stoddard (1994) followed the geo-
graphic pattern of N deposition. Sites in the Adirondack and Catskill Moun-
tains in New York, where N deposition is about 11 to 13 kg/ha per year, were
typically identified as Stage 1 or Stage 2. Sites in Maine, where N deposition
is about one-half as high, were nearly all Stage 0. Sites in New Hampshire
and Vermont that receive intermediate levels of N deposition were identified
as primarily Stage 0, with some Stage 1 sites. Based on this analysis, a reason-
able threshold of N deposition for transforming a northeastern site from the
natural Stage 0 condition to Stage 1 would correspond to the deposition lev-
els found throughout New Hampshire and Vermont, approximately 8 kg
N/ha per year. This agreed with Driscoll et al.'s (1989a) interpretation that
suggested N leaching at wet inputs above about 5.6 kg N/ha per year that
would correspond to total N inputs near 7 to 8 kg N/ha per year. This is likely
the approximate level at which episodic aquatic effects of N deposition
would become apparent in many watersheds of the northeastern U.S.
A survey of N outputs from 65 forested plots and catchments throughout
Europe was conducted by Dise and Wright (1995). Below the throughfall
inputs of about 10 kg N/ha per year, there was very little N leaching at any
of the study sites. At throughfall inputs greater than 25 kg N/ha per year,
the study catchments consistently leached high concentrations of inorganic
N. At intermediate deposition values (10 to 25 kg N/ha per year), Dise and
Wright (1995) observed a broad range of watershed responses (Figure 7.8).
Nitrogen output was most highly correlated with input N (r
2
= 0.69), but
also significantly correlated with input S, soil pH, percent slope, bedrock
1416/frame/C07 Page 172 Wednesday, February 9, 2000 2:15 PM
© 2000 by CRC Press LLC
Nitrogen Dynamics 173
type, and latitude. A combination of input N (positive correlation) and soil
pH (negative correlation) explained 87% of the variation in output N at 20
sites (Dise and Wright, 1995).
The issue of recovery of water quality subsequent to emissions reduction
was examined by Emmett et al. (1998) using data from the roof exclusion
experiments in The Netherlands (Ysselsteyn and Speuld) and at Solling in
Germany. Nitrogen deposition was experimentally reduced at these sites by
60 to 95%. In response, the N flux in drainage water decreased substantially
within a few years (Bredemeier et al., 1998a; Emmett et al., 1998). Thus, a
continuing supply of N from the atmosphere appears to be important to
maintaining high N leaching losses at these high N status sites. Improve-
ment in water quality may be expected at such sites when deposition levels
are decreased.
FIGURE 7.8
Nitrogen outputs in soil water and stream water vs. N deposition inputs throughout Europe.
Thresholds were identified below and above which forested plots and catchments did not
leach inorganic N and consistently leached large quantities of inorganic N, respectively.
(Reprinted from Forest Ecology and Management, Vol. 71, Dise, N.B. and R.F. Wright,
Nitrogen leaching from European forests in relation to nitrogen deposition, p. 157, Copyright
1995. With permission from Elsevier Science.)
1416/frame/C07 Page 173 Wednesday, February 9, 2000 2:15 PM
© 2000 by CRC Press LLC