AQUATIC EFFECTS OF ACIDIC DEPOSITION - CHAPTER 10 pot
Bạn đang xem bản rút gọn của tài liệu. Xem và tải ngay bản đầy đủ của tài liệu tại đây (932.73 KB, 21 trang )
237
10
Case Study: Adirondack Park, NY
10.1 Background and Available Data
The Adirondack Mountain region of New York is one of the most intensively
studied regions of the world with respect to the effects of acidic deposition on
aquatic resources. Acidic deposition effects research in the Adirondacks has
played an important role in many of the areas of major scientific advance-
ment during the last decade. For that reason, the results of research con-
ducted in the Adirondack region are widely discussed throughout this book.
These include improved understanding of N cycling and effects, results of
surface water quality monitoring efforts, extensive model testing, paleolim-
nological inferences of both long- and short-term acidification responses, and
interactions between land use and acidification processes.
This chapter is not intended to summarize current understanding of acidi-
fication sensitivities of Adirondack surface waters or the effects to date of S-
driven acidification. These topics have been thoroughly discussed by Sulli-
van (1990), Driscoll et al. (1991), Baker et al. (1990b), and others.
Rather, the attempt here is to summarize some of the recent findings that
relate to the major topics of this book. The focus of this chapter is largely on
research in which the author has been involved personally. However, there
has also been extensive research conducted by many other scientists in the
Adirondack Mountains in recent years. Many aspects of their research are
discussed and referenced in other chapters of this book.
The region is mountainous with numerous lakes, many of which have
low concentrations of base cations and are, therefore, susceptible to acidifi-
cation from addition of mineral acid anions such as SO
4
2-
and NO
3
-
and nat-
urally occurring organic acid anions (Driscoll et al., 1991). Elevations range
from about 30 m near Lake Champlain to 1630 m in the High Peaks area of
the northeastern Adirondacks. The highlands region extends to the north,
west, and south of the High Peaks and is dissected by numerous deep linear
valleys formed by glacial erosion. At the center of the region is a large igne-
ous intrusion that has undergone extensive metamorphosis. Bedrock geol-
1416/frame/ch10 Page 237 Wednesday, February 9, 2000 2:23 PM
© 2000 by CRC Press LLC
238
Aquatic Effects of Acidic Deposition
ogy includes areas of granite and granitic gneiss, anorthosite, quartz
syenite, and metasediments.
Thin, acidic spodosol soils have developed on glacial sediments from the
Wisconsin glaciation about 12,000 YBP. Much of the forest land is covered
with northern hardwood forests, mainly yellow birch (
Betula alleghaniensis
),
American beech (
Fagus grandifolia
), and sugar maple (
Acer saccharum
). Some
of these hardwood forests are mixed with red spruce (
Picea rubens
), balsam
fir (
Abies balsamea
), and eastern hemlock (
Tsuga canadensis
). At higher eleva-
tions, red spruce and balsam fir predominate, with extensive areas of paper
birch (
Betula papyrifera
) where fire has occurred. Wetlands are common,
especially at lower elevations.
Approximately 14% of the lakes represented by the Eastern Lake Survey's
probability sample (Linthurst et al., 1986) were acidic (ANC less than or equal
to 0). Sullivan et al. (1990b) concluded that this percentage would approxi-
mately double if lakes smaller than 4 ha had been included in the frame pop-
ulation, largely because a high proportion of the small lakes were organic
acid systems. The Adirondack Mountains have been the focus, in part or in
whole, of numerous major acid deposition research programs, including the
Integrated Lake-Watershed Acidification Study (ILWAS; Chen et al., 1983),
the Regionalized Integrated Lake-Watershed Acidification Study (RILWAS;
Driscoll and Newton, 1985), the Adirondack Lake Survey Corporation
(ALSC) survey (Kretser et al., 1989; Baker et al., 1990b), the Paleoecological
Investigation of Recent Lakewater Acidification studies, PIRLA-I (Charles
and Whitehead, 1986a,b), and PIRLA-II (Charles and Smol, 1990), Oak Ridge
National Laboratory Watershed Assessment (Hunsaker et al., 1986a,b), the
Adirondack Effects Assessment Program (Momen and Zehr, 1998), and many
of the major studies conducted within the Environmental Protection
Agency's (EPA) Aquatic Effects Research Program (AERP): the Eastern Lake
Survey, Phase I and Phase II (Linthurst et al., 1986; Herlihy et al., 1991), Direct
Delayed Response Project (Church et al., 1989), Episodic Response Project
(Wigington et al., 1993), and Long Term Monitoring Program (Driscoll and
van Dreason, 1993; Newell 1993).
Precipitation chemistry is generally rather uniform across the Adirondack
region. Regional patterns in wet deposition of S and N are owing mainly to
differences in precipitation amount (Driscoll et al., 1991). Total atmospheric
deposition of S has been estimated by Sisterson et al. (1990) and Driscoll et al.
(1991) to be in the range of 9 to 12 kg S/ha per year in the Adirondacks. Most
available N deposition data are for low elevation sites, where deposition of N
is generally less than at the moderate to high elevation sites of acidified
Adirondack lakes (Friedland et al., 1991). In addition, estimates of N dry dep-
osition are subject to considerable uncertainty (Baker, 1991). Ollinger et al.
(1995) estimated total N deposition in the northeastern U.S. ranging from 3 to
4 kg N/ha per year in northern Maine to values in the range of 10 to 12 kg
N/ha per year in mountainous areas of New York and southwestern Penn-
sylvania. Estimated total N deposition in the Adirondack region generally
1416/frame/ch10 Page 238 Wednesday, February 9, 2000 2:23 PM
© 2000 by CRC Press LLC
Case Study: Adirondack Park, NY
239
varied between 8 and 12 kg N/ha per year, with highest values at high eleva-
tions (Ollinger et al., 1993).
The accumulation and release of S and N in seasonal snowpacks are impor-
tant factors that influence the delivery of atmospheric deposition to soils and
surface waters in the Adirondacks. The SO
4
2-
and NO
3
-
pools in the snowpack
generally reach maximum values in March and then decline throughout snow-
melt (Rascher et al., 1987). Preferential elution of ions in the snowpack causes
a pulse of SO
4
2-
and NO
3
-
to be released early in the melting process (Schaefer
et al., 1990). The dominant anion in the snowpack is generally NO
3
-
. This is
owing to the seasonal patterns in deposition, which show highest N concen-
trations in precipitation during winter and highest S concentrations during
summer (Driscoll et al., 1991).
Data were examined for this case study from most of the principal rele-
vant studies that have been conducted in recent years in the Adirondack
Mountain region. In addition to examining data from the ELS-I statistical
survey, appropriate data were analyzed from the ALSC, ELS-II, DDRP,
PIRLA-II, ALTM, and ERP. Each database provides particular kinds of
information and analytical strengths, as described in the following sections
(Sullivan et al., 1999).
10.1.1 ELS-I
In 1984, the EPA conducted an extensive survey of lake-water chemistry in
selected areas of the eastern U.S. (Kanciruk et al., 1986). The ELS-I was based
on a statistical probability design such that extrapolations with known uncer-
tainty could be performed to estimate the number of lakes in each study
region that exhibited various characteristics of acid–base chemistry. Prior to
sample selection, a frame population was identified from 1 : 250,000 scale
maps of the regions. The average minimum lake area was about 4 ha, corre-
sponding to the approximate resolution of the map scale used to specify the
sampling frame.
10.1.2 ALSC
The Adirondack Lakes Survey Corporation (ALSC) conducted a 6-year (1984
to 1990) survey to quantify the chemistry and fisheries of Adirondack waters
(Kretser et al., 1989). Approximately 24% of the 1469 lakes surveyed had pH
values of 5.0 or lower, while 26% had ANC values less than 0
µ
eq/L (Baker
et al., 1990b). Natural inputs of organic acids are important in regulating the
acidity of some lakes (Munson and Gherini, 1993; Driscoll et al., 1994), but
many ALSC lakes appeared to have been acidified by acidic deposition.
Lakes judged most susceptible to acidic deposition effects were drainage
lakes surrounded by thin deposits of glacial till, which represent approxi-
mately 35% of all waters surveyed by the ALSC (Baker et al., 1990b).
1416/frame/ch10 Page 239 Wednesday, February 9, 2000 2:23 PM
© 2000 by CRC Press LLC
240
Aquatic Effects of Acidic Deposition
10.1.3 ELS-II
During Phase II of the Eastern Lake Survey (ELS-II), a subset of ELS-I lakes
was resampled during the spring and fall of 1986. This database provides two
principal advantages over ELS-I
1. Chemical measurements were made during the spring season,
when lakes are lowest in pH and ANC, and the concentrations of
NO
3
-
and potentially toxic inorganic monomeric Al (Al
i
) are gen-
erally at their highest.
2. Aqueous Al was fractionated in the laboratory into labile and non-
labile components, thereby allowing direct estimation of Al
i
con-
centrations in lake waters. Aluminum fractionation was not
performed in ELS-I.
10.1.4 DDRP
The Direct Delayed Response Project (DDRP) provided the foundation for
NAPAP's surface water modeling efforts. Included in this study were 37
Adirondack lakes. They were statistically selected from the ELS-I sample,
and included lakes low to moderate in ANC (less than or equal to 400
µ
eq/L)
and larger than 4 ha in area (Church et al., 1989). MAGIC model (Cosby et al.,
1985a,b) hindcasts and forecasts of lake-water chemistry have been con-
structed for the DDRP lakes (Church et al., 1989; NAPAP, 1991; Sullivan et al.,
1992, 1996a). DDRP databases include model estimates and watershed data.
10.1.5 PIRLA
Diatom inferences of pre-industrial pH and historical acidification have been
constructed for numerous lakes in the Adirondack Mountains, including the
DDRP lakes. This work was conducted as part of the Paleolimnological
Investigation of Recent Lakewater Acidification studies, PIRLA-I (Charles
and Whitehead, 1986a,b) and PIRLA-II (Charles and Smol, 1990). Results
have been discussed by Charles et al. (1990), Sullivan et al. (1990a), and Cum-
ming et al. (1992). The PIRLA-II data provide a statistically based assessment
of the magnitude of historical acidification and the spatial distribution of his-
torically acidified lakes. In addition, the recent trends research component of
PIRLA-II provided detailed information on the timing of acidification of 20
Adirondack lakes (Cumming et al., 1994).
10.1.6 ALTM
The Adirondack Long-Term Monitoring Program (ALTM) was initiated in
1982 to assess temporal changes in water chemistry in 17 Adirondack lakes
1416/frame/ch10 Page 240 Wednesday, February 9, 2000 2:23 PM
© 2000 by CRC Press LLC
Case Study: Adirondack Park, NY
241
(Driscoll and Newton, 1985; Driscoll and Van Dreason, 1993). In this ongoing
program, samples are collected monthly to determine long-term changes or
trends in water chemistry. This database provides a basis for evaluating the
seasonal variability of key chemical parameters.
10.1.7 ERP
The Episodic Response Project (ERP) was designed to investigate episodic
chemical changes, and consequent biological effects, in stream water in three
areas of the northeastern U.S., including the Adirondack Mountains (Wiging-
ton et al., 1993, 1996). Studied during rainfall and snowmelt hydrological
events were four Adirondack streams. The ERP data provide information on
changes in the chemical composition of Adirondack streamwater during
periods of acute, short-term toxicity to fish. This database, therefore, provides
evidence regarding the role of N as a contributor to episodic acidification and
the acute toxicity to fish of short-term increases in Al
n
+
and H
+
ions.
10.2 Watershed History
There are two major aspects of watershed history that are likely to have inter-
acted with acidification from acidic deposition in the Adirondack region: log-
ging and forest blowdown. Each has been the focus of recent work, although
the precise role of neither has been quantified. The history of Adirondack for-
ests, and human impact on those forests, is complex. Major elements were
described in the forest history compiled by McMartin (1994) and subse-
quently summarized by Sullivan et al. (1996b, 1999). The information pre-
sented next is taken from those publications. Some Adirondack land in the
eastern and northeastern sections of the region was cleared for farming, but
the amount was not significant. The major land use activity during the last
century has been forestry. Early development of the lumber industry was
hampered by a lack of suitable transportation. Initial logging activities
focused almost exclusively on white pine that was never particularly abun-
dant in the Adirondack forests (Ketchledge, 1965). By 1850, most of the acces-
sible pine was gone and logging efforts had shifted to spruce. Early logging
activities did not significantly alter the forest because the pines and spruce
occurred mostly as scattered trees and the early logging was highly selective.
Prior to 1890, much of the future Adirondack Park had not been logged at
all and the logging that had occurred had been selective. Most of the early
logging was done close to waterways because the cut logs were floated
downriver to the mill sites. Furthermore, there was not enough spruce in the
primarily hardwood forests of the central and southwestern Adirondacks to
justify logging there. Loggers would have needed roads or tracks for horses
1416/frame/ch10 Page 241 Wednesday, February 9, 2000 2:23 PM
© 2000 by CRC Press LLC
242
Aquatic Effects of Acidic Deposition
to reach the isolated pockets of spruce and these were expensive to build
(McMartin, 1994).
The first railroad crossed the central Adirondacks in 1892 (Donaldson,
1921). Soon, railroad spurs became an important means of shipping lumber
from mills in the interior. The pulp and paper industries appeared after
1880, and by 1920 had exhausted much of the spruce and balsam resources
of the region. The combination of cut-over forests, drought, and sparks
from locomotives on the railroads caused fires that seriously affected tim-
ber tracts around the turn of the century. During the fires of 1903 alone,
292,000 acres of timber and 172,000 acres of brush land burned in the
Adirondacks (Middleton, 1904).
The years around the turn of the twentieth century marked unusually dra-
matic changes in the Adirondack forest (McMartin, 1994). The first sequence
of events involved political changes that ultimately led to the creation of the
Adirondack Park, and included the state's acquisition of land, establishment
of the Forest Preserve, and then, finally, creation of the Park in 1892. The sec-
ond important sequence of events involved changes in the forest industries.
The construction of railroads within the region permitted logging over a
much greater area than had previously been permitted. The use of wood in
the production of pulp and paper meant that smaller logs and logs of all
kinds could be used (Donaldson, 1921). Loggers returned to land from which
spruce sawlogs had earlier been taken to remove virtually all of the remain-
ing spruce as small as 5 or 6 inches in diameter. The increasing loss of forest
caused growth in the preservation movement, while a growing shortage and
high demand for timber further accelerated the cutting. The result was that
the greatest number of trees were cut in the Adirondacks from 1890 to 1910
(Donaldson , 1921; McMartin, 1994). There was a decrease from nearly 2 mil-
lion acres of virgin forest in 1885 to slightly more than 1 million acres in 1902,
to just a few hundred thousand acres in 1910 (McMartin, 1994).
Many of the watersheds in the portions of the Adirondacks most impacted
by recent acidification were logged around the turn of the century (Sullivan
et al., 1996b). The year 1901 marked the last large log drive on the Black River
in the southwestern Adirondacks, the supply of lumber nearly having been
exhausted (McMartin, 1994). The steep slopes of the High Peaks region had
been inaccessible to loggers in the early days of Adirondack logging. By the
early 1900s, however, lumbermen were harvesting increasingly inaccessible
stands, including those in the High Peaks region. High elevation sites were
logged for spruce and balsam fir to support the pulp industry. The High
Peaks region remained a major source of spruce and balsam fir logs through
the 1920s (McMartin, 1994).
Logging has played a smaller role as an agent of change in the Adirondack
watersheds that have experienced recent acidification since the early decades
of the twentieth century. Within the park, forest succession is gradually
restoring the natural condition (Ketchledge, 1965). However, additional
changes in land cover have occurred in response to windthrow, particularly
during one unusually severe storm that struck the region in 1950. This large
1416/frame/ch10 Page 242 Wednesday, February 9, 2000 2:23 PM
© 2000 by CRC Press LLC
Case Study: Adirondack Park, NY
243
storm, known as the Big Blow, severely damaged large tracts of forest in the
Adirondacks. Most of the estimated 171,000 ha of forests that were damage
occurred between the High Peaks Region and the southwestern boundary of
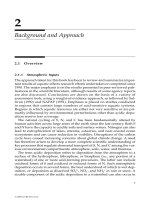
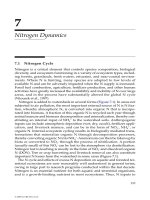
FIGURE 10.1
Map of A) measured hydrogen ion concentration, and B) diatom-inferred decreases in hydrogen
ion concentration from pre-industrial times to the present for lakes in the Adirondack Park that
were included in the DDRP statistical design. (Source:
Water, Air, Soil Pollut
., Vol. 95, 1997, p. 322,
Increasing role of nitrogen in the acidification of surface waters in the Adirondack Mountains,
New York, Sullivan, T.J., J.M. Eilers, B.J. Cosby, and K.B. Vaché, Figure 4, Copyright 1997. Re-
printed with kind permission from Kluwer Academic Publishers.)
1416/frame/ch10 Page 243 Wednesday, February 9, 2000 2:23 PM
© 2000 by CRC Press LLC
244
Aquatic Effects of Acidic Deposition
the park. This is the portion of the Adirondack Mountains that currently con-
tains the majority of the acidic lakes (Baker et al., 1990a,c; Figure 10.1a) and
that has experienced the greatest acidification since pre-industrial times (Sul-
livan et al., 1990a, 1997). Many areas experienced in excess of 75% forest
blowdown, particularly on eastern slopes and the western shores of lakes.
This was one of the most severe storms on record for the northeastern U.S.
(Bristor, 1951).
Dobson et al. (1990) investigated the relationship between lake-water pH
and blowdown from the 1950 storm for several Adirondack data sets, includ-
ing 12 lakes in the High Peaks Region, a group of 43 headwater lakes, 11 lakes
studied by the National Research Council (1986), and 23 RILWAS lakes
(Driscoll and Newton, 1985). The High Peaks Region was extensively dam-
aged by the Big Blow, especially above 760 m elevation. Dobson et al. (1990)
found a strong spatial correlation between lake acidity and the percentage of
the watersheds that experienced blowdown.
Field reconnaissance was conducted by Dobson et al. (1990) in the High
Peaks Region, Big Moose Lake and vicinity, and at other Adirondack lakes. In
all areas, pipe networks in the soil from former tree roots were found in jux-
taposition to stumps from the 1950 blowdown and other stumps of a similar
age. Dobson et al. (1990) contended that the abundance of pipes in the soil
would short-circuit the normal infiltration processes and diminish the extent
of acid neutralization of acidic precipitation. Pipes and pipeflow appeared to
be a significant hydrologic pathway in all investigated blowdown areas.
Based on the abundance of correlative data supporting a relationship
between blowdown and low lake-water pH and the observed occurrence of
networks of pipes in the affected areas, the authors concluded that blow-
down from the 1950 storm likely played an important role in recent acidifica-
tion of many Adirondack lakes. It is also possible (but not demonstrated),
however, that the watersheds most susceptible to acidic deposition are also
those most susceptible to blowdown, irrespective of any cause/effect rela-
tionship (Sullivan et al., 1996b).
10.3 Lake-Water Chemistry
Regional variation in the ANC of Adirondack lakes is owing mainly to geo-
logic factors that influence the supply of base cations to drainage waters,
rather than to inputs of SO
4
2-
(Driscoll et al., 1991). Sulfate concentrations in
lake water are fairly uniform throughout the region, whereas base cation
(which neutralizes SO
4
2-
acidity) concentrations are low (less than 150
µ
eq/L) primarily in the southwestern Adirondacks. Acidic Adirondack
lakes are generally underlain by granitic gneiss and are situated in areas of
the park that receive the greatest precipitation input (Driscoll et al., 1991).
Studies of acidity and acidification of Adirondack lakes have focused
1416/frame/ch10 Page 244 Wednesday, February 9, 2000 2:23 PM
© 2000 by CRC Press LLC
Case Study: Adirondack Park, NY
245
mainly on atmospheric inputs of S and base cation release (weathering and
ion exchange) from soils, and secondarily on organic anion acidity, N
dynamics, and Al mobilization. Such processes constitute the central core
of the various mathematical modeling efforts to predict the response of
Adirondack lakes to changing levels of S and N deposition (e.g., Cosby et
al., 1989; NAPAP, 1991; Sullivan et al., 1996a).
Results from the ALTM Program showed consistent decreases in SO
4
2-
con-
centrations in lakes in the Adirondacks during the past two decades, with no
lakes showing increasing concentrations (Driscoll and Van Dreason, 1993;
NAPAP, 1998). Sulfate concentrations had been declining in Adirondack
lakes since sometime in the 1970s (Sullivan, 1990). These trends of decreasing
SO
4
2-
concentration in surface waters are consistent with decreases in SO
2
emissions in the eastern U.S. and decreases in SO
4
2-
concentration in precipi-
tation in the Northeast (Driscoll and Van Dreason 1993). Despite this decline
in atmospheric SO
4
2-
inputs, there has been no increase in lake ANC and some
of the ALTM lakes exhibited continued acidification despite the reduction in
lake-water SO
4
2-
concentrations. Nitrate concentrations had increased in nine
of the ALTM lakes through about 1990. Atmospheric deposition of N in the
Adirondacks has not changed appreciably since the 1970s, so the mechanism
responsible for this increase in NO
3
-
was unclear. However, Driscoll and van
Dreason (1993) noted that elevated atmospheric deposition of N, coupled
with diminished biotic demand owing to increasing stand age, could be a
contributing factor.
Stoddard (1994) quantified statistically significant increases in lake-water
NO
3
-
over time from 1982 to 1990 in more than one-half of the ALTM lakes.
The increases in lake-water NO
3
-
concentration ranged from 0.4 to 1.8
µ
eq/L
per year, with an average increase of 1
µ
eq/L per year. These data were inter-
preted to suggest that many Adirondack watersheds were becoming increas-
ingly N saturated (Stoddard, 1994) which could cause a continued
deterioration of the acid–base status of the lakes and streams in these water-
sheds unless in-lake and in-stream processes consume NO
3
-
and generate
additional ANC. However, more recent (post-1990) data for ALTM lakes
show a decline in lake-water NO
3
-
concentrations in recent years (Driscoll et
al., 1995; Mitchell et al., 1996) that may be owing to climatic variations. It
seems that an improved understanding of the factors that control NO
3
-
leach-
ing in terrestrial environments is needed before we can accurately predict the
long-term effects of N deposition on lake-water chemistry.
Past changes in lake-water acid–base status have been estimated, based on
analyses of diatom and chrysophyte remains in lake sediments. A large num-
ber of Adirondack lakes have been included in paleolimnological studies,
especially PIRLA-I and PIRLA-II. Diatom-inferred changes in lake-water pH
and/or ANC since pre-industrial times have been reported for about 70 lakes
in the region (Charles et al., 1989; Sullivan et al., 1990; Cumming et al., 1992).
A few lakes have also been analyzed for diatom microfossils at frequent inter-
vals of the sediment cores, thereby allowing estimation of the timing of acid-
ification responses in these lakes (Charles et al., 1990).
1416/frame/ch10 Page 245 Wednesday, February 9, 2000 2:23 PM
© 2000 by CRC Press LLC
246
Aquatic Effects of Acidic Deposition
PIRLA-I studied 12 dilute, low-alkalinity Adirondack Lakes (Charles et al.,
1990). Stratigraphic profiles of diatoms, chrysophytes, cladocera, and chi-
ronomids generally showed consistent patterns of change. The 8 PIRLA-I
lakes that had measured pH less than 5.5 all showed diatom and chrysophyte
evidence of recent acidification. The diatom-inferred onset of acidification
occurred around 1900 to 1920 in four of the lakes. Diatom-inferred acidifica-
tion began or accelerated around 1950 in two of those same lakes, as well as
two others (Sullivan et al., 1999). Lakes with current pH greater than 6.0 and
alkalinity greater than 50
µ
eq/L showed little or no evidence of acidification.
In addition to the diatom inferences of historical changes in lake-water
acid–base chemistry provided by PIRLA-I, such inferences have also been
calculated for other lakes using the sedimentary remains of scaled chryso-
phytes. Chrysophyte-inferred pH was estimated at frequent time intervals
for PIRLA-II Adirondack lakes (Cumming et al., 1994) and can be used to
establish the timing of acidification in the same manner as has been done by
the diatom inferences from PIRLA-I lakes. Cumming et al. (1994) recon-
structed the pH histories of 20 low-alkalinity (ANC less than 30
µ
eq/L)
Adirondack lakes based on the species composition of chrysophytes in strati-
graphic intervals from
210
Pb dated sediment cores. The sediment cores were
sectioned at multiple intervals reflecting the period from about 1850 to about
1985. About 80% of the study lakes were inferred to have acidified since pre-
industrial times. Many showed evidence of acidification beginning around
the turn of the century, some of which showed evidence of some recovery
since about 1970. A pattern of beginning or accelerating acidification around
1950 was also commonly observed. This was attributed by Cumming et al.
(1994) to the higher levels of S deposition during that period. This pattern
could also be owing, at least in part however, to the 1950 blowdown (Dobson
et al., 1990; Sullivan et al., 1996b). Perhaps not coincidentally, the major log-
ging in the areas of the Adirondacks that experienced significant acidification
occurred around the turn of the century (McMartin, 1994). Thus, the onset of
acidification of several study lakes for which diatom- or chrysophyte-
inferred acidification chronologies are available corresponds temporally to
both the onset or increase in acidic emissions and deposition and also the
occurrence of major landscape disturbances associated with logging or blow-
down. Recent research and assessment efforts have focused heavily on dep-
osition aspects, with comparatively little treatment of the watershed
disturbance and forest regrowth aspects other than the studies of Dobson et
al. (1990), Davis et al. (1994), and Sullivan et al. (1996b, 1999).
10.4 Organic Acidity
Naturally occurring organic acids exert an important influence on the
acid–base chemistry of lake waters throughout the Adirondack region. Many
1416/frame/ch10 Page 246 Wednesday, February 9, 2000 2:23 PM
© 2000 by CRC Press LLC
Case Study: Adirondack Park, NY
247
of the lakes that exhibit low pH and ANC contain relatively high concentra-
tions of DOC (greater than 400
µ
M). The smaller lakes, in particular, often
contain substantial amounts of organic acidity (Sullivan et al., 1990b). With
completion of the ALSC database of over 1400 lakes, the majority of which
are small, research on the role of organic acids in Adirondack lakes acceler-
ated (e.g., Munson and Gherini, 1993; Driscoll et al., 1994).
Organic acidity of Adirondack lakes has also been the focus of recent efforts
to test and improve the MAGIC model, a lumped-parameter process model
of catchment-scale acidification (Cosby et al., 1985a,b). Sullivan et al. (1991,
1992) compared MAGIC model hindcasts and paleolimnological inferences
of historical acidification (based on diatom-inferred pH) for a set of 33 statis-
tically representative Adirondack lakes. This study represented the first
regional and statistical model confirmation exercise conducted for a process-
based acid–base chemistry model. These two assessment methods differed
primarily in that MAGIC inferred greater acidification and also that acidifi-
cation had occurred in all lakes in the comparison. The diatom approach
inferred that acidification had been restricted to low-ANC lakes (currently
less than about 50
µ
eq/L). The lack of organic acid representation in the
MAGIC simulations was judged to be an important factor contributing to the
differences in acidification implied by the two approaches. Organic acids
commonly exert a large influence on surface water acid–base chemistry, par-
ticularly in dilute waters having moderate to high dissolved organic carbon
(DOC) concentrations. Subsequently, MAGIC was extended by incorporat-
ing a quantitative organic acid representation, based on empirical data and
geochemical considerations (Driscoll et al., 1994), and the model was tested
using the paleolimnological hindcast data (Sullivan et al., 1996a). See Chapter
9 for additional discussion of this study.
Results of the hindcast comparisons between paleolimnological inferences
of pre-industrial lake-water pH and MAGIC simulations, with and without
the inclusion of organic acids, illustrated three important points
1. There was a systematic departure with decreasing pH between
diatom and MAGIC model hindcasts of pre-industrial pH when
organic acids were not included in the MAGIC simulations.
2. Inclusion of a reasonable formulation for organic acidity in the
MAGIC simulations of pre-industrial pH greatly improved the
agreement with diatom reconstructions, particularly for lakes hav-
ing pH less than 6.0.
3. The choice among organic acid analog models (e.g., mono-, di-,
triprotic, or Oliver model) did not alter the agreement with diatom
reconstructions to an appreciable degree for a regional analysis.
The inclusion of organic acids in the MAGIC model simulations of pre-
industrial pH did not alter the agreement between diatom and MAGIC
model hindcasts for lakes with pH values greater than about 6.5. Previous
1416/frame/ch10 Page 247 Wednesday, February 9, 2000 2:23 PM
© 2000 by CRC Press LLC
248
Aquatic Effects of Acidic Deposition
hindcast comparisons (Sullivan et al., 1991) that did not include an organic
acid representation had obtained good agreement for these high-pH lakes.
For low-pH lakes, however, the lack of organic acid representation had
resulted in an increasing level of divergence between diatom and MAGIC
model hindcasts of pre-industrial pH. Thus, the lakes of greatest relevance
with respect to potential biological effects of acidification, especially those
having pH less than 5.5, exhibited increasingly larger discrepancies with
decreasing pH between diatom and MAGIC model estimates of pre-indus-
trial pH when organic acids were omitted from the analysis. The inclusion of
an organic acid representation in the MAGIC simulations conducted in this
study resulted in a great improvement in the agreement between these two
modeling approaches (Sullivan et al., 1996a).
The results of these analyses of Adirondack lakes demonstrated that
1. Organic acids must be considered in modeling the response of lake
waters in the Adirondack Mountains to acidic deposition.
2. Once organic acids are included in the modeling approach, reason-
able agreement is obtained in hindcast comparisons with diatom-
inferred pH.
The demonstrated agreement between MAGIC and paleolimnological
model hindcast estimates of lake-water pH was dependent upon inclusion of
organic acids in the process model despite the relatively low concentrations
of DOC in the study lakes (mean value equal to 313
µ
M C).
10.5 Role of Nitrogen in Acidification Processes
Prior to 1990, most studies of lake-water acid–base chemistry in the Adiron-
dack region neglected N as a potential agent of chronic acidification because
acid-sensitive watersheds were believed to retain almost all atmospheric N and
because lake-water NO
3
-
concentrations were low relative to SO
4
2-
in the major-
ity of lakes sampled during the summer or fall seasons. However, recent
research has suggested that the majority of Adirondack lakes have not acidified
since pre-industrial times (Sullivan et al., 1990b, 1992) and, therefore, chronic
NO
3
concentrations in those unacidified lakes are largely irrelevant with
respect to questions of acidification causality (Sullivan et al., 1997). In addition,
recent estimates of the magnitude of chronic acidification of Adirondack lakes
(Sullivan et al., 1990a, 1992) are substantially lower than was widely believed
prior to preparation of the NAPAP technical and assessment documents.
Given these relatively recent research findings suggesting that acidification has
been less widespread and of lower magnitude than previously suspected, a re-
evaluation of the relative role of N has been occurring (Sullivan et al., 1997).
1416/frame/ch10 Page 248 Wednesday, February 9, 2000 2:23 PM
© 2000 by CRC Press LLC
Case Study: Adirondack Park, NY
249
In a survey of N output from 65 forested plots and catchments throughout
Europe, Dise and Wright (1995) found a deposition threshold of about 10 kg
N/ha per year, below which significant N leaching did not occur. At deposi-
tion levels between 10 and about 25 kg N/ha per year, Dise and Wright (1995)
found substantial variability in the rates of N leaching, from near zero to
leaching rates that approached deposition loading rates. Estimates of total N
deposition in the Adirondacks (10 to 12 kg N/ha per year; Ollinger et al.,
1995) are in the range of the 10 kg N/ha per year threshold found in Europe.
Thus, leaching rates in the Adirondacks may be expected to increase in the
future under higher loading, at least for some lakes.
The concentration of NO
3
-
in Adirondack lake waters surveyed in 1984 by
the ELS and in 1985 to 1987 by the ALSC exhibited a pronounced geo-
graphic pattern, with high concentrations occurring primarily in the west-
ern and southwestern Adirondacks, and secondarily in the High Peaks
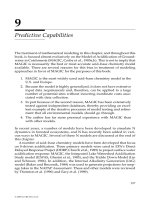
region (Sullivan et al., 1997; Figures 10.2a and 10.3). During the fall season,
lake-water NO
3
-
concentrations in the range of 5 to 20
µ
eq/L were com-
monly found in these areas of the park by both the ELS-I (Figure 10.2a) and
ELS-II (data not shown) surveys. During the spring, the geographical dis-
tribution of lake-water NO
3
-
concentrations sampled by ELS-II was similar,
but spring concentrations were about two-fold higher than concentrations
in the fall. The observed spatial patterns in lake-water NO
3
-
in both the sta-
tistically based ELS and the extensive survey conducted by ALSC corre-
sponded closely with the distribution of lake-water acidity (Figure 10.1a)
and also the distribution of diatom-inferred acidification from pre-indus-
trial times to the present (Figure 10.1b).
The observed concentrations of NO
3
-
in lake waters during the fall and
summer seasons (Figures 10.2a and 10.3) were of approximately the same
magnitude as the diatom-inferred increases in H
+
concentration (Figure
10.1b) and the diatom-inferred historical decline in ANC reported by Sulli-
van et al. (1990a). Analyses of Adirondack lakes inferred from diatom records
to have acidified since pre-industrial times suggested declines in ANC aver-
aging 18
µ
eq/L (quartiles 5, 23
µ
eq/L) for currently acidic lakes and 7
µ
eq/L (quartiles 0, 13
µ
eq/L) for lakes currently having ANC between 0
and 25
µ
eq/L (Sullivan et al., 1990a). Diatom-inferred increases in H
+
of
about 5 to 25
µ
eq/L were tabulated (Figure 10.1b) from the pH-inferences
reported by Cumming et al. (1992).
Both the quantitative estimates of historical acidification, inferred from dia-
tom reconstructions of H
+
and ANC, and the spatial distribution of acidic and
acidified lakes correlate closely with the magnitude and spatial distribution
of lake-water NO
3
-
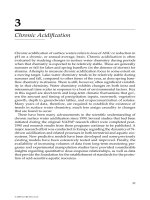
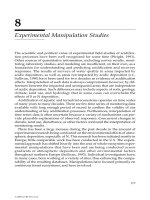
concentrations (Sullivan et al., 1997). In contrast, lake-
water SO
4
2-
concentrations are much higher and show no spatial pattern (Fig-
ure 10.2b), although precipitation amounts and, therefore, total S loading are
highest in the southwestern portion of the park. It is possible that these geo-
graphic correlations between NO
3
-
concentration and acidification are coinci
-
dental. However, these patterns lend support to the hypothesis that N plays
1416/frame/ch10 Page 249 Wednesday, February 9, 2000 2:23 PM
© 2000 by CRC Press LLC
250
Aquatic Effects of Acidic Deposition
a more significant role in chronic lake-water acidification in the Adirondacks
than was believed in 1990.
FIGURE 10.2
Map of A) NO
3
-
and B) SO
4
2-
concentrations in Adirondack lakes measured in the ELS-I statistical
survey. The survey was conducted during the fall season. (Source:
Water, Air, Soil Pollut
., Vol.
95, 1997, p. 320, Increasing role of nitrogen in the acidification of surface waters in the Adirondack
Mountains, New York, Sullivan, T.J., J.M. Eilers, B.J. Cosby, and K.B. Vaché, Figure 2, Copyright
1997. Reprinted with kind permission from Kluwer Academic Publishers.)
1416/frame/ch10 Page 250 Wednesday, February 9, 2000 2:23 PM
© 2000 by CRC Press LLC
Case Study: Adirondack Park, NY
251
Very different conclusions were drawn by Stoddard (1994), who reported
median values of NO
3
-
: (NO
3
-
+ SO
4
2-
) ratios in surface waters of acid-sensi-
tive regions of the U.S. sampled in EPA's National Surface Water Survey. In
most regions, the median value was less than 0.2, and it was only 0.005 in the
Adirondacks. Stoddard (1994) interpreted these findings as an indication that
chronic acidification is more closely tied to SO
4
2-
than to NO
3
-
. Similarly, van
Miegroet (1994) concluded that N is not an important contributor to chronic
acidification, although she stated that the relative role of NO
3
-
is expected to
increase as more forested watersheds become N saturated and abatement
policies for S take effect. Sullivan et al. (1997) contended that regional average
NO
3
-
concentrations are of little interest, however; NO
3
-
concentrations in
only those lakes that have acidified and the dynamics of the acidification pro-
cess are more relevant.
Because SO
4
2-
concentrations in most Adirondack lakes are so much higher
(typically by approximately 100
µ
eq/L) than NO
3
-
concentrations during the
fall season, it has generally been assumed that SO
4
2-
is the dominant cause of
mineral acidity in these lakes. This is not necessarily the case, however, par-
ticularly if NO
3
-
and SO
4
2-
follow different hydrological pathways in reaching
the lakes. A significant proportion of the observed lake-water NO
3
-
in the fall
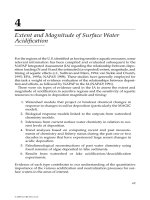
FIGURE 10.3
Map of summer NO
3
-
concentrations in drainage lakes sampled by the ALSC. High concentra-
tions of NO
3
-
(greater than 5
µ
eq/L) were found almost exclusively in the southwestern Ad-
irondacks and the High Peaks region. (Source:
Water, Air, Soil Pollut
., Vol. 95, 1997, p. 321,
Increasing role of nitrogen in the acidification of surface waters in the Adirondack Mountains,
New York, Sullivan, T.J., J.M. Eilers, B.J. Cosby, and K.B. Vaché, Figure 3, Copyright 1997.
Reprinted with kind permission from Kluwer Academic Publishers.)
1416/frame/ch10 Page 251 Wednesday, February 9, 2000 2:23 PM
© 2000 by CRC Press LLC
252
Aquatic Effects of Acidic Deposition
sampling of ELS-I can be attributed to direct precipitation inputs of NO
3
-
to
the lake surfaces (Sullivan et al., 1997). This is consistent with the expected
high retention of N in forest soils, and provides a mechanism to explain what
may be the greater acidifying potential of in-lake NO
3
-
as compared to in-lake
SO
4
2-
in these lakes. If most or all in-lake NO
3
-
was derived from direct pre-
cipitation inputs, this NO
3
-
would be expected to decrease lake-water ANC
stoichiometrically. If most in-lake SO
4
2-
was derived, in contrast, from depo-
sition to watershed soils, this in-lake SO
4
2-
would be expected to decrease
lake-water ANC by a substantially smaller amount because base cations
mobilized from watershed soils would have neutralized much of the SO
4
2-
acidity before the SO
4
2-
reached the lakes.
Analyses of available data for the Adirondack Mountain region suggest
that increases in the concentration of NO
3
-
in surface waters may be a signif-
icant contributor to recent acidification and consequent biological effects in
Adirondack lakes. Although much of the evidence for a significant contribu-
tion of N leaching to chronic acidification of Adirondack lakes is circumstan-
tial, the weight of evidence suggests that N plays an important role. Lake-
water NO
3
-
is commonly in the range of 5 to 25 µeq/L on a chronic basis in
portions of the Adirondack Park that have experienced significant chronic
lake-water acidification. Elsewhere in the park, NO
3
-
concentrations in sum-
mer and fall are generally near zero. The levels of NO
3
-
in the southwestern
Adirondacks and the High Peaks region correspond both in space and in
magnitude to inferred historical acidification (Sullivan et al., 1997). Evalua-
tion of episodic chemistry and associated biological effects indicates that the
relative importance of NO
3
-
as an agent of acidification increases dramatically
during periods of high flow when surface waters are most toxic to fish (Wig-
ington et al., 1993).
Such analyses do not negate the importance of SO
4
2-
as an agent of surface
water acidification in Adirondack waters. However, the role of N has not been
adequately addressed in key policy-relevant modeling efforts (van Sickle and
Church, 1995). Nitrogen may well be associated with chronic, as well as epi-
sodic, acidification of acid-sensitive Adirondack lakes. Past model projections
of chronic surface water chemistry that did not incorporate potential future
changes in lake-water NO
3
-
concentrations may, therefore, be in error. Future
research and modeling efforts should focus on improving predictive ability
regarding both S- and N-driven acidification chronically and during periods
when surface water chemistry is most toxic to aquatic biota.
10.6 Role of Landscape and Disturbance in Acidification
Processes
The relationships between landscape characteristics and lake-water acid-
base chemistry have been investigated through efforts to classify Adirondack
1416/frame/ch10 Page 252 Wednesday, February 9, 2000 2:23 PM
© 2000 by CRC Press LLC
Case Study: Adirondack Park, NY 253
lakes and their watersheds into discrete classes that reflect the dominant
hydrogeochemical processes that control the susceptibility of drainage
waters to acidification. Newton and Driscoll (1990) developed a watershed
classification for Adirondack lakes that was based on flowpath theory, field
reconnaissance, and the concentration of selected lake-water chemical
parameters (Ca
2+
, DOC, Cl
-
). The resulting classification scheme included
two hydrologic categories of seepage lakes (flow-through and recharge), and
three major categories of drainage lakes that are determined on the basis of
Ca
2+
concentration, but presumed to reflect the presence of thin, intermedi-
ate, and thick glacial till in the watershed. The class of thick till drainage lakes
(Ca
2+
greater than 150 µeq/L) is further subdivided into watersheds that are
and are not presumed to contain appreciable amounts of calcium carbonate,
based on whether the Ca/Si ratio exceeds 2. Most of the Newton and Driscoll
(1990) lake classes are divided into two final categories: high or low DOC,
using a cutoff criterion of 5 mg/L (417 µM) of DOC.
Momen and Zehr (1998) used canonical discriminate analysis in an effort
to improve the Newton and Driscoll (1990) classification system by identify-
ing lake-water chemistry and terrestrial variables that could jointly differen-
tiate among Adirondack lakes. Their approach is less reliant on lake-water
Ca
2+
concentration for geologic classification. This is a limitation of the New-
ton and Driscoll (1990) method because Ca
2+
concentration in lakes is con-
trolled by other factors besides watershed hydrogeology, including
deposition chemistry, disturbance, and depletion of soil exchangeable Ca
2+
.
The discriminate functions of Momen and Zehr (1998) are also more useful in
statistical analyses than are categorical variables (c.f., Freeman, 1987).
Interactions between acidic deposition and landscape/physical watershed
characteristics were recently evaluated by Sullivan et al. (1999) for a group of
50 Adirondack lakes. Landscape characteristics were compiled and exam-
ined relative to paleolimnological inferences of historical acidification.
Results of model estimates of acidification using the MAGIC model and pale-
olimnological analyses were compared to physical, biological, and landscape
change data to evaluate if inclusion of additional processes could improve
model estimates.
The goal of the study was to examine the interactions between acidic
deposition and landscape change for a group of Adirondack lakes that have
reasonably well-known acidification histories. Two types of landscape
characteristics can impact lake acidification. The first type is a function of
physical and biological attributes, such as elevation, rates of atmospheric
deposition, hydraulic residence time, and vegetation. The second type is a
function of landscape change processes, such as logging, fire, blowdown,
and watershed disturbances. Diatom and chrysophyte-inferred historical
changes in lake-water pH and the current acid–base status of Adirondack
lakes were examined with respect to known or suspected forest distur-
bances owing to logging, fire, and blowdown, the presence of roads and
lakeshore cabins, and other landscape attributes. Features of landscape
characterization and landscape change were evaluated relative to
1416/frame/ch10 Page 253 Wednesday, February 9, 2000 2:23 PM
© 2000 by CRC Press LLC
254 Aquatic Effects of Acidic Deposition
paleolimnological inferences of historical acidification and model esti-
mates of acidification using the MAGIC model. The objectives of this study
were to determine if there were statistical relationships between landscape
characteristics/processes and lake-water acidification, assess the extent to
which such relationships may reflect causality, and, finally, to determine
whether it would be worthwhile to add a component to the MAGIC model
to model these relationships.
Sullivan et al. (1999) found that diatom-inferred acidification (pH inference
from core bottom minus pH inference from core top) was positively corre-
lated with average long-term annual precipitation and NO
3
-
and SO
4
2-
depo-
sition (p ≤ 0.001). Acidification was also positively, but weakly (p ≤ 0.05),
correlated with lake elevation and the relative presence of red spruce/yellow
birch forests in the watershed (only 34 watersheds had vegetation data).
Acidification was negatively correlated with the percent wetlands along
lakeshore and inlet stream riparian areas (p ≤ 0.001). Weak negative correla-
tions were found (p ≤ 0.05) between inferred acidification and average water-
shed slope, hydraulic residence time, and the relative presence of
hemlock/yellow birch forests.
Acidification was positively correlated with forest blowdown during the
1950 storm, and negatively correlated with the extent of fire impact
(p ≤ 0.001). A weak negative correlation (p ≤ 0.05) was found between
inferred acidification and watershed disturbance. Of the 21 lakes in the data
set that showed acidification of more than 0.25 pH units, only 3 had lakeshore
cabins present and were ranked relatively high in the disturbance impact
ranking. Only two have been logged in recent years (logging category 5), and
only four have been logged since 1950. In contrast, all 4 lakes that showed his-
torical increases in pH (alkalinization) of more than 0.25 pH units had cabins
present on their lakeshores and were ranked among the 10 highest in distur-
bance impact. In addition, all have been logged, and three have been logged
since 1950.
Diatom-inferred acidification was also highly correlated (p ≤ 0.001) with
three measurements of surface water chemistry: fall pH, fall NO
3
-
concentra-
tion, and spring NO
3
-
concentration. Thus, lakes that have acidified tend to be
those currently low in pH (e.g., Sullivan et al., 1990a) and that have relatively
high concentrations of NO
3
-
(e.g., Sullivan et al., 1997). As discussed previ-
ously, the relative importance of NO
3
-
(vs. SO
4
2-
) as an agent of acidification in
these lakes is uncertain, but is clearly greater than was surmised in 1990.
Results of bivariate and multivariate analyses confirmed that lakes that
have experienced historical acidification tend to be those that receive rela-
tively high amounts of precipitation and have short hydraulic residence
times. These variables explained 58% of the diatom-inferred acidification. A
combined model of long-term precipitation, hydraulic residence time, and
blowdown explained 71% of the historic acidification in the Adirondacks
(Sullivan et al., 1999). Lakes that have increased in pH since pre-industrial
times tend to be those subject to substantial human disturbance and those
that burned during major fires recorded after the turn of the century.
1416/frame/ch10 Page 254 Wednesday, February 9, 2000 2:23 PM
© 2000 by CRC Press LLC
Case Study: Adirondack Park, NY 255
The multivariate regression model indicated that the more acidified
lakes had higher precipitation, higher blowdown in their watersheds dur-
ing the 1950 storm, and shorter hydraulic residence times than the less
acidified lakes. Interpretation of the importance of these predictor vari-
ables is somewhat subjective, however. Higher precipitation contributes to
both higher total deposition of N and S and also greater long-term deple-
tion of base cation reserves from watershed soils owing to enhanced leach-
ing. The significance of blowdown from the 1950 storm may reflect either
location of watersheds along exposed ridges, with associated thinner soils
and greater sensitivity to both blowdown and acid deposition impacts, or
acidification associated with forest regrowth subsequent to the blowdown
(as suggested by Dobson et al., 1990). The hydraulic residence time of lakes
in the Adirondacks is influenced by water flow paths and the depth of till
(Driscoll et al., 1991; Newton et al., 1987). Watersheds having thin glacial
soils are expected to be hydrologically flashy and exhibit proportionally
lower base flow (see Driscoll et al., 1991; Figure 6.30), whereas thick glacial
soils provide larger groundwater contributions to hydrologic discharge
that are higher in ANC.
Sullivan et al. (1999) also examined the relationship between the magni-
tude of the discrepancy between MAGIC model and diatom-inferred hind-
casts of pre-industrial pH and the suite of watershed variables under study.
This was done to ascertain whether the disagreement between these
approaches was partly a function of one or more characteristics of the water-
sheds. If this turned out to be the case, then it could be inferred that certain
aspects of the MAGIC model or diatom inferences might be further
improved, thereby, perhaps increasing the accuracy of the model projections.
The difference between diatom-inferred acidification and MAGIC-simulated
acidification was not significantly correlated with any of the landscape
change variables. This MAGIC-diatom offset was, however, highly corre-
lated with the percent wetlands in the riparian zone (p ≤ 0.001), moderately
correlated with lake-water DOC (p ≤ 0.01), and weakly correlated with the
occurrence of one soil type (skerry fine sandy loam) and one vegetation type
(hemlock-yellow birch) (p ≤ 0.05). None of the other watershed characteristics
or land use history data showed indication of biasing the extent of agreement
between the diatom-inferences and model hindcasts. This result suggests
that additional modifications to the MAGIC model (cf. Sullivan et al.,
1996a,b, 1998; Sullivan and Cosby, 1995) to further take into account land-
scape change data are not likely to appreciably improve model performance
with respect to S-driven acidification. However, the negative correlation
between the MAGIC-diatom offset and the two indicators of organic acid
influence (percent wetlands in riparian zone and lake-water DOC) suggest
that additional work on the role of wetland vegetation and associated organic
acidity in modifying the acidification response (e.g., Hemond, 1994; Sullivan
et al., 1996b) may be warranted.
These results differed from results of model simulations for afforested Brit-
ish moorland sites. The latter have suggested that the presence and growth
1416/frame/ch10 Page 255 Wednesday, February 9, 2000 2:23 PM
© 2000 by CRC Press LLC
256 Aquatic Effects of Acidic Deposition
of forests promotes surface water acidification via increased dry and occult
deposition of S, increased evapotranspiration, and increased uptake of base
cations by growing trees (Neal et al., 1986; Jenkins et al., 1990; Cosby et al.,
1990). Model output at the afforested Loch Chon site in Scotland suggested
that the most severe acidification resulted from a combination of forest
growth and acidic deposition. The forest growth component was owing to
the simulated decrease in soil base saturation caused by the uptake of base
cations by trees. This decreased soil base saturation increased the modeled
sensitivity of the soils and drainage waters to the effects of acidic deposition
(Jenkins et al., 1990).
10.7 Overall Assessment
The weight of evidence suggests that lakes and watersheds in the Adiron-
dack Mountains have been adversely impacted by atmospheric deposition
of both S and N. This evidence has been widely discussed in the scientific
literature (e.g., Driscoll and Newton, 1985; Sullivan et al., 1990a, 1997; Baker
et al., 1991; Driscoll et al., 1991; Driscoll and van Dreason, 1993). More
recent evidence also suggests that lake-water acidification in the Adiron-
dacks has been broadly correlated with widespread changes in landscape
cover that occurred in response to massive logging operations and fires
around the turn of the twentieth century and unprecedented forest blow-
down during a large windstorm in 1950. Although such changes in land-
scape cover, particularly forest regrowth, are unlikely on their own to cause
lakes to become acidic (ANC less than or equal to zero), they can cause
decreases in the base saturation of soils, thereby predisposing sensitive
watersheds to subsequent acidification from acidic deposition (Cosby et al.,
1990). The potential importance of these landscape changes has not been
widely recognized in developing and applying models of surface water
acidification and recovery.
Overall, the available evidence suggests that surface water acid–base
status in the Adirondack Mountains is influenced by a variety of water-
shed characteristics, including type and age of vegetative cover. Also, it
appears that changes in these watershed characteristics interact with S and
N deposition to determine the extent of lake-water acidification or alkal-
ization that occurs. Although it may not be possible to capture all of these
dynamics in a process-based modeling approach, lake-water acidification
is best understood when placed in the context of historical land use and
landscape change.
Results of analyses of diatom-inferred historic change in pH of Adirondack
lakes suggest that historical lake-water acidification and alkalinization have
been functions of precipitation, S and N deposition, disturbance history, and
watershed morphology. Lakes that have acidified have generally been those
1416/frame/ch10 Page 256 Wednesday, February 9, 2000 2:23 PM
© 2000 by CRC Press LLC
Case Study: Adirondack Park, NY 257
that receive high levels of precipitation and atmospheric deposition of S and
N, have short hydraulic residence times, and many appear to have experi-
enced forest blowdown in the large 1950 windstorm. Such lakes are relatively
undisturbed by human activities and fire. Lakes that have increased in pH
since pre-industrial times tend to be those that have lakeshore cabins and
have experienced watershed disturbance.
1416/frame/ch10 Page 257 Wednesday, February 9, 2000 2:23 PM
© 2000 by CRC Press LLC