AQUATIC EFFECTS OF ACIDIC DEPOSITION - CHAPTER 11 pot
Bạn đang xem bản rút gọn của tài liệu. Xem và tải ngay bản đầy đủ của tài liệu tại đây (1.62 MB, 42 trang )
259
11
Case Study: Class I Areas in the
Mountainous West
11.1 Background
Atmospheric emissions of S and N outside national park and wilderness area
boundaries in the western U.S. threaten the ecological integrity of highly sen-
sitive ecosystems. Aquatic and terrestrial resources, particularly those at high
elevation, can be degraded by existing or future pollution. Based largely on
the results of EPA’s Western Lakes Survey (Landers et al., 1987), NAPAP
(1991) concluded that many high-elevation western lakes were extremely
sensitive to acidic deposition effects. The absence of evidence of chronic acid-
ification was attributed to the low levels of acidic deposition received by
western watersheds. It was speculated that if deposition increased substan-
tially in the future, substantial acidification would likely occur.
Previous research has focused the greatest attention on aquatic receptors in
the Sierra Nevada and portions of the Cascade and Rocky Mountains (c.f.,
Charles, 1991). The National Park Service (NPS) initiated a series of projects
to assess air quality issues within these regions. The NPS Air Resources Divi-
sion commissioned several Air Quality Regional Reviews to summarize what
is already known about these systems, including the Pacific Northwest
region (Eilers et al., 1994a), the Rocky Mountain region (Peterson and Sulli-
van, 1998), and the California region (Sullivan et al., ongoing). Analyses of
documented and potential ecological effects of atmospheric pollutants have
been conducted, and inventories of pollution-sensitive components of eco-
system receptors in the parks have been compiled. Although generally low
levels of atmospheric pollutants are measured in these mountain ranges
(Sisterson et al., 1990), increasing development adjacent to protected areas
has contributed to increasing air pollution. In particular, elevated emission
levels of both S and N are evident adjacent to Rocky Mountain National Park
and other portions of the Colorado Front Range.
The purpose of this chapter is to provide an overview of recent research
results in a selected portion of the Sierra Nevada and in several national
1416/frame/ch11 Page 259 Wednesday, February 9, 2000 2:27 PM
© 2000 by CRC Press LLC
260
Aquatic Effects of Acidic Deposition
parks located in the Rocky Mountains. The aim is not to provide regional
assessments for these areas, but rather to highlight the types of research that
have been conducted and discuss the research results within the context of
watershed processes that control ecosystem responses to acid deposition and
critical loads. Research conducted in the Cascade Mountains is not presented
here; the reader is referred to Eilers et al. (1994) for the most recent summary
assessment treatment for that region.
The Clean Air Act (42 U.S.C. 7470), as amended in August 1977, provides
one of the most important mandates for protecting air resources in Class I
areas, that is national parks over 6000 acres and national wilderness areas
over 5000 acres that were in existence before August 1977. In Section 160 of
the Act, Congress stated that one of the purposes of the Act was to “preserve,
protect, and enhance the air quality in national parks, national wilderness
areas, national monuments, national seashores, and other areas of special
national or regional natural, recreational, scenic, or historic value.” Accord-
ing to the Clean Air Act and subsequent amendments (Public Laws 95-95,
101-549), Federal land managers (FLMs) have “. . . an affirmative responsibil-
ity to protect the air quality related values (AQRVs) . . . within a Class I area.”
To maintain healthy ecosystems, it is increasingly imperative that land
managers be prepared to monitor and assess levels of atmospheric pollutants
and ecological effects in national parks and wilderness areas throughout the
West. Knowledge of emissions inventories, coupled with scientific under-
standing of dose–response functions and critical loads assessments, will pro-
vide land managers with a framework with which to protect sensitive
resources within the Class I areas from degradation owing to atmospheric
deposition of pollutants.
Air quality within Class I lands is subject to the “prevention of significant
deterioration (PSD)” provisions of the Clean Air Act. The primary objective
of the PSD provisions is to prevent substantial degradation of air quality and
yet maintain a margin for industrial growth. An application for a PSD permit
from the appropriate air regulatory agency is required before construction of
a new, or modification of an existing, major air pollution source (Bunyak,
1993). The role of the FLM is to determine if there is potential for additional
air pollution to cause damage to a sensitive receptor. The FLM can recom-
mend denial of a permit by demonstrating that there will be adverse impacts
in the Class I area or recommend provisions for mitigation.
The following types of questions must be answered in response to PSD per-
mit applications:
• What are the identified sensitive receptors within AQRVs in each
Class I area that could be affected by the new source?
• What are the critical doses for the identified sensitive receptors?
• Will the proposed facility result in pollutant concentrations or
atmospheric deposition that will cause the identified critical dose
to be exceeded?
1416/frame/ch11 Page 260 Wednesday, February 9, 2000 2:27 PM
© 2000 by CRC Press LLC
Case Study: Class I Areas in the Mountainous West
261
As discussed in previous chapters, atmospheric deposition of S and/or N
has the potential to damage sensitive terrestrial, and especially aquatic, eco-
systems by depleting the ANC of soil and surface waters, reducing the pH,
and increasing the concentration of inorganic Al in solution. Such changes in
water chemistry can affect the survival of in-lake and in-stream biota. A need,
therefore, has arisen to assess the levels of atmospheric deposition at which
such changes occur in the Class I areas so as to ensure the protection of sen-
sitive resources.
The NAPAP SOS/T Reports and Integrated Assessment (NAPAP, 1991)
provided only a cursory treatment of aquatic effects issues in the West,
largely because it was well known that atmospheric deposition of S and N
were generally low compared to highly impacted areas in the East and
because results from the Western Lakes Survey (Landers et al., 1987) indi-
cated that there were virtually no acidic (ANC less than or equal to zero)
lakes in the West. NAPAP (1991) recognized, however, that high-elevation
areas of the West contained some of the most sensitive watersheds in the
world to the potential effects of acidic deposition.
It is important to determine critical loads of S and N deposition to sensitive,
high-elevation watersheds in the West. It is also important to make these
determinations in a timely fashion for the following reasons
1. Nitrogen deposition has been increasing at many western locations,
including the Front Range of Colorado, during recent years.
2. FLMs are faced with an ongoing, and in some locations accelerat-
ing, need to provide recommendations for approval or denial of
permits for increased point source emissions of S and/or N upwind
of sensitive national parks and wilderness area receptors.
3. Mounting evidence suggests that adverse impacts to aquatic
resources may be occurring in some areas under current deposi-
tion levels.
Because of the proximity of well-defined population centers and indus-
trial pollution sources in the West to individual mountain ranges, it is often
important to evaluate changes in emissions in the immediate vicinity of
sensitive resources as well as to assess regional emissions (Sullivan and Eil-
ers, 1994). For example, emissions in the Rocky Mountain states have no
effect on resources in the Sierra Nevada, in part because emissions from
these states are generally low and in part because the prevailing wind direc-
tion is from west to east. Precipitation chemistry in the far western ranges
is largely influenced by local emissions, particularly emission sources to the
west (upwind) of sensitive resources. In the Rocky Mountains, deposition
chemistry is influenced by a more complex collection of sources, although
recent evidence suggests that local sources, that is, those sources within
approximately 100 km of a given mountain range, can be as important as
long-range sources. In the Mt. Zirkel Wilderness of northwestern Colorado,
1416/frame/ch11 Page 261 Wednesday, February 9, 2000 2:27 PM
© 2000 by CRC Press LLC
262
Aquatic Effects of Acidic Deposition
elevated concentrations of SO
4
2-
and NO
3
-
in the snow appear to originate
largely from sources in the Yampa Valley, about 75 km to the west (Turk et
al., 1992). Rocky Mountain National Park may be largely influenced by
emissions from the Front Range to the southeast.
Despite the uncertainties associated with existing deposition data, it is
clear that atmospheric deposition of both S and N is currently low through-
out most portions of the West (NAPAP, 1998). Annual wet deposition levels
of S and N are generally less than about one-fourth of the levels observed in
the high-deposition portions of the northeastern U.S. (Sisterson et al., 1990).
Spring snowmelt can act to flush N into lakes and streams that was depos-
ited in the snowpack from atmospheric deposition or N mineralized within
the soil during the winter. In some alpine and subalpine western lakes, the
concentration of NO
3
-
remains somewhat elevated throughout the growing
season. This may be related to the extent of snow cover and effects of the cold
temperatures on biological uptake processes, hydrological flowpaths across
exposed bedrock and talus, and/or saturation of the uptake capacity of ter-
restrial and aquatic biota.
A substantial component of the NO
3
-
in western lake waters may have been
derived from mineralization of organic N and not directly from atmospheric
deposition. Much of the N released from the snowpack during the melting
period is retained in underlying soils. Williams et al. (1996b) contended that
measurements of subnivial (under the snowpack) microbial biomass, CO
2
flux through the snowpack, and soil N pools all suggested that subnivial N
cycling during the winter and spring is sufficient to supply the NO
3
-
mea-
sured in stream waters.
It is likely that microbial activity under the snowpack plays an important
role in both the production of inorganic N before the snowmelt begins and
the immobilization of N during the initial phases of snowmelt before vegeta-
tion becomes active. For example, Brooks et al. (1996) followed soil N dynam-
ics throughout the snow-covered season on Niwot Ridge, CO. Sites with
consistent snow cover were characterized by a 3 to 8 cm layer of thawed soil
that was present for several months before snowmelt began. Nitrogen miner-
alization in this thawed layer resulted in soil inorganic N pools that were sig-
nificantly larger than the pool of N stored in the snowpack. As snowmelt
began, soil inorganic N pools decreased sharply, concurrent with a large
increase in microbial biomass N. As snowmelt continued, both microbial N
and soil inorganic N decreased, presumably owing to increased demand by
growing vegetation (Brooks et al., 1996). The recognized importance of min-
eralization, the production of inorganic N from the breakdown of organic
material, and subsequent conversion to NO
3
-
(nitrification) as a source of
stream-water NO
3
-
does not imply, however, that atmospheric N deposition
is not driving this flux. It is likely that mineralization and nitrification pro-
cesses release N to surface waters that was derived largely from deposition
and cycled through the primary production of the previous growing season.
The sensitivity to acidification of surface waters in western regions is a
function of regional deposition characteristics, surface water chemistry, and
1416/frame/ch11 Page 262 Wednesday, February 9, 2000 2:27 PM
© 2000 by CRC Press LLC
Case Study: Class I Areas in the Mountainous West
263
watershed factors (c.f., Charles, 1991). Sullivan and Eilers (1994) attempted to
integrate these three elements to provide a qualitative assessment of water-
shed sensitivity to acidification and a quantitative assessment of the magni-
tude of acidification currently experienced within the western subregions.
These results were then combined to provide an assessment of the likely
dose–response relationships for the subregions of interest. See Chapter 5 for
further discussion of this topic.
Topographic relief is also a contributing factor to acidic deposition sensitiv-
ity in the West because the mountainous terrain contributes to major snow-
melt events that may cause episodic pH and ANC depressions. These
snowmelt events can last up to 2 months and result in multiple exchanges of
the water volume in lakes receiving significant runoff. The short residence
time of many high-elevation lakes not only contributes to elevated sensitivity
to snowmelt events, but also reduces the relative importance of in-lake alka-
linity generation processes.
Episodic acidification is an important issue for surface waters throughout
high-elevation areas of the West. A number of factors predispose western sys-
tems to potential episodic effects (Peterson and Sullivan, 1998), including
1. The abundance of dilute to ultradilute lakes (i.e., those having
extremely low concentrations of dissolved solutes), exhibiting very
low concentrations of base cations, and, therefore, ANC throughout
the year.
2. Large snowpack accumulations at the high elevation sites, thus
causing substantial episodic acidification via the natural process of
base cation dilution.
3. Short retention times for many of the high-elevation drainage lakes,
thus enabling snowmelt to rapidly flush lake basins with highly
dilute meltwater.
Thus, the physical characteristics (e.g., bedrock geology, lake morphometry)
and climate throughout high elevation areas of the West provide justification
for considering potential episodic acidification to be an important concern. In
addition, the few studies that have been conducted to date confirm the gen-
eral sensitivity of western lakes to episodic processes.
In most cases, episodic pH and ANC depressions during snowmelt are
driven by natural processes (mainly base cation dilution) and nitrate
enrichment (cf. Wigington et al., 1990, 1993; Stoddard, 1995). Where pulses
of increased SO
4
2-
are found during hydrological episodes, they are usually
attributable to S storage and release in streamside wetlands. More often,
lake and stream-water concentrations of SO
4
2-
decrease or remain stable
during snowmelt. This is probably attributable to the observation, based on
ratios of naturally occurring isotopes, that most stream flow during epi-
sodes is derived from pre-event water. Water stored in watershed soils is
forced into streams and lakes by infiltration of meltwater via the “piston
1416/frame/ch11 Page 263 Wednesday, February 9, 2000 2:27 PM
© 2000 by CRC Press LLC
264
Aquatic Effects of Acidic Deposition
effect.” This is not necessarily the case for high-elevation watersheds in the
West, however. Such watersheds often have large snowpack accumulations
and relatively little soil cover. Selective elution of ions in snowpack, there-
fore, can result in relatively large pulses of both NO
3
-
and SO
4
2-
in drainage
water early in the snowmelt.
Data supporting the importance of SO
4
2-
to spring episodes in the West
were presented by Reuss et al. (1995). It appears likely that S deposition will
contribute to episodic acidification of sensitive western surface waters at
deposition levels below those that would cause chronic acidification (Sulli-
van and Eilers, 1994). Episodes have been so little studied within the region,
however, that it is not possible to provide quantitative estimates of episodic
S standards for the western subregions of concern.
The N loading to alpine and subalpine systems may be functionally much
higher than is reflected by the total annual deposition measured or esti-
mated for the watersheds. It may, therefore, be misleading to compare total
N loading estimates of 3 to 7 kg N/ha per year, for example, of some alpine
systems in the Front Range with the higher loading rates found in parts of
the eastern U.S. and northern Europe. There are several reasons for this.
First, the actual N loading to both soils and drainage waters at high-eleva-
tion sites during summer is comprised of both the ambient summertime
atmospheric loading and also the loading of the previous winter that was
stored in the snowpack and released to the terrestrial and aquatic systems
during the melt period, often largely occurring during May through July.
For this reason, the N loading from atmospheric deposition during the
summer can actually be substantially higher than the annual average atmo-
spheric loading. Second, soil waters are often completely flushed during
the early phases of snowmelt in alpine areas. Such flushing can transport to
surface waters a significant fraction of the N produced in soils during win-
ter by subnivian mineralization of the primary production of the previous
summer. This N load from internal ecosystem cycling will generally be
larger in areas that receive significant N deposition because the gross pri-
mary production of alpine ecosystem often tends to be N limited (Bowman
et al., 1993). Thus, the functional N loading to terrestrial and aquatic runoff
receptors in alpine and subalpine areas during the summer growing season
is much higher than the annual average N loading for the site. This is espe-
cially true during the early phases of snowmelt, when soil waters are
flushed from shallow soils and talus areas and when a large percentage of
the ionic load of the snowpack is released in meltwater.
The Sierra Nevada and Rocky Mountains contain an abundance of Class
I areas, the majority of which are wilderness areas administered by the US
Forest Service. Fairly extensive surface water chemistry data are available
for some of the Class I national parks in the Rocky Mountains and Sierra
Nevada. Some of these data were synthesized by Melack and Stoddard
(1991), Turk and Spahr (1991), Peterson and Sullivan (1998), and Melack et
al. (1998). These data, together with additional ancillary or more recent
data, are summarized in the sections that follow. Although much of the
1416/frame/ch11 Page 264 Wednesday, February 9, 2000 2:27 PM
© 2000 by CRC Press LLC
Case Study: Class I Areas in the Mountainous West
265
information presented here is specific to a small number of national parks,
the resources in these parks are likely representative of those in surround-
ing terrain in most cases.
11.2 Sierra Nevada
11.2.1 Atmospheric Deposition
The Emerald Lake Basin of Sequoia National Park in the southern Sierra
Nevada has been the focus of considerable research on the effects of N and S
deposition on soils, forests, and surface waters. An NADP monitoring site is
located at Giant Forest in Sequoia National Park at an elevation of 1902 m.
Total annual precipitation at this site ranges from about 50 to 200 cm per year.
Concentrations of NH
4
+
, NO
3
-
, and SO
4
2-
in precipitation have not shown a
trend of increase or decrease since the early 1980s. Total wet N deposition has
ranged from about 1 to 4 kg/ha per year, whereas wet S deposition has
ranged from less than 1 to about 2 kg/ha per year. Deposition of N and S
appears to vary from year to year primarily as a function of the total quantity
of precipitation. The source of these pollutants is thought to be the Central
Valley, with some influence from the San Francisco Bay area (Bytnerowicz
and Fenn, 1996).
Wet deposition was monitored near treeline (elevation 2800 m) at the Emer-
ald Lake watershed during the water years 1985 through 1987 by Williams
and Melack (1991b). Precipitation amounts ranged from one of the wettest
years on record (1986) to one of the driest (1987). Volume-weighted pH was
4.9 for rainfall and 5.3 for snowfall. Volume-weighted mean annual concen-
trations of SO
4
2-
, NO
3
-
, and NH
4
+
throughout the study were all about 4 to 5
µ
eq/L. Average total wet deposition of N and S were 2.3 and 2.1 kg/ha per
year, respectively. Low Cl
-
and high NH
4
+
concentrations in rain, compared
with snow, suggest that localized convective systems (as opposed to oceanic
frontal systems during the winter) are the main sources of ions in rainfall.
Afternoon upslope air flow, induced by heating of air along the mountain
slopes, transports air masses from the San Joaquin Valley to the upper
reaches of Sequoia National Park on a daily basis during summer (Williams
and Melack, 1991b).
Extensive monitoring of wet deposition to high elevations of the Sierra
Nevada was initiated in 1990 at nine sites (Melack et al., 1997). The upper
Marble Fork of the Kaweah River, which drains Sequoia National Park, was
added to the monitoring program in 1992. Snow chemistry summarized by
Melack et al. (1998) for eight of the (mainly alpine and subalpine) Sierra
Nevada watersheds was dilute and similar among the watersheds. Mean
concentrations of NO
3
-
and NH
4
+
in snow were 2.4 and 2.7
µ
eq/L,
1416/frame/ch11 Page 265 Wednesday, February 9, 2000 2:27 PM
© 2000 by CRC Press LLC
266
Aquatic Effects of Acidic Deposition
respectively. Mean SO
4
2-
concentration was 2.0
µ
eq/L (range about 1.0 to 3.0
µ
eq/L). However, NO
3
-
and NH
4
+
concentrations in nonwinter precipitation
were 8 to 9 times greater than in the snowpack (mean values, 20.7 and 23.4
µ
eq/L, respectively). The SO
4
2-
concentration in nonwinter precipitation was
also high, with a mean of 15.1
µ
eq/L. In contrast, the mean Cl
-
level measured
in nonwinter precipitation (4.2
µ
eq/L) was only slightly higher than the
mean Cl
-
concentration in winter snowfall.
Mean annual NH
4
+
deposition was 0.70 kg/ha NH
4
+
-N and mean annual
NO
3
-
was 0.63 kg/ha NO
3
-
-N for the 36 water years of record. For both ions,
the maximum loading rates were measured at Emerald Lake during water
year 1987 (3.6 kg N/ha).
Concentrations of N measured in winter snow in the Emerald Lake water-
shed were among the most dilute measurements of N recorded in wet precip-
itation (Williams et al., 1995). Nitrogen concentrations in winter snow of
about 2
µ
eq/L each for NH
4
+
and NO
3
-
were comparable to measurements
from central Alaska (Galloway et al., 1982). However, mean concentrations of
N in rainwater of about 55
µ
eq/L for NH
4
+
and 42
µ
eq/L for NO
3
-
were com-
parable to N concentrations in rainfall in areas having considerable anthro-
pogenic sources of N, such as the Adirondack and Catskill Mountains of New
York (Stoddard, 1994).
Brown and Lund (1994) studied the influence of dry deposition and foliar
interactions on the chemical composition of throughfall in the Emerald Lake
watershed. Summer dry deposition was a substantial component of total
annual deposition and was generally in excess of summer wet deposition.
11.2.2 Surface Water Chemistry
High-elevation lakes and streams in the Sierra Nevada are among the most
dilute, poorly-buffered waters in the U.S. (Landers et al., 1987; Melack and
Stoddard, 1991). The catchments that supply runoff to these waters are under-
lain primarily by granitic bedrock and have poorly-developed soils and sparse
vegetation. The hydrologic cycle is dominated by the annual accumulation and
melting of a dilute, mildly acidic (pH 5.5) snowpack (Melack et al., 1997).
During the 1980s, an Integrated Watershed Study (IWS) was conducted at
the Emerald Lake watershed (2800 to 3400 m elevation), the purpose of which
was to investigate the possibility of acid-induced damage to the watershed
and to determine the consequences of acidification on Sierran surface waters
(Tonnessen, 1991). The IWS included studies of deposition, terrestrial sys-
tems, and aquatic systems. Focus shifted in the late 1980s to a larger group of
watersheds. Research on the catchments of Pear, Topaz, Crystal, and Ruby
Lakes was initiated in 1986 (Sickman and Melack, 1989). Spuller and Lost
Lakes were added to the monitoring program in 1990 (Melack et al., 1993).
Results of these monitoring studies were summarized by Melack et al. (1998).
The eight water quality monitoring sites are located in alpine and subal-
pine settings across a majority of the north–south extent of the Sierra Nevada.
1416/frame/ch11 Page 266 Wednesday, February 9, 2000 2:27 PM
© 2000 by CRC Press LLC
Case Study: Class I Areas in the Mountainous West
267
There are four located on the western slope, all within Sequoia National Park
(Emerald, Pear, and Topaz Lakes, and Marble Fork of the Kaweah River). The
other four are located to the north, and along the eastern slope of the Sierra
Nevada range.
The volume-weighted mean pH for lake outlet streamflow during the 36
water years of record examined by Melack et al. (1998) for 7 lakes in the Sierra
Nevada was 6.05, and ranged from 5.6 to 6.7. Lost Lake had the lowest pH;
Ruby and Spuller Lakes had the highest. Lost, Pear, and Emerald Lakes had
volume-weighted mean ANC in the range of 15 to 30
µ
eq/L and were classified
by Melack et al. (1998) as low in ANC. Moderate ANC waters (Topaz, Spuller,
and Marble Fork) exhibited mean ANC in the range of 30 to 50
µ
eq/L. Crystal
and Ruby Lakes had mean annual ANC greater than 50
µ
eq/L.
Sulfate concentrations were most consistent of the ions measured. With the
exception of Ruby and Spuller Lakes, annual average SO
4
2-
concentration
ranged from 5 to 7
µ
eq/L. Ruby and Spuller Lakes had annual average SO
4
2-
concentration of 8 to 10
µ
eq/L.
11.2.3 Seasonality and Episodic Processes
The hydrologic cycle in the Sierra Nevada is dominated by snowfall and
snowmelt, with over 90% of the annual precipitation falling as snow between
November and April. Through the process of preferential elution (Johannes-
sen and Henriksen, 1978), the relatively small loads of acidic deposition in
Sierran snowpacks can supply high concentrations of SO
4
2-
and NO
3
-
during
snowmelt (Stoddard, 1995). In most cases, lake-water pH decreases with
increasing runoff, reaching a minimum near peak snowmelt discharge. Most
other solutes exhibit temporal patterns identified by Melack et al. (1998)
either as dilution, or a pulse of increased concentration followed by dilution
(pulse/dilution) or biological uptake (pulse/depletion). Nitrate and SO
4
2-
often declined at peak runoff. Nitrate peaks of 5 to 15
µ
eq/L were common,
although they were usually less than 2
µ
eq/L in the N-limited lakes (Crystal
and Lost Lakes). Patterns of change in SO
4
2-
concentration were similar to
NO
3
-
patterns but much smaller in magnitude. Except in watersheds thought
to have bedrock sources of S (Spuller and Ruby Lakes), the differences
between SO
4
2-
maxima and minima were generally within 2
µ
eq/L.
The concentrations of base cations and ANC generally exhibited a dilution
pattern and reached minima near peak runoff. Outflow ANC declined by 24
to 80% during the spring, with an average decline of 50%. Lowest ANC was
generally between about 15
µ
eq/L (Lost and Pear Lakes) and 30
µ
eq/L (Ruby
and Crystal Lakes). Seasonal ANC depressions were greatest during years
with deep snowpacks and high snowmelt runoff.
In some catchments, NO
3
-
concentration declined throughout the snow-
melt period (dilution). A second pattern was observed as a NO
3
-
pulse during
Stage 2 of snowmelt (i.e., 25 to 50% of cumulative runoff). This was seen in
the Ruby and Emerald Lakes watersheds and was described by Melack et al.
1416/frame/ch11 Page 267 Wednesday, February 9, 2000 2:27 PM
© 2000 by CRC Press LLC
268
Aquatic Effects of Acidic Deposition
(1993) as a pulse of NO
3
-
early in the melt followed by depletion caused by
biological uptake (pulse/depletion).
No long-term trends in the pH or ANC of surface water were identified for
the eight waters studied by Melack et al. (1998). This was despite the fact that
one lake (Emerald) had 12 years of monitoring data.
Concentrations of NO
3
-
in the Emerald Lake outlet increased from 2 to 3
µ
eq/L in the fall to 10 to 13
µ
eq/L during spring runoff. The observed
increases in NO
3
-
and SO
4
2-
were attributed to preferential elution from the
snowpack and low retention rates in the watershed. In-lake reduction of NO
3
-
and SO
4
2-
within Emerald Lake was relatively small, and most of the acid
anions passed through the lake outlet. The increase in SO
4
2-
concentrations in
surface water during snowmelt in the Sierra Nevada contrasts with observa-
tions in the Adirondacks where snowmelt runoff diluted SO
4
2-
as well as base
cation concentrations (Schaefer et al., 1990).
Williams and Melack (1991a,b) documented an ionic pulse in meltwater
concentrations in the Emerald Lake watershed 2- to 12-fold greater than the
snowpack average. Sulfate and NO
3
-
concentrations in meltwater decreased
to below the initial bulk concentrations after about 30% of the snowpack had
melted. The ionic pulse was variable spatially dependent on the rate of snow-
melt. At a site with relatively rapid snowmelt, the pulse lasted only 2 days,
whereas at a site with a slow rate of melt, the pulse lasted about 10 days. The
first fraction of meltwater draining from the snowpack had concentrations of
NO
3
-
and NH
4
+
as high as 28
µ
eq/L, compared to bulk snowpack concentra-
tions less than 5
µ
eq/L (Williams et al., 1995). Stream-water NO
3
-
concentra-
tions reached an annual peak during the first part of snowmelt runoff, with
maximum stream-water concentrations of 18
µ
eq/L. During the summer
growing season, stream-water NO
3
-
concentrations were always near or
below detection limits (0.5
µ
eq/L).
Melack et al. (1993) reported 2 years of intensive research at the 7 high-ele-
vation lakes. Solute concentrations, particularly ANC and base cation con-
centrations, were greatest during winter, declined to minima during
snowmelt, and gradually increased during summer and autumn. Sulfate con-
centrations varied most in lakes with lowest volumes. Nitrate concentrations
increased during snowmelt in most lakes owing to inputs of stream water
enriched with NO
3
-
. Zooplankton species known to be intolerant of acidifica-
tion were found in all seven lakes, and Melack et al. (1993) concluded that
their presence is evidence that Sierra Nevada lakes are not currently showing
chronic biological effects of acidic deposition.
Kattelmann and Elder (1991) developed a water balance for 2 years for the
Emerald Lake watershed that provides insight into the hydrology of headwa-
ter catchments in the Sierra Nevada. Snow dominated the water balance and
accounted for 95% of the precipitation. Direct short-term runoff from snow-
melt accounted for more than 80% of the streamflow in both years.
Snowmelt typically dilutes lake outflow solute concentrations in the Sierra
Nevada by 30 to 40%, as measured by decreases in Na
+
, Cl
-
, or silica (Melack
et al., 1998). In contrast, SO
4
2-
concentrations are only reduced by about 10%.
1416/frame/ch11 Page 268 Wednesday, February 9, 2000 2:27 PM
© 2000 by CRC Press LLC
Case Study: Class I Areas in the Mountainous West
269
Relative to dilution, episodic SO
4
2-
concentrations showed an increase of 128
to 150% (Melack et al., 1998). Nitrate is also relatively increased in compari-
son with other ions in a similar fashion.
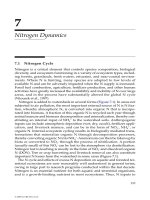
In the Sierra Episodes Study, 10 lakes and their watersheds were selected
for study. Results for two of the lakes were reported by Stoddard (1995), one
of which typified the response of the majority of high elevation lakes in the
study (Treasure Lake) and one whose response was most extreme (High
Lake). At Treasure Lake, ANC began to decline at the onset of snowmelt and
reached a minimum at peak runoff, corresponding with minimum base cat-
ion, NO
3
-
, and SO
4
2-
concentrations (Figure 11.1). At no point did Treasure
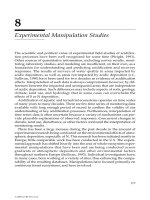
Lake become acidic. High Lake watershed contained a deeper snowpack, and
began melting later in the season. ANC fell to 0 and below twice during the
first 10 days of snowmelt. The ANC minimum corresponded with maximum
concentrations of base cations, NO
3
-
and Al (Figure 11.2). The High Lake
watershed produced snowmelt that is both later and more rapid than other
lakes included in the Sierra Episodes Study, perhaps due to its high elevation
and small watershed area (Stoddard, 1995). This caused increases in NO
3
-
concentration to values greater than 40
µ
eq/L, exceeding concurrent
increases in base cations and causing the lake to become acidic for brief peri-
ods. High Lake appears to be representative of the most extreme conditions
of episodic acid-sensitivity in the Sierra Nevada.
Dilution of base cation concentrations during snowmelt is the primary fac-
tor responsible for seasonal ANC depressions in lakes in the Sierra Nevada.
Melack et al. (1998) classified the lakes into two classes according to snow-
melt response. In shallower lakes having short residence times (i.e., lakes that
are rapidly flushed during snowmelt), NO
3
-
and SO
4
2-
accounted for less than
10% of the ANC decline (Lost, Topaz, Spuller Lakes). In lakes having larger
water volumes or lower snowmelt rates, NO
3
-
and SO
4
2-
accounted for 25 to
35% of the ANC decrease (Emerald, Pear, Ruby, Crystal Lakes). In the latter
group, NO
3
-
and SO
4
2-
contributed about equally during the first half of snow-
melt, but SO
4
2-
was more important during the latter half of snowmelt.
Melack et al. (1998) found that the relationship between minimum ANC
during snowmelt and fall overturn ANC was linear, and the equation
remained unchanged with the addition of data from earlier surveys. Appli-
cation of this equation to the population of lakes in the Sierra Nevada that
were included in the WLS statistical frame suggested that none of the lakes
represented by the WLS are acidified by snowmelt under current levels of
acidic deposition. However, the confidence limit of this empirical relation-
ship allowed the possibility that up to 1.8% of lakes in the Sierra Nevada are
acidified to ANC less than or equal to 0 during snowmelt.
Melack et al. (1998) tabulated premelt and fall index ANC and episodic
ANC values for each of their study watersheds and years using both lake
outflow and in-lake chemistry samples. They found that the in-lake sam-
pling every other month captured the snowmelt ANC depression almost as
well as the more intensive outflow sampling. This was because the interval
of minimum ANC was so extended that, typically, any sample collected
1416/frame/ch11 Page 269 Wednesday, February 9, 2000 2:27 PM
© 2000 by CRC Press LLC
270
Aquatic Effects of Acidic Deposition
from late May to early August captured most of the ANC depression. They
developed an equation for minimum lake-water ANC as a function of fall
overturn ANC, using a simplified version of the two-compartment chemi-
cal mixing model proposed by Eshleman et al. (1995):
minimum ANC = m{index ANC} -
b
(11.1)
FIGURE 11.1
Time series of major ions and discharge in Treasure Lake during snowmelt in 1993. (Source:
Water, Air, Soil Pollut
., Vol. 85, 1995, p. 356, Episodic acidification during snowmelt of high
elevation lakes in the Sierra Nevada Mountains of California, Stoddard, J.L., Figure 1, Copyright
1995. Reprinted with kind permission from Kluwer Academic Publishers.)
1416/frame/ch11 Page 270 Wednesday, February 9, 2000 2:27 PM
© 2000 by CRC Press LLC
Case Study: Class I Areas in the Mountainous West
271
The parameter values of the model were estimated by Melack et al. (1998)
using 7 of the 8 monitoring lake sites,* plus 15 additional lakes in the Sierra
Nevada. The resulting equation (
r
2
= 0.98, se = 8.0
µ
eq/L) was
FIGURE 11.2
Time series of major ions and discharge in High Lake during snowmelt in 1993. (Source:
Water,
Air, Soil Pollut
., Vol. 85, 1995, p. 357, Episodic acidification during snowmelt of high elevation
lakes in the Sierra Nevada Mountains of California, Stoddard, J.L., Figure 2, Copyright 1995.
Reprinted with kind permission from Kluwer Academic Publishers.)
* Data from Spuller Lake were omitted from the analysis. This lake and other similar shallow
lakes with appreciable year-round groundwater inflows have unusually large snowmelt
ANC depressions.
1416/frame/ch11 Page 271 Wednesday, February 9, 2000 2:27 PM
© 2000 by CRC Press LLC
272 Aquatic Effects of Acidic Deposition
minimum ANC = (0.88 ± 0.03) {overturn ANC} - (8.6 ± 2.8) (11.2)
11.2.4 Weathering and Cation Exchange
Williams et al. (1993) utilized hydrologic, mineralogic, and soils data to deter-
mine the sources and geochemical controls on the composition of surface
waters in the Emerald Lake watershed. Preferential weathering of the anor-
thite component of plagioclase accounted for about 60% of the annual export
of Ca
2+
from the watershed in stream water. There was a large excess of Si
after accounting for weathering processes of granitic bedrock, consistent
with the results from other alpine basins underlain by crystalline bedrock
(e.g., Mast et al., 1990). This underscores the lack of adequate understanding
of the sources and sinks of Si in granitic basins.
Temporal variation in the geochemical controls on solute composition of
surface waters were attributed by Williams et al. (1993) to a combination of
changes in hydrologic routing, relative contributions of water from different
hydrologic reservoirs, and residence time within these reservoirs. Stoichio-
metric weathering products of surface waters were not consistent over time
and were divided into three distinct periods
• Snowpack runoff
• Summer transition period
• Low flow period from late summer through winter
About one-half of the snowpack runoff was estimated to become stream-
flow as Hortonian overland flow and the other one-half infiltrated soils and
talus before becoming streamflow. Applied tracers illustrated that hydrologic
residence time in subsurface reservoirs was on the order of hours to days dur-
ing snowpack runoff. Stream water was not in equilibrium with weathering
products during snowmelt.
Discharge from the soil reservoirs appeared to be the primary source of
streamflow during the summer transition period. In contrast, processes
below the soil zone appeared most important during the low-flow period
(Williams et al., 1993).
Based on three independent analyses, Williams et al. (1993) suggested that
cation exchange occurred during snowmelt
1. LiBr tracer experiment.
2. Increased molar ratio of Na : Ca in both soil water and stream
water, consistent with the selectivity coefficients of soil cation
exchangers.
3. Modeled vs. measured HCO
3
-
suggested that during the period of
snowpack runoff more cations were present than would have been
produced by mineral weathering.
1416/frame/ch11 Page 272 Wednesday, February 9, 2000 2:27 PM
© 2000 by CRC Press LLC
Case Study: Class I Areas in the Mountainous West 273
Thus, despite the short residence time of meltwater in the soil compartment
during snowmelt, acid neutralization via cation exchange appears to be
important. Improved understanding of cation exchange processes in both
soil and talus compartments of these watersheds is needed. It will provide
the foundation for further refinement of models to predict the response of
these systems to future changes in acidic deposition.
11.3 Rocky Mountains
The Rocky Mountain states are sparsely populated compared to Eastern
states. Wyoming is the least populated state in the nation, and by the year
2000 the population is expected to reach only 522,000 inhabitants. Montana
has fewer than 1 million people and expects moderate increases in popula-
tion over the next 30 years. There are few large urban areas in Wyoming and
Montana, and none qualify as metropolitan areas (larger than 1 million peo-
ple). Colorado is the most populated of the Rocky Mountain states and con-
tains a metropolitan area (Denver) and several smaller urban areas, Boulder,
Colorado Springs, and Fort Collins. The Front Range area of Colorado is cur-
rently experiencing a growth boom with urban and suburban development
expanding at a rapid pace.
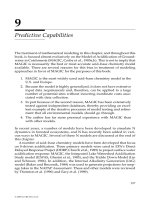
Most of the population growth in the Rocky Mountain region is occurring
near urban centers. Whereas most of the Class I areas are remote from urban
areas (Rocky Mountain National Park is an exception; Figure 11.3), regional
transport of pollutants from urban areas to wildland areas may pose a threat
to the air quality of the Class I areas.
Colorado and Utah have the highest total NO
x
emission levels for the
Rocky Mountain states, mainly from fossil fuel combustion by electric power
utilities and on-road vehicles. Colorado and Wyoming have annual SO
2
emis-
sions exceeding 100,000 tons per year. In these states, electric utilities are the
major sources of SO
2
, followed by industrial fuel combustion (including oil
and gas refining) and mining operations (Peterson and Sullivan, 1998).
The Rocky Mountain region from Colorado to northern Montana encom-
passes a wide variety of landscapes and ecosystems. Geology, soils, aquatic
systems, vegetation, and fauna are highly variable at both large and small
spatial scales owing to the complex mountainous topography of this region.
The Rocky Mountains are rugged glaciated mountains with many peaks up
to 4,500 m in elevation. Mountainous topography is generally highly dis-
sected with intervening valleys and plateaus. Geology is spectacularly varied
with a great diversity of igneous, metamorphic, and sedimentary bedrock of
various ages. Glacial till is found in many locations as a result of various gla-
cial advances during the Pleistocene. The presence of glaciers in many high
mountain valleys and cirques attests to the geomorphically dynamic land-
scapes of the Rockies.
1416/frame/ch11 Page 273 Wednesday, February 9, 2000 2:27 PM
© 2000 by CRC Press LLC
274 Aquatic Effects of Acidic Deposition
Soils in the Rocky Mountains are diverse with respect to topography, par-
ent material, vegetation, climate, and time of formation. Many different soil
orders are found, with inceptisols, entisols, alfisols, spodosols, aridisols, and
mollisols being most common. Because of the influence of gravity on steep
slopes, colluvium is the most common surficial component of soils at most
locations in the mountains. Alluvium is also common in river valleys. It is dif-
ficult to generalize about the nutrient status and biogeochemical cycling
properties of soils in the Rockies. These factors, in conjunction with analyses
of potential impacts of air pollutants, should generally be assessed on a
watershed basis.
The climate of the southern and central Rockies is considered to be a semi-
arid steppe regime in which there is considerable variation in precipitation
FIGURE 11.3
National parks and major cities of the Rocky Mountain and northern Great Plains regions. (Source:
Peterson and Sullivan, 1998.) Map produced by the National Park Service Air Resource Division.
1416/frame/ch11 Page 274 Wednesday, February 9, 2000 2:27 PM
© 2000 by CRC Press LLC
Case Study: Class I Areas in the Mountainous West 275
with altitude. Total precipitation is moderate but greater than in the plains
regions to the west and east. Foothill regions annually receive only 25 to 50
cm of precipitation, whereas higher elevations typically receive over 100 cm.
In the higher mountains, a major portion of annual precipitation is snow. Cli-
mate is strongly affected by prevailing winds, resulting in generally wetter
western slopes and drier eastern slopes. Average annual temperatures range
from 2 to 7˚C, with higher temperatures in lower valleys (Bailey, 1980). The
climate of the northern Rockies is considerably colder. Annual precipitation
ranges from 50 to 100 cm, with much of it falling as snow. Summers generally
are dry because prevailing westerly winds during this season transport rela-
tively dry air masses from the Pacific Northwest (Bailey, 1980).
Fairly extensive data are available regarding the acid-sensitivity of aquatic
resources in four national parks within the region: Glacier, Yellowstone,
Grand Teton, and Rocky Mountain. Of these, aquatic resources are most sen-
sitive in Rocky Mountain and Grand Teton National Parks and both aquatic
and terrestrial resources appear to be at greatest risk of future damage in
Rocky Mountain National Park. Available data and recent findings for these
parks are discussed next. Additional data are also available for the Wind
River Mountains, WY, and Niwot Ridge, CO.
11.3.1 Glacier National Park
Glacier National Park (GLAC) encompasses 410,000 ha in northwestern
Montana. GLAC includes rugged topography, active glaciers, clear streams
and lakes, and spectacular scenic vistas. GLAC has several unique geological
features. The layers of the Precambrian Belt Supergroup are extremely well-
delineated in the portion of the park above treeline, and the layered sedimen-
tary structures are unusually well-preserved on the dry eastern slopes. The
Lewis Overthrust Fault is also highly visible in the park. Found in the higher
elevations are 50 small alpine glaciers of relatively recent post-Pleistocene
age. Current and former glacial activity in GLAC has resulted in many hang-
ing valleys, cirques, and arretes, as well as an extensive hydrological system
of lakes and streams.
The landscape of GLAC was created, in part, by an overthrust fault of
ancient sedimentary substrates. Glaciers and streams have eroded the sedi-
mentary strata in a dendritic pattern, radiating outwards from the central
axis of high ridges and mountain peaks. Glacial moraines are prominent,
especially in the northwestern part of the park (Martinka, 1992).
The park contains three distinct physiographic areas: the valleys of the
North and Middle Forks of the Flathead River in the west, the central high
mountains, and the plains in the eastern portion of the park. The central por-
tion is dominated by two mountain ranges that run northwest to southeast
and contain many small glaciers and snowfields.
Limited soils data are available. At the higher elevations, soils are sparse and
found in pockets of variable depth and rock contents. At the lower elevations,
1416/frame/ch11 Page 275 Wednesday, February 9, 2000 2:27 PM
© 2000 by CRC Press LLC
276 Aquatic Effects of Acidic Deposition
glacial ice mixed and deposited materials in a complex pattern. Volcanic erup-
tions of Mt. Mazama provided as much as 15 cm of volcanic ash to most local
soils. As a result of ash influence, many soils in the park have loamy textures.
The western slopes in the park are influenced by maritime air masses that
provide a moderate amount of precipitation. To the east, continental air
masses modify the maritime influence, and create more variable conditions,
including colder and drier winter months. Annual precipitation ranges from
about 59 cm on the periphery to 250 cm or more in the central highlands
(Martinka, 1992). Winds are generally from the west or southwest.
The average concentrations of SO
4
2-
and NO
3
-
in precipitation at the
NADP/NTN monitoring site in GLAC (at Apgar) from 1980 through 1995
were 9 and 6 µeq/L, respectively. The average annual precipitation amount
received during that time period was 77 cm. The average concentration of SO
4
2-
in precipitation has decreased since the early 1980s when it fluctuated between
9 and 20 µeq/L. Other parameters have remained relatively unchanged.
Wet deposition of both S and N is very low at this site. In recent years, wet
deposition of S has fluctuated between 0.8 and 1.0 kg S/ha per year. Total N
wet deposition has been between 0.9 and 1.4 kg N/ha per year (Peterson and
Sullivan, 1998).
Snowpack samples were collected at Apgar Lookout in GLAC on March 18,
1996, and April 3, 1997. Concentrations of SO
4
2-
and NH
4
+
in the snow sam-
ples were consistent between the 2 years, 5.2 and 4.9 µeq/L, respectively for
SO
4
2-
, and 1.9 and 2.3 µeq/L, respectively for NH
4
+
. Nitrate concentrations
differed by a factor of two, however, and were 2.5 µeq/L in 1992 and 5.2
µeq/L in 1993 (Ingersoll, personal communication). Concentrations of all
three potentially acidifying ions were generally somewhat lower in the sam-
ples collected at GLAC than in comparable snow samples collected at Yellow-
stone and Grand Teton National Parks.
Atmospheric concentrations of S and N species have been measured at
GLAC since 1995 as part of the CASTNET dry deposition network. Dry dep-
osition flux calculations are not yet available, but are expected to be available
in the near future. Dry deposition of both N and S is expected to be low, how-
ever, probably less than 50% of wet deposition. Thus, the total deposition of
both S and N is very low at GLAC, and shows no indication of increasing.
GLAC contains 131 named lakes, 635 unnamed lakes, approximately 2103
km of intermittent streams, and 2506 km of perennial streams. The park is
bordered on the west and south by the North and Middle Forks of the Flat-
head river, both of which are within the National Wild and Scenic River sys-
tem. Aquatic resources within the park are outstanding.
Many of the lakes and streams within the park have characteristics gener-
ally associated with acid sensitivity, and these have been summarized by
Peterson and Sullivan (1998). They tend to be high in elevation, with little or
no soil development in their watersheds, have steep slopes and flashy
hydrology, and are hydrologically dominated by spring snowmelt. The
majority of these surface waters are, however, actually not at all sensitive to
acidification from acidic deposition owing to the preponderance of glaciers
1416/frame/ch11 Page 276 Wednesday, February 9, 2000 2:27 PM
© 2000 by CRC Press LLC
Case Study: Class I Areas in the Mountainous West 277
within their watersheds and the occurrence of sedimentary bedrock (Peter-
son and Sullivan, 1998). Both of these features contribute buffering in the
form of base cations to drainage waters in sufficient quantity to neutralize
any amount of SO
4
2-
and NO
3
-
that might be reasonably expected to be depos-
ited from acidic deposition. There are some waters in the park that receive
only modest contributions of base cations, however. These do not receive gla-
cial meltwater contributions to any significant extent and are situated in
watersheds with relatively inert bedrock. These sensitive waters are rela-
tively rare within the park (Peterson and Sullivan, 1998).
Ellis et al. (1992) monitored water quality of eight small backcountry lakes
and five large frontcountry lakes in GLAC. The objective was to establish a
water quality baseline for the park. Data were collected from 1984 to 1990.
The backcountry lakes were located in remote alpine headwater areas across
the various regions and geologies of the park. Of the lakes (Cobalt, Snyder,
and Upper Dutch), three had alkalinity less than about 200 µeq/L. Cobalt
Lake had the lowest alkalinity (approximately 100 µeq/L on average) and
specific conductance (approximately 10 µS/cm) of the study lakes and would
be expected to be sensitive to episodic effects of acidic deposition if S or N
deposition to the park increased substantially. If acidic deposition in the park
increased dramatically in the future, then perhaps Snyder Lake and/or
Upper Dutch Lake would also be affected. The study lakes other than Cobalt,
Snyder, and Upper Dutch would not be sensitive to acidification in response
to any increase in deposition that would reasonably be expected to occur in
the foreseeable future.
The EPA’s Western Lakes Survey sampled five lakes in GLAC and ten other
lakes in surrounding areas in the fall of 1986 (Landers et al., 1987). Measured
values of selected important physical and chemical variables are listed in
Table 11.1 for these 15 lakes and their watersheds. The lowest pH value mea-
sured in the park was 7.1, although 3 of the lakes in surrounding areas had
pH between 6.5 and 7.0. One of the lakes having lowest pH (6.6) contained
significant natural organic acidity (DOC equal to 10 mg/L); the others were
low in pH as a consequence of their dilute chemistry. Sulfate concentrations
in lake water were very low in lakes having low base cation concentrations.
For example, the four lakes with total base cation concentrations less than 100
µeq/L all had SO
4
2-
concentrations in the range of 5.7 to 10.1 µeq/L. Such con-
centrations of SO
4
2-
are approximately what would be expected, based on
SO
4
2-
concentration in the precipitation (approximately 6 to 8 µeq/L), negli-
gible dry deposition of S, 30 to 50% evapotranspiration, and minimal in-lake
reduction. These lakes are highly to moderately acid-sensitive with ANC val-
ues of 21 to 84 µeq/L, although the 2 most sensitive were located outside the
park boundaries. Many other lakes inside and outside the park had moder-
ately elevated concentrations of SO
4
2-
, in the range of 20 to 52 µeq/L. These
relatively high concentrations of SO
4
2-
are not attributable to atmospheric S
deposition. They reflect geological sources of S in drainage waters, as also
evidenced by the much higher concentrations (greater than 500 µeq/L) of
base cations in all of the lakes that had SO
4
2-
concentration greater than
1416/frame/ch11 Page 277 Wednesday, February 9, 2000 2:27 PM
© 2000 by CRC Press LLC
278 Aquatic Effects of Acidic Deposition
20 µeq/L. Based on these data, it appears that GLAC and surrounding areas
contain lakes that exhibit a mixture of acid sensitivities (Peterson and Sulli-
van, 1998). Some lakes that have low concentrations of SO
4
2-
(less than about
10 µeq/L) that can be reasonably attributed to atmospheric deposition
inputs also have low concentrations of base cations. These lakes tend to be
relatively acid-sensitive, and many have ANC values below 100 µeq/L. The
lowest measured ANC in the park during the WLS was 79 µeq/L. Other
lakes are characterized by higher concentrations of base cations and SO
4
2-
of
geologic origin. These lakes are not acid sensitive and have ANC values
greater than 500 µeq/L. Nitrate concentrations were generally below 5
µeq/L. One lake exhibited relatively high NO
3
-
concentration (11.6 µeq/L)
but this lake was not acid-sensitive.
11.3.2 Yellowstone National Park
Yellowstone National Park (YELL) in northern Wyoming and southern Mon-
tana contributes to two of the nation’s farthest reaching drainages: the Mis-
souri and Columbia Rivers. Surface water resources in the park include about
600 streams and 175 lakes. There are about 4400 km of free flowing rivers and
streams. There are 4 large lakes (Yellowstone, Shoshone, Lewis, and Heart
Lakes) that account for about 94% of the park’s lake surface. Water quality
TABLE 11.1
Results of Lake-water Chemistry Analyses by the Western Lake Survey for Selected
Variables in GLAC and Adjacent Areas
Lake ID
Lake
Area
(ha)
Watershed
Area (ha)
Elevation
(m) pH
ANC
(µeq/L)
SO
4
2-
(µeq/L)
NO
3
-
(µeq/L)
Ca
2+
(µeq/L)
C
B
(µeq/L)
DOC
(mg/L)
Lakes within GLAC
4C3-004 2.8 88 1930 8.1 1210 28.6 11.6 929 1212 0.4
4C3-010 3.7 44 2298 7.3 79 5.7 4.9 49 81 0.3
4C3-011 162.
0
5475 1126 8.0 543 32.1 4.5 375 613 0.5
4C3-013 4.4 62 2003 7.1 83 10.1 0.5 50 93 0.7
4C3-062 104.
8
4302 1482 8.1 1142 48.7 3.0 774 1210 0.7
Lakes outside GLAC
4C3-053 3.7 20 1979 6.6 21 8.0 0.1 29 57 1.5
4C3-016 5.4 88 1932 8.1 1388 20.1 0.0 1096 1393 1.0
4C3-017 6.2 173 1828 8.0 1209 32.3 0.7 832 1218 0.8
4C3-021 1.8 108 2104 7.9 492 27.4 1.5 768 1092 0.3
4C3-022 8.7 51 2050 7.5 360 10.0 2.1 295 386 0.8
4C3-026 167.
9
2188 1229 8.3 1409 52.4 0.1 965 1435 4.5
4C3-055 2.3 7 1921 7.6 426 8.0 0.7 360 453 4.3
4C3-060 12.7 77 1228 6.6 152 3.0 0.0 81 213 10.0
4C3-031 6.4 54 2006 6.9 72 8.2 0.1 40 78 1.2
4C3-059 1.8 31 2226 7.4 292 10.5 4.3 170 319 2.7
1416/frame/ch11 Page 278 Wednesday, February 9, 2000 2:27 PM
© 2000 by CRC Press LLC
Case Study: Class I Areas in the Mountainous West 279
varies throughout the park, mostly as a function of geologic terrain and the
influence of thermal features. Natural geothermal discharges that are quite
common in many portions of the park, affect the pH, ANC, temperature,
salinity, SO
4
2-
concentrations, and base cation concentrations of drainage
waters. Snowmelt is an important contributor to hydrologic budgets of
watersheds in the park, and water quality, therefore, tends to vary seasonally.
Precipitation volume and chemistry have been monitored at Tower Junc-
tion since 1980 by NADP/NTN. Annual precipitation amounts are generally
in the range of 30 to 45 cm per year at this site. The concentrations of SO
4
2-
,
NO
3
-
, and NH
4
+
in precipitation are low, with each generally below 10 µeq/L.
The combined low amount of precipitation and low concentrations of acid-
forming precursors result in very low levels of S and N deposition. Sulfur
deposition is generally well below 1 kg S/ha per year and N deposition is sel-
dom above this amount (Peterson and Sullivan, 1998).
Snowpack samples were collected in March or April of 1993 through 1999 at
five sites in YELL: West Yellowstone, Lewis Lake Divide, Sylvan Lake, Canyon,
and Twenty-One Mile. Sulfate concentrations in snow were low at all sites,
with five-year (1993 to 1997) mean concentrations ranging from 4.7 µeq/L at
Sylvan lake to 8.0 µeq/L at West Yellowstone. Mean concentrations of NO
3
-
in
the snowpack ranged from 4.2 µeq/L at Canyon to 5.0 µeq/L at Lewis Lake
Divide. Ammonium concentrations were similar to NO
3
-
concentrations, with
mean values ranging from 4.2 µeq/L at Canyon to 7.0 µeq/L at West Yellow-
stone (Ingersoll, personal communication). Although higher than comparable
measurements made in GLAC, these snowpack ionic concentrations were sim-
ilar to those in Grand Teton National Park and are considered low.
There are no data currently available on dry or occult deposition fluxes of
S or N to sensitive resources within YELL. However, it is expected that the
contributions of both dry and occult deposition of S and N are low relative to
the wet deposition. This is because there are no significant emission sources
in close proximity to the park and because the amount of wet deposition are
low. Atmospheric concentrations of S and N species have been measured in
YELL since 1996 as part of CASTNET. Dry deposition flux calculations are
not yet available, but are expected to be available in the near future.
Yellowstone Lake is noteworthy in a number of respects. The largest high-
altitude lake in North America, it lies mostly within the Yellowstone Caldera
that has some of the highest measured geothermal heat fluxes in the world
(Klump et al., 1988). Hydrothermal springs and hot gas fumeroles occur
within the lake. Enhanced biological activity occurs around the geothermal
vents that are characterized by high temperature, anoxia, and high concen-
trations of dissolved nutrients.
Native to the park are two subspecies of cutthroat trout (Oncorhynchus
clarki), the Yellowstone cutthroat (O. c. bouvieri) and the west slope cutthroat
(O. c. lewisi). The Yellowstone cutthroat was originally widely distributed in
the intermountain region, although its range is now greatly reduced. In addi-
tion, nonnative fish, including lake trout (Salvelinus namaycush), have been
introduced. Fishing management is now attempting to manage aquatic
1416/frame/ch11 Page 279 Wednesday, February 9, 2000 2:27 PM
© 2000 by CRC Press LLC
280 Aquatic Effects of Acidic Deposition
resources as functional components of the Greater Yellowstone Ecosystem
and to preserve and restore native species and aquatic habitats.
The WLS (Landers et al., 1987) sampled six lakes in YELL and nine lakes in
surrounding areas (Table 11.2). One of the lakes in the park was acidic
(ANC = -24 µeq/L). This acidity was attributable to geothermal inputs, as evi-
denced by the extremely high concentrations of SO
4
2-
(818 µeq/L) and sum of
base cations (1330 µeq/L). One lake had an ANC of 139 µeq/L and its pH was
also relatively low (6.6), mainly as a consequence of high concentration of
DOC (11 mg/L). Several of the lakes in surrounding areas surveyed by the
WLS were more acid-sensitive than those in the park; 4 out of 9 had ANC less
than 100 µeq/L and one was below 50 µeq/L. Most of these had low SO
4
2-
con-
centrations that could reasonably be attributed to atmospheric inputs
(approximately 8 to 10 µeq/L) and low base cation concentrations. Thus, there
are some lakes in and surrounding YELL that are acid-sensitive. Within the
park, however, the vast majority of the aquatic resources are insensitive to any
foreseeable increases in acidic deposition (Peterson and Sullivan, 1998).
11.3.3 Grand Teton National Park
Grand Teton National Park (GRTE) consists of 126,530 ha located in north-
western Wyoming. GRTE is surrounded by Bridger-Teton and Targhee
TABLE 11.2
Results of Lake-water Chemistry Analyses by the Western Lake Survey for Selected
Variables in YELL and Adjacent Areas
Lake ID
Lake
Area
(ha)
Watershed
Area (ha)
Elevation
(m) pH
ANC
(µeq/L)
SO
4
2-
(µeq/L)
NO
3
-
(µeq/L)
Ca
2+
(µeq/L)
C
B
(µeq/L)
DOC
(mg/L)
Lakes within YELL
4D3-013 11.3 75 2006 9.4 1510 17 0.4 1092 1618 5.5
4D3-016 4.6 523 2287 5.7 1332 2909 3.5 599 6682 3.5
4D3-017 38.8 297 2514 4.8 -24 818 0.3 243 1330 6.2
4D3-019 20.8 168 2392 6.6 139 6 0.0 112 220 11.2
4D3-052 15.5 367 2198 8.3 705 30 0.3 311 980 4.8
4D3-073 3.4 119 2677 8.5 416 8 0.0 356 429 1.9
Lakes outside YELL
4D2-050 1.5 64 2920 7.0 59 8 0.3 35 75 1.6
4D2-003 4.2 49 2793 7.5 161 7 0.7 66 184 1.3
4D3-001 76.2 7127 2037 8.6 630 33 0.4 436 737 1.3
4D3-002 3.2 80 2915 6.8 57 28 5.0 54 88 0.6
4D3-004 4.9 38 2935 7.1 79 9 0.5 45 101 1.5
4D3-006 3.0 75 2904 7.7 250 31 0.4 142 278 0.7
4D3-056 3.5 178 2935 6.9 45 11 0.3 32 66 1.8
4D3-028 2.1 31 2482 9.4 3795 109 1.6 1335 2484 16.7
4D3-024 20.7 481 3028 7.5 214 9 0.2 136 236 0.7
1416/frame/ch11 Page 280 Wednesday, February 9, 2000 2:27 PM
© 2000 by CRC Press LLC
Case Study: Class I Areas in the Mountainous West 281
National Forests, and lies 10 km south of YELL. The Teton Mountains, a 67
km long range, stretch along a north–south line and reach a height of 4230 m.
The Teton Mountain Range slopes steeply down to Jackson Hole, an inter-
mountain valley about 75 km long and 10 to 20 km wide.
Late in the Tertiary age, faulting uplifted the mountains on the east side
of Jackson Hole. One of the last events of diastrophism was the faulting and
uplift of the Teton Mountains and the down dropping of the Jackson Hole
valley floor. This large vertical displacement exposed granite, gneiss, and
schist, from which Teewinot soils have developed. The sedimentary rocks
have all been removed by erosion in the central portion of the range. Sedi-
mentary rocks, and associated Starman and Tongue River soils, persist at
the northern and southern ends of the range. They are mainly limestone,
sandstone, and clay shale. The granite, gneiss, and schist of the high moun-
tain areas of the park are expected to be fairly resistant to weathering and
would not be expected to contribute significant amounts of base cations to
drainage waters.
The dozen smaller glaciers now present in the Teton Range are relatively
new, having been formed in the last few thousand years. Most surface waters
within drainages fed by these glaciers likely receive sufficient contributions
of base cations from glacial scouring to render them insensitive to the adverse
effects of acidic deposition.
Average annual precipitation varies from about 41 cm at Jackson to about
154 cm near the summit of the Teton Mountains. Average annual snowfall
varies from about 2 m at Jackson to over 7.7 m at high elevation. Snowmelt
generally peaks in May and June. Surface winds display a wide range of pre-
vailing directions and mean speeds depending on the topography and eleva-
tion of the site (Dirks and Martner, 1982). At the higher locations, the
prevailing winds are consistently from the southwest.
There is no NADP deposition monitoring station in GRTE for S and N.
However, there is a NADP monitoring station in YELL to the north. Both
parks are exposed to the same general air masses, and both experience pre-
vailing winds mostly from the southwest. There are no large point sources of
N or S adjacent to either park that might cause major differences in local dep-
osition. The author, therefore, relies on deposition data from YELL to evalu-
ate deposition issues for GRTE. In addition, snowpack samples were
collected in late March and April from two sites (Rendevous Mountain, Gar-
net Canyon) in GRTE in 1993 through 1998. Data are currently available for
the period through 1997. Sulfate concentrations in snow were similar at the
two sites and ranged between 3 and 9 µeq/L (mean 5 µeq/L at both sites) and
NH
4
+
concentrations were somewhat lower (mean 3 and 4 µeq/L at Rende-
vous Mountain and Garnet Canyon, respectively). There were no apparent
trends from year to year at either of the sites for any of the variables (G.P.
Ingersoll, personal communnication).
There are about 90 alpine and subalpine lakes and ponds in the park. They
are located above about 2700 m elevation. The majority are in remote areas
that are difficult to access (Gulley and Parker, 1985). Most are less than 10 ha
1416/frame/ch11 Page 281 Wednesday, February 9, 2000 2:27 PM
© 2000 by CRC Press LLC
282 Aquatic Effects of Acidic Deposition
in area. Larger lakes are found at lower elevation. The multitude of small
lakes and streams are distributed throughout the mountainous areas of the
park, especially in the central and southern portions of the range.
The small size, shallow depth, and circular shape that are typical of the
average lake located at high elevation in the Tetons, are indicative of glacially
carved lake basins (Hutchinson, 1957). The mean maximum depth of alpine
lakes in the park is 6.8 m, and the average mean depth is 3.6 m, based on
bathymetric measurements of 46 alpine lakes (Gulley and Parker, 1985).
Alpine lakes in GRTE exhibit a range of characteristics that contribute to
their sensitivity to potential acidic deposition impacts (e.g., Marcus et al.,
1983; Peterson and Sullivan, 1998): bedrock resistant to weathering, shallow
soil, steep slope, low watershed to lake surface area ratio, high lake flushing
rate, high precipitation, high snow accumulation, and short growing season.
Surface water ANC values tend to be high throughout most of the low ele-
vation areas of the park. Lakes and streams with ANC less than 400 µeq/L
are generally restricted to the high mountain areas near the western border
of the park (Peterson and Sullivan, 1998).
Miller and Bellini (1996) evaluated the trophic status of 17 lakes in GRTE.
Phosphorus and chlorophyll a concentrations were measured in an effort to
detect aspects of lake-water quality suggestive of eutrophication. A review of
the literature did not yield earlier data on lake trophic status in the park, and
the data collected in this study, therefore, will constitute the baseline for
future evaluations of eutrophication in the park. Of the study lakes, six were
located in the mountains. Samples were collected in July and August and
analyzed for specific conductance, pH, and total phosphorus concentrations.
Specific conductance was below 20 µS/cm in all of the mountain lakes, sug-
gesting low concentrations of dissolved ions. Amphitheater and Surprise
Lakes had very low specific conductance (less than 10 µS/cm) and had pH in
the range 6.0 to 6.5.
Amphitheater and Surprise Lakes, the smallest of the lakes studied, are
located in close proximity to each other, approximately at treeline. Neither is
fed by a glacier. The absence of glacial meltwater contributions would be
expected to predispose these lakes to acidic deposition effects. Key elements
of acid–base chemistry were not measured by Miller and Bellini (1996), how-
ever, including ANC and the concentrations of base cations, SO
4
2-
and NO
3
-
.
Water quality was also measured by Miller and Bellini (1996) for seven
moraine lakes, all of which had pH greater than 8.0 and specific conductance
greater than about 17 µS/cm. The moraine lakes tend to be larger than the
mountain lakes; the smallest was Bradley Lake at 28 ha and the largest, Jenny
Lake at 486 ha. These lakes are insensitive to acidification from acidic depo-
sition. Similarly, all of the four valley lakes sampled had high specific con-
ductance (greater than 100 µS/cm) and pH greater than 8.5 and would not be
sensitive to acidic deposition.
Based on the phosphorus and chlorophyll a measurements, mountain lakes
were oligotrophic to mesotrophic, as were moraine lakes. Trophic status of
the valley lakes was more variable, with some in the eutrophic range.
1416/frame/ch11 Page 282 Wednesday, February 9, 2000 2:27 PM
© 2000 by CRC Press LLC
Case Study: Class I Areas in the Mountainous West 283
Sampled as part of the WLS were two lakes within GRTE and three lakes
in proximity to the park. None were particularly sensitive to acidic deposi-
tion. The lowest measured ANC value was 153 µeq/L, in a lake with pH of
7.3 (Table 11.3). Gulley and Parker (1985) surveyed 70 lakes and ponds in
GRTE during June, July, and August of 1982 and 1983. Sampled were 46
alpine lakes and ponds and 24 lower-elevation lakes. The majority of the
lakes were relatively dilute, with specific conductance less than about 30
µS/cm. Of the lakes, 22 were highly dilute, with specific conductance less
than or equal to 10 µS/cm. They were all located at high elevation; all were
above 2500 m and most were above 2900 m elevation. All except one (mon-
tane) lake were located in alpine settings. Dilute lakes tended to be small;
most were less than 2 ha in area. The largest was 6 ha. Watershed areas were
also small in most cases (less than 100 ha). pH values were generally in the
range of 7.0 to 8.0. Only 4 lakes had pH below 7.0 and 2 below 6.0. Calcium
concentrations were below 30 µeq/L in 6 of the dilute lakes.
Williams and Tonnessen (in review) sampled 17 high-elevation headwater
lakes throughout and adjacent to GRTE in August 1996. Although none were
acidic, about one-half had ANC values near 50 µeq/L, and almost all had
ANC below 200 µeq/L. About one-third had pH in the range of 5.8 to 6.0.
These data do not suggest that chronic lake-water acidification has occurred
but do suggest sensitivity, especially to episodic acidification. Of particular
importance was the observed concentrations of NO
3
-
that were relatively
high in many of the lakes sampled. Of these lakes, 6 had NO
3
-
concentrations
in the range of 5 to 10 µeq/L and 3 had NO
3
-
concentrations greater than 10
µeq/L (to a maximum of 13 µeq/L). Given that the lakes were sampled at the
end of the growing season, these data suggest that the capacity for biological
TABLE 11.3
Results of Lake-water Chemistry Analyses by the Western Lake Survey for Selected
Variables in GRTE and Adjacent Areas
Lake
Name Lake ID
Lake
Area
(ha)
Watershed
Area (ha)
Elevation
(m) pH
ANC
(µeq/L)
SO
4
2-
(µeq/L)
NO
3
-
(µeq/L)
Ca
2+
(µeq/L)
C
B
(µeq/L)
DOC
(mg/L)
Lakes within GRTE
Grassy
Lake
4D3-021 117.9 883 2198 7.3 153 18.9 0.3 93 188 1.5
Trapper
Lake
4D3-074 1.4 367 2107 7.6 435 38.7 2.1 298 491 1.1
Lakes outside GRTE
Hidden
Lake
4D3-022 7.2 129 2214 7.3 241 22.9 0.1 139 285 1.3
Loon
Lake
4D3-060 9.9 160 1970 7.0 486 21.0 0.3 320 549 4.2
Upper
Lake
4D3-069 47.0 3012 2022 8.8 2197 55.7 0.8 1481 2399 1.4
1416/frame/ch11 Page 283 Wednesday, February 9, 2000 2:27 PM
© 2000 by CRC Press LLC