Biology of Marine Birds - Chapter 5 ppt
Bạn đang xem bản rút gọn của tài liệu. Xem và tải ngay bản đầy đủ của tài liệu tại đây (1.08 MB, 22 trang )
115
Seabird Demography and Its
Relationship with the Marine
Environment
Henri Weimerskirch
CONTENTS
5.1 Demography and Life History Strategies 115
5.2 Seabirds and Other Birds 117
5.3 Demographic Parameters of Seabirds 118
5.4 Comparing the Demography of the Four Orders of Seabirds 120
5.5 Factors Responsible for Differences in Demographic Tactics 124
5.6 Intraspecific Variations in Demographic Traits 125
5.7 Population Regulation and Environmental Variability 129
5.8 Perspectives 131
Acknowledgments 132
Literature Cited 132
5.1 DEMOGRAPHY AND LIFE HISTORY STRATEGIES
Demography is the study of the size and structure of populations and of the process of replacing
individuals constituting the population. The study of demography was developed to forecast pop-
ulation growth. The rate at which a population increases or decreases depends basically on the
fecundity (number of eggs laid) and survivorship of the individuals that belong to the population
(Figure 5.1, bottom), but also to a lesser extent (especially for seabirds) on migration. Because
many organisms, and especially seabirds, breed several times in their lives, a population consists
of cohorts of individuals of different ages, born in different years. Moreover, mortality and fecundity
rates are generally age-specific; life tables represent these birth and death probabilities. The rela-
tionship between the rate of increase or decrease and demographic parameters can be translated
into more or less complex equations. The basic equation is the Euler–Lotka equation (Euler 1760,
Lotka 1907) that specifies the relationships of age at maturity, age at last reproduction, probability
of survival to age classes, and number of offspring produced for each age class, to the rate of
growth of the population (r).
The demography of organisms is a key to the evolution of life histories because it allows us
to examine the strength of selection on life history traits. Although they can achieve similar
population growth rates, i.e., being stable, increasing, or declining, each population living in a
particular habitat has specific dynamics, with specific age-related survivals and fecundities. The
particular values of the demographic traits depend upon the adaptation of individuals and the
attributes of the environment in which they live. Therefore, comparing demographic traits of
populations allows us to elucidate the ecological and evolutionary responses of populations to their
5
© 2002 by CRC Press LLC
116 Biology of Marine Birds
environments. The comparison of demographic traits among taxa shows that demographic “tactics”
exist; the concept of demographic tactic describes a complex co-adaptation of demographic param-
eters (Stearns 1976). Basically these co-adaptations result in the existence of a gradient from taxa
with high fecundity and a low survival, to species with a high survival and a low fecundity. This
fast–slow gradient (fast meaning fast turnover, and slow, slow turnover) or r/K gradient (Pianka
1970) provides a convenient (although not perfect) summary of the patterns linking life histories
and habitats.
However, caution must be taken when life histories are compared. First it is possible to compare
taxa from an ecological point of view as long as the allometric relationship linking them at a higher
taxonomic level is known (Clutton-Brock and Harvey 1979). For example, within a taxa (a genus,
for example), individuals of a particular species may live longer or produce fewer offspring than
another species, not because they rely on a different habitat, but only because they are larger.
Because they are larger they have a lower metabolism and therefore could live longer; they may
produce fewer offspring because their offspring are larger and therefore require more energy (Calder
1984). The second constraint is phylogenetic (Harvey and Pagel 1991). Species are prisoners of
their evolutionary past and can evolve to only a limited number of options. The single egg clutch
of all Procellariiformes, and many other seabird species, has often been taken as an example for
this (Stearns 1992). The life histories and habitats of two albatrosses can reasonably be compared,
but care has to be taken when an albatross is compared to a species belonging to a different order.
Phylogeny sets limits on an organism’s life history and habitat but the ecological task of relating
life histories to habitats is a fundamental challenge in ecology (Begon et al. 1996). Comparing
demographic tactics within taxonomic levels that are closely related (ideally within the same species,
see Lack 1947) to habitats or ecology remains a powerful tool to understand the influence of the
environment on the evolution of life histories (Figure 5.1).
The aim of this chapter is first to describe the demographic traits of seabirds and compare
these traits between taxa to examine whether demographic tactics can be found between and
within the four orders of seabirds. Second, the variation in demographic traits will be examined
to see whether it can be related to differences in the marine environment or the way seabirds
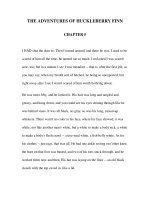
FIGURE 5.1 Schematic representation of the relationships between demographic traits and the marine envi-
ronment.
© 2002 by CRC Press LLC
Seabird Demography and Its Relationship with the Marine Environment 117
exploit it, when comparing species within the same order, but also by comparing populations
within the same species.
5.2 SEABIRDS AND OTHER BIRDS
In this study, a seabird is considered the species breeding along the seashore and relying on marine
resources during the breeding season. Therefore several species of Pelecanidae, Laridae, Sternidae,
and Phlacrocoracidae breeding inland or relying on freshwater resources are excluded, although
they often winter in marine habitats. The data set used here includes 177 species of seabirds, with
information on fecundity for 103 species, on age at first breeding for 111 species, and on
survival/life expectancy for 76 species. All three parameters were simultaneously available for 62
species, and fecundity and age at first breeding for 84 species. Data were taken from Cramp
(1978), Jouventin and Mougin (1981), Cramp and Simmons (1983), Marchant and Higgins (1990),
Del Hoyo et al. (1992, 1996), Gaston and Jones (1998), unpublished data from a long-term data
base for southern seabirds (CEBC-IFRTP), and unpublished data provided by E. A. Schreiber for
tropical Pelecaniformes.
When compared with other birds, seabirds have lower fecundity; they breed at an older age and
have higher adult survival. Since age at first breeding, survival, and to a lesser extent clutch size,
are explained in part by mass (relationship between log body mass and log of demographic
parameters: clutch y = –0.081x – 1.33, r
2
= 0.028, p < 0.01, n = 362 species of seabirds and other
birds; age at first breeding y = 0.215x – 0.545, r
2
= 0.313, p < 0.001, n = 261, survival y = 0.249x
+ 0.4859, r
2
= 0.394, n = 127, p < 0.001), it is important to remove the effect of size. Indeed it
could be argued that on average, seabirds are larger than land birds. To remove the variation of
demographic traits related to body mass, they were transformed as log (parameter) – 0.25 log (mass)
(Stearns 1983, Gaillard et al. 1989). Once the effect of body mass has been removed for clutch size
and age at first breeding, seabirds still appear to stand at the extreme slow end of the fast–slow
gradient that exists for bird species (Figure 5.2), underlying the low reproductive rate of seabirds.
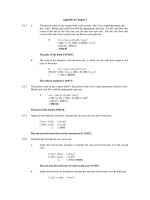
FIGURE 5.2 Relationship between the clutch size and minimum age at first breeding (both corrected for
body mass) in 175 species of seabirds (black dots, y = 0.571x + 0.72, r
2
= 0.541, p < 0.001) and 187 species
of other birds (white dots, y = 0.306x – 0.118, r
2
= 0.216, p < 0.001) belonging to all the existing orders of
birds for which data are available.
© 2002 by CRC Press LLC
118 Biology of Marine Birds
5.3 DEMOGRAPHIC PARAMETERS OF SEABIRDS
When examining the demographic parameters of seabirds, extensive differences exist between and
within orders, families, and species (Table 5.1). Fecundity is the product of clutch size, breeding
frequency, and breeding success. Fecundity of seabirds is generally low, with all Procellariiformes,
Phaethontidae, Fregatidae, and several species of Sulidae, Alcidae, Sternidae, Spheniscidae, and
even some Laridae having a clutch of one (Table 5.1; see also Appendix 2). Several species of
Diomedeidae, one of Procellaridae (the White-headed petrel Pterodroma lessonii; Figure 5.3), and
probably most Fregatidae (at least females) breed only every second year when successful. On the
other hand, some species of Phalacrocoracidae can have clutch sizes reaching five to seven eggs
and many species of Laridae have clutch sizes of three and are able to lay a replacement clutch
when failing early in the season (Figure 5.4).
The reasons for the low fecundity of seabirds have been much debated, and David Lack used
seabirds, especially pelagic seabirds with a very low fecundity, to illustrate his general theory on
clutch size (Lack 1948, 1968). Basically, Lack suggested that altricial birds should lay the clutch
that fledges the most offspring. The ability to provide enough food to offspring would therefore be
the main reason for the low reproductive rate of some seabirds. The development of life history
theory and especially the concept of cost of reproduction and residual reproductive value (Williams
1966) later sophisticated this view. The basic idea is that, because resources are assumed to be
limited, reproduction can have a negative influence on the probability of survival to the next
reproduction, and therefore individuals should balance present and future reproduction (allocation;
see Figure 5.1). For a long-lived species, the risk taken, especially during the first years of life,
should be limited in order to enhance future reproductive success. Long-lived animals would
therefore behave as “prudent parents,” trying to limit risks of increased mortality when reproducing.
Therefore the single clutch of albatrosses and many other seabirds may have evolved as the
result of the low provisioning rate of chick due to distant foraging zones (Lack 1968), but also of
the “prudent” behavior of the parents that would limit energetic investment because of their high
reproductive value. However, whether a clutch of one is the best option for other seabirds with a
different ecological specialization is not clear (Ricklefs 1990). Indeed the low fecundity of seabirds
is generally attributed to the marine environment on which they rely, an environment that is assumed
to be poor, patchy, and unpredictable (Ashmole 1971). However, obviously the marine environment
is very diverse and heterogeneous, with localized rich feeding areas or areas of low productivity.
Therefore we might expect differences in demographic tactics within taxa according to the envi-
ronment exploited, or to the foraging technique used, or diet. Conversely, convergence might be
expected between taxa exploiting the same resources or environment, and divergence within taxa
when environments exploited are different.
The minimum age at first breeding ranges from 2 to 4–5 years in most species of seabirds,
except for Diomedeidae and Fregatidae and some species of Procellaridae that start breeding later
(Table 5.1). Late age at first breeding is generally assumed to be necessary for long-lived species
to attain similar foraging skills to those of adults, either because skills are complex to attain (e.g.,
Orians 1969, Burger 1987) and/or because of the high reproductive value of young birds.
Like age at first breeding, but even more importantly, survival is a parameter that is difficult
to estimate accurately because it requires the marking of birds and their recapture over several
years. Estimates of adult survival are available for a limited number of species (Table 5.1) and have
to be treated with caution. Indeed, the statistical methods to estimate survival are in constant
refinement, resulting in an overall increase of the estimates of survival rates within a species as
techniques improve (Clobert and Lebreton 1991). Therefore, comparisons of survival are often
difficult to perform unless the same method has been used. Average longevity is generally used to
illustrate survival but cannot be compared to longevity records that only give maximum age based
on isolated recaptures. Most Procellariidae and Diomedeidae have high survival and life expectancy,
but also several species within the other orders, for example, several species of Alcidae and one
© 2002 by CRC Press LLC
Seabird Demography and Its Relationship with the Marine Environment 119
TABLE 5.1
Range of Demographic Parameters Observed in the Families of Seabirds
Order Family
Symbol
Used
in Figures
Number of
Species with
at Least One
Parameter
Average
Clutch
Frequency
of Breeding
Age at First
Breeding
Adult Life
Expectancy
(number of species
with an estimate
of survival)
Relationship between
Age at First Breeding
– 1/Fecundity
(both corrected for
body mass)
Relationship between
1/Fecundity –
Life Expectancy
(both corrected for
body mass)
Sphenisciformes Spheniscidae Cross 15 1–2 0.7–1 2–5 6.4–20.5 (10) y = 0.219x – 0.648, r
2
=
0.085, p > 0.1
y = 0.251x – 1.11, r
2
=
0.0262, p > 0.1
Procellariiformes Diomedeidae Circle 14 1 0.5–1 5–9 11.6–33.8 (12)
Procellariidae Square 22 1 0.5–1 2–8 6.9–25.5 (20) y = 0.165x + 0.087,
y = 0.97x – 1.8,
Hydrobatidae Diamond 5 1 1 2–3 7.6–17.2 (4) r
2
= 0.112, p < 0.05 r
2
= 0.359, p < 0.01
Pelecanoididae Triangle 2 1 1 2 5.7 (1)
Pelecaniformes Phaethontidae Circle 3 1 1 2–5 25.5 (1)
Pelecanidae 1 4 1 2 ? y = 0.322x – 0.299, y = 1.032x – 2.16,
Sulidae Diamond 9 1–3 1 2–5 17.2–20.5 (4) r
2
= 0.360, p < 0.05 r
2
= 0.495, p < 0.01
Phalacrocoracidae Triangle 8 2–4 1 2–4 6.7–10.4 (3)
Fregatidae Square 4 1 0.5 5–8 ?
Charadriiformes Stercoraridae Diamond 4 2 1 3–5 6.7–11.6 (4)
Laridae Square 12 1–3 1 2–4 8.8–19 (4) y = 0.07x – 0.268, y = 0.543x – 1.702,
Sternidae Triangle 14 1–2.1 1 2–4 5.7–9.6 (3) r
2
= 0.0226, p > 0.1 r
2
= 0.1236, p > 0.1
Alcidae Circle 19 1–2 1 2–5 4.7–20.5 (11)
© 2002 by CRC Press LLC
120 Biology of Marine Birds
Laridae. Unfortunately, no estimate is available for Fregatidae, nor for most tropical Procellariidae,
Laridae, and Sternidae, limiting the scope of a general comparison. The low fecundity and late age
at first breeding of Fregatidae suggest high survival rate (maximum age recorded 34 years [E.A.
Schreiber personal communication]), probably similar to Diomedeidae. One reason for the high
survival of seabirds, especially those breeding on oceanic islands, is the absence of terrestrial
predators; this is probably true for most large species, but not for the smaller species that can suffer
heavy mortality from avian predators. Estimates of survival between fledging and recruitment into
the breeding population are more difficult to obtain logistically because of the delayed age at first
breeding, and are rare in the literature, limiting the scope for meaningful comparisons between groups.
5.4 COMPARING THE DEMOGRAPHY OF THE FOUR ORDERS OF
SEABIRDS
Within seabirds, minimum age at first breeding and life expectancy (log transformed) are somewhat
related to the log of mass (y = 0.092x + 0.666, r
2
= 0.0788, p < 0.01 and y = 0.1148x + 1.675, r
2
= 0.1532, p < 0.001). These relationships express the allometric component of demographic pattern
and indicate that body mass is a significant, but not fundamental, determinant of the variation in
demographic traits in seabirds. They represent a first-order tactic which expresses the biomechanical
constraints of body mass (Western 1979, Gaillard et al. 1989). When parameters are corrected for
the effect of body mass, the relationships between demographic traits are still very significant
(Figure 5.5), representing a second-order tactic (Western 1979). It indicates that demographic
parameters of seabirds covary after correction for the effect of body mass, which suggests the
existence of demographic tactics among seabirds. The relationship between fecundity and life
expectancy is very significant (Figure 5.5) and highlights the classical balance between clutch size
and survival rates. The relationship between fecundity and age at first breeding, and that between
age at first breeding and life expectancy, are also highly significant (Figure 5.5). The regression
lines for the three relationships each describe a similar gradient within seabirds going from species
with a fast turnover (high fecundity, early age at first breeding, and short life expectancy) to species
with a slow turnover.
When examining the species within each order, they appear not to be distributed evenly along
this fast–slow gradient. Spheniciformes appear to be distributed at the left-hand size of the gradient
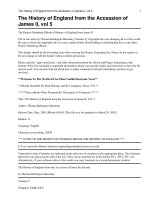
FIGURE 5.3 A White-headed Petrel. They breed only every other year, incubating their egg for 60 days and
spending 112 days raising their single chick. (Photo by H. Weimerskirch.)
© 2002 by CRC Press LLC
Seabird Demography and Its Relationship with the Marine Environment 121
or fast turnover end of the gradient: penguins breed relatively early, have a short life expectancy,
and a high fecundity relative to their size. Conversely, many Procellariiformes species are found
at the slow turnover extreme (Figure 5.5). Since the relationship considers all seabirds, i.e., four
different orders, it is important to examine whether the relationships are a result of taxonomic
differences in demography. Controlling for phylogeny (Harvey and Pagel 1991) was not possible
because of the lack of a complete phylogeny covering all species of seabirds, and was out of the
scope of this study. When investigating the existence of a gradient within orders, it appears that
significant relationships persist within Procellariiformes and Pelecaniformes, whereas there is a
tendency, yet nonsignificant for Charadriiformes, and no relationship for Spheniciformes (Table
5.1). This suggests the existence of different demographic tactics within Procellariiformes and
Pelecaniformes, and perhaps Charadriiformes. We will now examine whether these tactics among
taxa tending to show a fast or a slow turnover can be related to different environmental conditions
or foraging strategies.
(a)
(b)
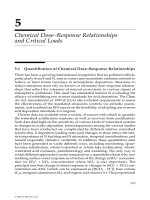
FIGURE 5.4 Seabird species exhibit a range of fecundities. (a) Some gulls, such as this Herring Gull, may
raise three chicks in a year, spending 45 to 50 days feeding them before they fledge. (b) Giant Petrels raise
one chick a year and spend 100 to 120 days feeding it before it fledges. (Photos by J. Burger.)
© 2002 by CRC Press LLC
122 Biology of Marine Birds
FIGURE 5.5 Relationships between 1/fecundity, age at first breeding, and life expectancy (corrected by body
mass) in the four orders of seabirds (Sphenisciformes, crosses; Procellariiformes, symbols filled in black;
Pelecaniformes in gray; and Charadriiformes in white). The inverse of fecundity is used for clarity, so that
the three variables are positively linked. Correspondences of symbols for families are given in Table 5.1.
Fecundity is estimated as the number of young produced per female per year. It is the product of the average
clutch size per year by the overall breeding success. Because data on the average age at first breeding are
scarce, minimum age at first breeding is used. Adult life expectancy is directly derived from adult survival
and is measured as (0.5 + 1/(1 – s)) (Seber 1973). When parameters are available for several populations,
average values are used.
© 2002 by CRC Press LLC
Seabird Demography and Its Relationship with the Marine Environment 123
To allow an easier representation of the ranking of species along this gradient, the species have
been plotted along the first component of a principal component analysis (PCA) performed on the
demographic parameters. When the three parameters are used, the first principal component explains
71.1% of the total variance (Figure 5.6a). One extreme, the left-hand side, is characterized by a
high fecundity, short life expectancy, and early age at first breeding, while the other extreme presents
the opposite characteristics. Because of the low number of species for which life expectancy is
known, with an absence of data for some families like Fregatidae (see Table 5.1), a PCA was also
performed on the fecundity and age at first breeding only, to be able to plot a larger number of
species. The first principle component then explains 74.3% of the total variance (Figure 5.6b).
Because the two analyses provide very similar ranking (compare Figure 5.6a and 5.6b, Factor 1 (2
parameters) = 0.924 × Factor 1 (3 parameters) + 0.043, r = 0.956, p < 0.001). We use the ranking
obtained from the PCA performed on fecundity and age at first breeding only, with the larger
number of species (Figure 5.6b).
(a)
(b)
FIGURE 5.6 Ranking of the four orders of seabirds along a slow–fast gradient described by the first principal
component of the PCA analyses (see symbols for families in Table 5.1): (a) PCA performed on 1/fecundity,
life expectancy, and age at first reproduction, all corrected for body weight (eigenvalues 2.133, 0.546, and
0.321); and (b) PCA performed on 1/fecundity and age at first reproduction, both corrected for body weight
(eigenvalues 1.487 and 0.513).
© 2002 by CRC Press LLC
124 Biology of Marine Birds
Spheniciformes and Procellariiformes almost do not overlap on the gradient, whereas Pelecan-
iformes extend throughout the gradient, and Charadriiformes are intermediate (Figure 5.6b).
Whereas the species within the four families of Procellariiformes are scattered throughout the
gradient, in Pelecaniformes the four families appear to be clearly separated from one another:
Phalacrocoracidae, Sulidae, Phaethontidae, and Fregatidae ranking separately on the fast–slow
gradient. This ranking probably reflects a strong phylogenetic effect on demographic tactics within
this order, with each family having a distinct morphology and feeding specialization. Conversely,
within Procellariiformes, Diomedeidae and Procellaridae are very similar in terms of morphology
and feeding technique and are ranked similarly. Similarities in demographic traits between some
families belonging to different orders suggest convergence. Phalacrocoracidae appear to have
equivalent demographic tactics to those of Spheniciformes, having a fast turnover. Diving petrels,
Pelecanoididae, also appear have faster turnover than most other petrels. This tendency to be at the
fast extreme of the gradient in these three families could be associated with the constraints of diving
that make birds poor fliers and therefore reduce foraging range. Convergence in demographic tactics
may also be found between Fregatidae and the longest lived albatrosses and petrels. These birds
have in common a pelagic life but especially economic flight. In Charadriiformes, a ranking of
demographic tactics by families is also apparent, although less clear-cut than in Pelecaniformes,
with Laridae (with the exception of one species, the Swallow-tailed Gull Creagrus furcatus) and
Stercoraridae toward the fast extreme. Conversely, Sternidae and Alcidae are distributed over a
wider range, rather at the slow end, suggesting convergence in demographic tactics with species
that are well known to be long-lived like Procellariiformes.
5.5 FACTORS RESPONSIBLE FOR DIFFERENCES IN DEMOGRAPHIC
TACTICS
Some demographic traits are phylogenetically conservative and fixed at high taxonomic levels. For
example, all Procellariiformes have a clutch size of one. Others, like minimum age at first breeding
and maximum life expectancy, probably do not vary within populations of a species because they
are likely not to be adapted to local environmental conditions. Maximum life expectancy is probably
mainly related to allometric pressures or phylogeny. Small birds have a higher energy expenditure
and therefore shorter life span than larger birds (Lindstedt and Calder 1976; see Chapter 11). There
are negative correlations between survival and vigorous, energy-expensive activity such as flight
(Bryant 1999); consequently, birds with a low-energy flight such as albatrosses may live longer
compared to birds with a highly expensive flight such as shags. On the other hand, breeding success,
breeding frequency, average age at first breeding, and adult and juvenile survival express the
interactions between phenotype and environment and are influenced by the environment (Figure
5.1). These demographic traits are likely to be different between closely related species exploiting
different marine environments, or even within the same species exploiting different environments.
Therefore, families covering a wide range over the fast–slow gradient suggest a broad range of
demographic tactics due, for example, to a group of species exploiting a diversity of habitats.
Conversely, families with a restricted range along the fast–slow gradient suggest that all species
belonging to this group probably face similar environmental conditions. For example, Sulidae rank
over a relatively restricted range, but they breed from tropical to sub-Arctic waters.
Seabirds have been classically separated into inshore, offshore, and oceanic or pelagic (Ashmole
1971), and it is generally assumed that pelagic species are the most long-lived, whereas inshore
species are shorter lived (Lack 1968). Therefore, we might expect that pelagic species should be
found at the slow turnover extreme of the fast–slow gradient. When considering the four orders
simultaneously, there is indeed a tendency for oceanic families to stand at the slow end of the
gradient (e.g., most Procellaridae, Hydrobatidae, Diomedeidae, or Fregatidae), whereas more
inshore families are found at the other extreme. However, this is mainly due to the fact that many
© 2002 by CRC Press LLC
Seabird Demography and Its Relationship with the Marine Environment 125
Procellariiformes are pelagic and stand at the slow extreme of the gradient. Examining the distri-
bution of inshore, offshore, or oceanic species within families does not lead to the clustering of
inshore or oceanic species at one or the other extreme of the gradient (Figure 5.7a). This suggests
that the assumption that pelagic species are more long-lived than inshore species only exists when
groups are compared at high taxonomic levels (for example, when comparing Procellariiformes
and Charadriiformes). But when the effect of size is controlled and each order examined separately,
the data available today do not allow us to conclude that pelagic species have a slower turnover
than inshore species.
Polar waters are generally more productive than tropical waters, which may have influenced
the evolution of demographic traits. Therefore, we might expect that tropical species might be
located at the slow end of the gradient compared to polar species. This tendency is not apparent
with the data available (Figure 5.7b). For most families, either some breed only over a narrow
range of climates (Alcidae or Fregatidae, for example) or data are not available (tropical Procel-
laridae, for example), limiting the possibility of making generalizations.
These first examinations indicate that the role of the marine environment in shaping demo-
graphic tactics is difficult to determine, and that the conjunction of several factors has probably
been involved in shaping the demographic traits of marine birds. Because data are lacking for many
groups, comparisons at lower taxonomic levels are impossible at this time.
5.6 INTRASPECIFIC VARIATIONS IN DEMOGRAPHIC TRAITS
Some species that are separated geographically show very homogenous demographic traits between
populations. For example, Wandering Albatrosses (Diomedia exulans) breeding in the Atlantic,
Indian, or Pacific Ocean have very similar demographic traits (Weimerskirch and Jouventin 1987,
Croxall et al. 1990, Weimerskirch et al. 1997, DeLamare and Kerry 1992; Figure 5.8), suggesting
that each population is relying on similar resources in the three regions. Indeed both in the Atlantic
(a)
(b)
FIGURE 5.7 Ranking of the four orders of seabirds along a slow–fast gradient described by the first principal
component of the PCA on 1/fecundity and age at first breeding: (a) Symbols are inshore (white), offshore
(gray), and oceanic (black) species. (b) Symbols are polar (white), temperate (gray), and tropical (black) species.
© 2002 by CRC Press LLC
126 Biology of Marine Birds
and the Indian Ocean, Wandering Albatrosses are pelagic feeders that rely on distant food resources,
have similar diets, growth of the chick, and foraging strategies (Weimerskirch et al. 1993, Prince
et al. 1998). However, homogeneous demographic traits between populations of the same species
are probably exceptions rather than the general rule. This will be highlighted by two examples.
Hatch et al. (1993) and Golet et al. (1998) noticed that Black-legged Kittiwakes (Rissa tridac-
tyla) from the Pacific appear to be much longer-lived than those breeding in the north Atlantic.
Golet et al. (1998) suggested that differences might be the result of higher winter mortality in
Atlantic populations because of lower food availability due to different oceanographic conditions.
A close examination of the data and the inclusion of other data indicate that the situation is not so
clear-cut, although all Pacific colonies have, on average, lower fecundity and higher survival than
Atlantic populations (Table 5.2). In the Atlantic, colonies in northern Norway, and to a lesser extent
in Scotland, are longer-lived than colonies in more southern waters (Table 5.2). The common
characteristic of the most long-lived populations is that fecundity is not only low on average
(fecundity can be fairly high some years in the Pacific), but it is very variable in all localities, with
complete breeding failures occurring frequently. Demographic tactics appear to vary extensively
between oceans, but also between the different sites in the Atlantic Ocean. The striking feature of
the data available for kittiwakes is that the range of average demographic traits (fecundity and adult
survival) for a single species covers, in fact, almost that of the whole Charadriiformes order (see
Figure 5.6).
Extensive differences exist between three populations of Black-browed Albatross (Thalassarche
melanophris) for which fecundity, adult survival, and other life history characteristics are known
(Table 5.3). The Kerguelen population is characterized by high breeding success that does not vary
from year to year, a relative low minimum age at first breeding, and a relatively low adult survival
(see references in Table 5.3). On the other end, the South Georgia population has a low and very
variable breeding success, years with complete breeding failures, a later minimum age at first
breeding, and a fairly high survival. The Campbell population (the smallest birds) is intermediate
between the two others, similar in fecundity to Kerguelen and in survival to South Georgia. Birds
at three sites rely on similar diets with the same squid species, typical of the Polar frontal zone.
At Kerguelen birds forage close to colonies, at an average distance of 250 km, over offshore waters
(on the slope of the shelf) where the Polar front passes. At South Georgia, birds forage over the
shelf, or slope area, and feed on krill to a large extent during some years, but have to forage farther
FIGURE 5.8 A pair of Wandering Albatrosses at their nest. They are one of the most long-lived seabirds and
have one of the longest breeding periods, incubating for 75 to 83 days and taking about 280 days to raise
their chick. (Photo by H. Weimerskirch.)
© 2002 by CRC Press LLC
Seabird Demography and Its Relationship with the Marine Environment 127
TABLE 5.2
Fecundity and Survival of Black-Legged Kittiwake (Rissa tridactyla) in Different
Sites of the North Atlantic and Pacific Oceans
Fecundity Chick/Year
(Range) Adult Survival References
Atlantic
North Shield — England 1.25 (1–1.4) 0.801 Aebischer and Coulson 1990,
Coulson and Thomas 1985
Brittany — France 0.78 (0.23–1.48) 0.808 Danchin and Monnat 1992
Isle of May — Scotland 0.890 Harris and Calladine 1993
Shetlands — Scotland 1.1 (0–1.8) Monaghan 1996
Hornøya — Norway 0.55 0.922 Erikstad et al. 1995
Eastern Canada 0.74
Pacific
Middleton Is. — Alaska 0.31 (0–1.2) 0.926 Hatch et al. 1993
Tatan Is. — Sea of Okhotsk 0.920 Hatch in Golet et al. 1998
St. George — Bering Sea 0.930 Dragoo and Dragoo 1996
Bluff — Alaska 0.55 (0–1.16) Murphy et al. 1991
Shoup Bay — Alaska 0.35 0.925 Golet et al. 1998
TABLE 5.3
Comparative Life History Traits of Three Populations of Black-Browed
Albatrosses
South Georgia
a
Kerguelen
b
Campbell
c
Ocean Atlantic Indian Pacific
Latitude 55°S 50°S 52°S
Size of population 65000 3300 10–15000
Mass of adult (g) 3560 ± 396 3655 ± 353 2750 ± 161
Culmen length (mm) 119.0 ± 2.4 118.4 ± 3.9 112.5 ± 2.9
Breeding success (%) 34.2 ± 24.0 63.0 ± 10 66.3 ± 12.9
Fecundity 0.27 0.580 0.543
Minimum age at first breeding 8 6 6
Average age at first breeding 10 9.7 10
Adult survival 0.95 ± 0.006 0.906 ± 0.005 0.945 ± 0.007
Juvenile survival 0.240 0.21 0.186
Trend of population (%/year) 0 0 +1.1
Foraging zone Shelf, Polar Front Shelf, Polar Front Shelf, Polar Front
Distance to main feeding zone 100–600 km 250 km 2200 km
Food Fish, Krill Fish Fish
Foraging trips incubation 12 days 4 days 11 days
Foraging trips chick rearing 2.1 (1–12) 2.1 (1–7) 2.0 (1–12)
Fledging period (days) 116 120 130
a
Before 1990, Prince et al. 1994, Croxall et al. 1998, Prince et al. 1998, Tickell and Pinder 1974.
b
References: Weimerskirch et al. 1997, Weimerskirch 1998.
c
References: Waugh et al. 1999a, 1999b, 1999c.
© 2002 by CRC Press LLC
128 Biology of Marine Birds
away when krill is rare (Veit and Prince 1997). They also exploit the Polar Frontal zone that is on
average 500 km north of the breeding site. At Campbell birds forage within a year alternately in
the Polar Frontal zone (2000 km south of the island), and on the shelf close to the island. On the
three sites, birds are using the same habitats, the Polar Frontal zone and shelf slopes, but the
geographic location and trophic situations of these favored habitats are different, leading to varying
demographic tactics. At Campbell the extensive distance to the Polar Front area makes provisioning
more difficult, with longer fledging periods and small fledglings, possibly the reason for the smaller
size of the adult birds. Yet fecundity, as well as survival, is high. The sizes of the populations are
also different between sites. Probably because the size of the shelf is related to the amount of
resources available to the population, the size of the Black-browed Albatross population for each
breeding locality varies directly with the size of the surrounding shelf (Figure 5.9).
Similar divergent evolution in demographic tactics probably exists within many other taxa of
seabirds where populations rely on different marine environments, or when the food resource is
more or less distant from the breeding grounds. The two examples presented here highlight the
importance of the marine environment in shaping demography of seabirds (Figure 5.1). Fecundity
is dependent on the amount of resources available in the environment, i.e., on oceanographic
processes, and their variability is influenced by climatic variability (see Chapter 6). Seabirds rely
on marine resources but have to breed on land. Colonies are often located in proximity to productive
ocean zones, but the distances between the colony and the resources put constraints on the amount
of energy seabirds are able to invest in reproduction. Seabirds must therefore allocate resources
(Figure 5.1). It is not surprising that the diversity in morphology that allows various families of
seabirds to efficiently exploit more or less distant resources has resulted in different demographic
strategies. For example, within Pelecaniformes, shags are poor fliers but excellent divers that forage
close to colonies, whereas frigatebirds are magnificient fliers and probably forage at great distances
from colonies. Similarities in demographic tactics are found in diverse families that exploit resources
in the same way: penguins and cormorants have restricted foraging range and rely on diving to
feed and have similar demographic tactics. Pelagic albatrosses and frigate birds share many life
history traits and have a similar demography. Alcids, often compared to penguins in terms of
morphology or foraging habits, are in fact closer to Procellariiformes in demographic terms (Figure
5.6, Croxall and Gaston 1988), possibly because several species of alcids forage at long distances
from colonies, but also because other factors probably have played a role in the evolution of low
fecundity. However, within families, when clutch size is fixed by phylogenetic history, fecundity
is greatly influenced by breeding success or frequency (highly dependent on the availability of
FIGURE 5.9 Relationship between population size and the surface of shelf as an index of food resource in
different populations of Black-browed Albatrosses.
© 2002 by CRC Press LLC
Seabird Demography and Its Relationship with the Marine Environment 129
resources). Variability in resources, quantity of resources, and distance to the resource all influence
both parameters (Figure 5.1).
The data available on fecundity and adult survival in several populations of kittiwakes (Table
5.2) suggest a negative relationship between the two that has a convex shape (Figure 5.10). The
shape of the relationship is similar to the classical figure representing the optimization of the trade-
off between survival and fecundity (Cody 1966). The trade-off underlines the idea that when
extrinsic factors such as resource availability or predation cause little mortality, evolution could
reduce parental investment and therefore fecundity. The curve for kittiwakes could represent the
range of possible demographic tactics, with the curve becoming asymptotic at the two extremes
(Figure 5.7). The maximum asymptotic values for survival and fecundity could be determined
genetically (maximum clutch size or maximum life span), and the intermediate values represent
the result of optimization of the trade-off, i.e., the possible phenotypes realized according to the
environmental conditions. The curve would be different for each species, as suggested by that for
Black-browed Albatrosses, and represents the possible demographic scenarios for a stable popula-
tion. Points with lower values (inside the convex curve) represent declining populations; those
outside, increasing populations. Hypothetical scenarios are shown as extremes for a very long-lived
species (Wandering Albatrosses with long life span and low fecundity, maximum one egg every
second year) and a shorter-lived species (shag with multiegg clutches, Figure 5.7). These different
scenarios are based on the assumption of density-dependent feedback. Although hypothetical, they
probably represent more accurately the possible variability in demographic traits found within a
species, and contrast, of course, with the single figure or average figure that is often proposed in
comparative studies. This representation does not integrate the survival of chicks from fledging to
recruitment, which plays a significant role in the population dynamics of long-lived species, but is
generally not considered, in part, because of the paucity of empirical data.
5.7 POPULATION REGULATION AND ENVIRONMENTAL
VARIABILITY
It has been suggested that populations of seabirds are mainly regulated by food availability, in a
density-dependent way (Ashmole 1963, Birkhead and Furness 1985). The sizes of populations in
relation to potential food availability around breeding grounds (Figure 5.6), or in relation to the
FIGURE 5.10 Relationship between fecundity and survival in kittiwakes (black dots) and Black-browed
Albatross (white dots) populations, suggesting a convex curve, representing the optimization between survival
and fecundity, specific to each species. Hypothetical relationships for a long-lived species (Wandering Alba-
tross) and a short-lived species (shag) are represented with the dotted lines.
Annual adult survival
Fecundity
© 2002 by CRC Press LLC
130 Biology of Marine Birds
location of other colonies of conspecifics (Furness and Birkhead 1984), are good examples. Also,
the degree of density dependence is likely to be different, especially during the breeding season,
between species relying on resources close or distant from breeding grounds (Birkhead and Furness
1985). Other factors such as predation or breeding site availability are likely to be important only
in isolated species, with the exception of predation by introduced species, such as cats or rats, on
islands that were free of terrestrial predators (Burger and Gochfeld 1994). The question remains
open: How does density dependence affect populations? For example, density-dependent feedback
may affect fecundity during the breeding season, or survival of adults or immatures during or
outside the breeding season (Figure 5.1).
Many seabird species live in a variable environment and it is not surprising that when examining
long-term trends in demographic traits these parameters can vary extensively over time. The most
extreme cases are, for example, populations of seabirds affected by El Niño–Southern Oscillation
(ENSO) events (e.g., Schreiber and Schreiber 1984; see Chapter 7). Variability in demographic
parameters mainly reflects the variability in food availability, which drops dramatically during en
ENSO event. One classical example is three species of “guano” (deposits used as fertilizer) seabirds
relying on anchovies off Peru. Huge populations of Guanay Cormorant (Leucocarbo bougainvilli),
Peruvian Booby (Sula variegata), and Brown Pelican (Pelecanus occidentalis) collapse regularly
(20 times in the last 100 years) with the occurrence of severe ENSO affecting the Humboldt current
(see, e.g., Duffy 1990; and Chapter 7).
Fecundity is the demographic trait that is mainly affected by variations in environmental
conditions off Peru (when the upwelling disappears), with lowered breeding success and fewer
birds breeding. This has also been documented in other areas such as the North Atlantic (for
kittiwakes, Aebischer et al. 1990) or in the Southern Ocean (for Blue Petrels, Halobaena caerulea,
Guinet et al. 1998) through correlations between breeding performances and oceanographic-climatic
parameters. There is less evidence that survival, especially adult survival, may be dependent on
environmental conditions. Theoretically, because they are long-lived, adult seabirds should be less
likely to suffer high mortality when environmental conditions are poor, than shorter lived species.
For example in the three species of seabirds from Peru affected by ENSO, it has been suggested
that adults die in large numbers from starvation (Duffy 1990). Inshore or sedentary species, such
as “guano” seabirds, could be more susceptible to die when resources are scarce, but this has not
been proved by either large numbers of birds found dead or by estimates of survival rates.
The lower susceptibility of long-lived species to increased mortality from environmental con-
ditions affecting the food supply might be partly due to the fact that seabirds, especially pelagic
species, can move to more favorable waters or migrate when conditions become unfavorable around
breeding grounds. But in general, the extent to which adult survival is affected by environmental
variability is poorly known due to few field studies of marked birds. Only recently developed
techniques in modeling of survival should allow us in the future to relate environmental variability
and adult survival in seabirds. Using such techniques, it has been possible to relate the survival of
adult Emperor Penguins to oceanographic anomalies related to the Antarctic Circumpolar Wave.
During the warm events that occur every 4 to 5 years, adult survival drops to low values, some
years to 0.75, whereas in other years survival is 0.92–0.97 (Barbraud and Weimerskirch 2001).
Another aspect of the demography of long-lived seabirds that is still poorly known is the extent
to which nonbreeding by adult mature birds affects the dynamics of populations. In addition to the
absence of reproduction in populations strongly affected by ENSO (Schreiber and Schreiber 1984,
Duffy 1990), it appears that nonbreeding could be a general feature in other populations in response
to ENSO. In some petrels in the Southern Ocean, up to 70% of the population refrains from breeding
in some years (Chastel et al. 1995), but adult survival is not affected by these poor years when
breeding success is low, or when few birds are able to breed (unpublished data). Thus it is important
to be able to distinguish between absence due to nonbreeding and absence due to mortality.
Environmental variability has probably had a major influence on the evolution of life history
traits of seabirds. It is generally assumed that birds which live in a highly variable environment
© 2002 by CRC Press LLC
Seabird Demography and Its Relationship with the Marine Environment 131
have increased reproductive rate and therefore reduced survival (Schaffer 1974). However, in our
examples with kittiwakes, as well as in Black-browed Albatrosses, populations with highly variable
fecundity, i.e., probably living in the most variable environment, are those with the highest survival
and the lowest fecundity. This paradox shows that the degree to which environmental variability
influences the evolution of life history strategies is not clearly understood (Cooch and Ricklefs
1994).
The possible tendency for some seabirds to be longer-lived when living in a variable environ-
ment may be explained by taking into account several important factors specific to seabirds, and
especially the ability or inability of species to disperse when conditions are unfavorable. Kittiwakes
and Black-browed Albatrosses disperse from the vicinity of breeding grounds, and are thus able to
escape from poor environmental conditions, especially outside the breeding season. Low average
fecundity due to high variability in breeding success and especially to the occurrence of complete
breeding failure has to be balanced by high survival. Conversely, species such as cormorants,
boobies, or pelicans in Peru and Ecuador are relying all year round on the same system, the
Humboldt current. Therefore collapse in food availability results in breeding failure and possibly
in adult mortality. Selection has probably, in this case, resulted in a high potential fecundity to
balance the possible regular crashes in adult population. Average adult survival is probably low,
but also probably highly variable, possibly being high during favorable years. In addition to the
ability or inability of adults to escape from poor trophic conditions, the frequency of extreme events
and the extent of variability in resource availability have probably played an important role in the
selection of demographic tactics.
It could be suggested that two kinds of demographic tactics might be selected. Highly variable
environments can select for boom/bust unstable populations with high fecundities if adults are
unable to escape adverse conditions (“guano” seabirds). Population sizes fluctuate extensively in
this case. Alternatively, if adults can move to different zones when feeding conditions decline
around the breeding area (Black-browed Albatrosses, kittiwakes, frigatebirds), lower fecundities
and high survival are selected for in variable environments. In less variable environments, popula-
tions do not vary extensively in size from one year to the next, and may be in some cases close to
saturation, with high density-dependent feedbacks: higher fecundity is balanced by lower survival,
or alternatively lower fecundity by high survival.
5.8 PERSPECTIVES
Understanding the demography of seabirds requires studying them over long periods having pop-
ulations of marked birds. Short-term studies of seabirds are inadequate to characterize the demo-
graphic pattern of seabird populations because seabirds are long-lived and live in variable environ-
ments. It is therefore necessary for studies to encompass the exceptional events that punctuate the
life of seabirds in order to measure demographic parameters. This is a difficult task, because long-
term studies have often been carried out by individual researchers (e.g., Fulmars, G. Dunnet;
Kittiwake, J. Coulson; Short-tailed Shearwaters, D. Serventy, R.D. Wooller, and J.S. Bradley) rather
than by institutions or governmental agencies, but also because humans have a life span that is not
much longer than that of some seabirds. Furthermore much modern research is generally based on
short-term projects.
One difficulty in studying seabird populations is that an important part of the population is not
accessible to study. Young birds, after they have fledged, remain at sea until they first breed, and
it is impossible to obtain information on the factors that affect their survival and maturation. Yet
immature birds represent a significant portion of the population, up to 40% in some species. Again
the only way to obtain information is to carry out long-term population studies and band large
numbers of fledglings. Doing this is vital to understanding the demography of a seabird population.
Another aspect that is also poorly known is the dispersal rates of a seabird population. Seabirds,
and especially Procellariiformes, are generally assumed to be highly philopatric but there is some
© 2002 by CRC Press LLC
132 Biology of Marine Birds
evidence that it is not always the rule. For example, the expansion of fulmars (Fulmarus) in the
Atlantic can only be explained by high emigration rates from large colonies. Most snow petrel
(Pagodroma nivea) chicks do not return to their birthplace (Chastel et al. 1993). The role of dispersal
in the dynamics of seabird populations is technically difficult to study, but it is likely that, in some
species at least, it plays a significant role.
There is a paucity in studies on tropical species for most families compared to the large number
of long-term studies on the demography of temperate or polar species. There is definitely a need
for studies on tropical species such as most Pelecaniformes (especially tropicbirds and frigatebirds),
tropical terns, or Procellariiformes. This would allow fruitful comparison and allow tests of hypoth-
esis such as, for example, that related to the lower productivity of tropical waters.
To conclude, it appears that much is still to be learned on the demography of seabirds, and
many exciting questions remain unanswered. Problems will only be solved by the development of
new ideas and modeling, but there is a striking need for empirical data. Comparative studies between
high taxonomic levels are probably not optimal to understand the role of the marine environment
in shaping demographic studies. Comparing populations of the same species, living in contrasted
environments is probably more promising.
ACKNOWLEDGMENTS
I would like to thank E. A. Schreiber and J. Burger for inviting me to write this chapter and for
extensive help in the preparation of the manuscript
LITERATURE CITED
AEBISCHER, N. J., AND J. C. COULSON. 1990. Survival of the kittiwake in relation to sex, year, breeding
experience and position in the colony. Journal of Animal Ecology 59: 1063–1071.
AEBISCHER, N. J., J. C. COULSON, AND J. M. COLEBROOK. 1990. Parallel long term trends across four
marine trophic levels and weather. Nature 347: 753–755.
ASHMOLE, N. P. 1963. The regulation of numbers of tropical oceanic seabirds. Ibis 103: 458–473.
ASHMOLE, N. P. 1971. Seabird ecology and the marine environment. Pp. 223–286 in Avian Biology, Vol. 1
(D. S. Farner and J. R. King, Eds.). Academic Press, New York.
BARBRAUD, C., AND H. WEIMERSKIRCH. 2001. Emperor penguins and climate change. Nature 411:
160–163.
BEGON, M., J. L. HARPER, AND C. R. TOWNSEND. 1996. Ecology: Individuals, Populations and Com-
munities. Blackwell Scientific, Oxford.
BIRKHEAD, T. R., AND R. W. FURNESS. 1985. Regulation of seabird populations. Pp. 145–167 in Behav-
ioural Ecology: Ecological Consequences of Adaptive Behaviour (Sibly and Smith, Eds.). Blackwell
Scientific, Oxford.
BRYANT, D. M. 1999. Energetics and lifespan in birds. Pp. 412–421 in Proceedings of the 22nd International
Ornithological Congress, Durban (N. J. Adams and R. H. Slotow, Eds.). BirdLife, Johannesburg, South
Africa.
BURGER, J. 1987. Foraging efficiency in gulls: a congeneric comparison of age differences in efficiency and
age of maturity. Studies in Avian Biology 10: 83–90.
BURGER, J., AND M. GOCHFELD. 1994. Predation and effect of humans on island-nesting seabirds. Pp.
39–67 in Seabirds on Islands: Threats, Case Studies and Action Plans (D. N. Nettleship, J. Burger, and
M. Gochfeld, Eds.). BirdLife International, Cambridge.
CALDER, W. A. 1984. Size, Function and Life-History. Harvard University Press, Cambridge, MA.
CHASTEL, O., H. WEIMERSKIRCH, AND P. JOUVENTIN. 1995. Body condition and seabird reproductive
performance: a study of three petrel species. Ecology 76: 2240–2246.
CLOBERT, J., AND J. D. LEBRETON. 1991. Estimation of demographic parameters in bird populations. Pp.
75–104 in Bird Population Studies: Relevance to Conservation and Management (C. M. Perrins, J. D.
Lebreton, and G. J. M. Hirons, Eds.). Oxford University Press, Oxford.
© 2002 by CRC Press LLC
Seabird Demography and Its Relationship with the Marine Environment 133
CODY, M. L. 1966. A general theory of clutch size. Evolution 20: 174–184.
COOCH, E. G., AND R. E. RICKLEFS. 1994. Do variable environments significantly influence optimal
reproductive effort in birds? Oikos 69: 447–459.
COULSON, J. C., AND C. S. THOMAS. 1985. Changes in the biology of the kittiwake (Rissa tridactyla): a
31-year study of a breeding colony. Journal of Animal Ecology 54: 9–26.
CRAMP, S. (Ed.). 1977. The birds of the Western Palearctic. Vol. 1. Oxford University Press, Oxford.
CRAMP, S., AND K. E. L. SIMMONS (Eds.). 1983. The Birds of the Western Palearctic. Vol. 3. Oxford
University Press, Oxford.
CROXALL, J. P., AND D. R. BRIGGS. 1991. Foraging economics and performance of polar and subpolar
Atlantic seabirds. Polar Research 10: 561–578.
CROXALL, J. P., P. A. PRINCE, P. ROTHERY, AND A. G. WOOD. 1998. Population changes in albatrosses
at South Georgia. Pp. 69–83 in Albatross Biology and Conservation (G. Robertson and R. Gales, Eds.).
Surrey Beatty & Sons, Sydney, Australia.
CROXALL, J. P., AND A. J. GASTON. 1988. Patterns of reproduction in high-latitude northern and southern
seabirds. Pp. 1176–1194 in Proceedings of the XIX International Ornithological Congress (H. Ouellet,
Ed.). University of Ottawa, Ottawa.
CROXALL, J. P., P. ROTHERY, et al. 1990. Reproductive performance, recruitment and survival of wandering
albatrosses Diomedea exulans at Bird Island, South Georgia. Journal of Animal Ecology 59: 775–796.
DANCHIN, E., AND J. Y. MONNAT. 1992. Population dynamics modeling of two neighbouring kittiwake
Rissa tridactyla colonies. Ardea 80: 171–180.
DEL HOYO, J., A. ELLIOTT, AND J. SARGATAL (Eds.). 1992. Handbook of the Birds of the World. Vol.
1. Lynx Edicion, Barcelona.
DEL HOYO, J., A. ELLIOTT, AND J. SARGATAL (Eds.). 1992. Handbook of the Birds of the World. Vol.
3. Lynx Edicion, Barcelona.
De LaMARE, W. K., AND K. R. KERRY. 1994. Population dynamics of the wandering albatross (Diomedea
exulans) on Macquarie Island and the effects of mortality from longline fishing. Polar Biology 14:
231–241.
DRAGOO, D. E., AND DRAGOO, B. K. 1996. Results of productivity monitoring of kittwakes and murres at
St. George Island, Alaska, in 1995. U.S. Fish and Wildlife Service Report, AMNWR 96/01. Homer, Alaska.
DUFFY, D. C. 1990. Seabirds and the 1982–1984 El Nino–Southern Oscillation. Pp. 395–415 in Global
Ecological Consequences of the 1982–83 El Nino–Southern Oscillation (P. W. Glynn, Ed.). Elsevier
Oceanography Series 52. Elsevier, Amsterdam.
ERIKSTAD, K. E., T. TVERAA, AND R. BARRETT. 1995. Adult survival and chick production in long-
lived seabirds: a 5-year study of the kittiwake Rissa tridactyla. Pp. 471–477 in Ecology of Fjords and
Coastal Waters (H. R. Skjodal, C. Hopkins, K. E. Erikstad, and H. P. Leinaas, Eds.). Elsevier, Amsterdam.
EULER, L. 1760. Recherches générales sur la mortalité: la multiplicité du genre humain. Mémoires de
l’Académie des Sciences, Berlin 16: 144–164.
FURNESS, R. W., AND T. R. BIRKHEAD. 1984. Seabird colony distributions suggest competition for food
supplies during the breeding season. Nature 311: 655–656.
GAILLARD, J. M., D. PONTIER, D. ALLAINE, J. D. LEBRETON, J. TROUVILLIEZ, AND J. CLOBERT.
1989. An analysis of demographic tactics in birds and mammals. Oikos 56: 56–76.
GASTON, A. J., AND I. L. JONES. 1998. The Auks. Alcidae. Oxford University Press, Oxford.
GOLET, G. H., D. B. IRONS, AND J. A. ESTES. 1998. Survival costs of chick rearing in black-legged
kittiwakes. Journal of Animal Ecology 67: 827–841.
GUINET, C., O. CHASTEL, M. KOUDIL, J. P. DURBEC, AND P. JOUVENTIN. 1998. Effects of warm sea
surface temperature anomalies related to El Nino and the Antarctic Circumpolar Wave on the blue petrel
at Kerguelen Island. Proceedings of the Royal Society London B 265: 1001–1006.
HARRIS, M. P., AND J. CALLADINE. 1993. A check on the efficiency of finding colour-ringed kittiwakes
Rissa tridactyla. Ringing and Migration 14: 113–116.
HARVEY, P. H., AND M. PAGEL. 1991. The Comparative Method in Evolutionary Biology. Oxford University
Press, Oxford.
HATCH, S. A., B. D. ROBERTS, AND B. S. FADELY. 1993. Adult survival of black-legged kittiwakes Rissa
tridactyla
in a Pacific colony. Ibis 135: 247–254.
JOUVENTIN, P., AND J. L. MOUGIN. 1981. Les stratégies adaptatives des oiseaux de mer. Terre et Vie 35:
217–272.
© 2002 by CRC Press LLC
134 Biology of Marine Birds
KARR, J. R., J. N. NICHOLS, M. K. KLIMKIEWICZ, AND J. D. BRAWN. 1990. Survival rates of birds of
tropical and temperate forests: will the dogma survive? American Naturalist 136: 277–291.
LACK, D. 1947. The significance of clutch size. Ibis 89: 302–352.
LACK, D. 1968. Ecological Adaptations for Breeding in Birds. Methuen, London.
LOTKA, A. J. 1907. Studies on the mode of growth of material aggregates. American Journal of Sciences 24:
199–216; 375–376.
LINDSTEDT, S. L., AND W. A. CALDER. 1976. Body size, physiological time and longevity of homeothermic
animals. Quarterly Review of Biology 56: 1–161.
MARCHANT, S., AND P. J. HIGGINS. 1990. Handbook of Australian, New Zealand and Antarctic Birds.
Vol. 1. Oxford University Press, Melbourne.
MONAGHAN, P. 1996. Relevance of the behavior of seabirds to the conservation of marine environments.
Oikos 77: 227–237.
MURPHY, E. C., A. M. SPRINGER, AND D. G. ROSENEAU. 1991. High annual variability in reproductive
success of kittiwakes (Rissa tridactyla L.) at a colony in western Alaska. Journal of Animal Ecology 60:
515–534.
ORIANS, G. H. 1969. Age and hunting success in the brown Pelican (Pelecanus occidentalis). Animal
Behaviour 17: 316–319.
PIANKA, E. R. 1970. On r- and k-selection. American Naturalist 104: 592–597.
PRINCE, P. A., J. P. CROXALL, P. ROTHERY, AND A. G. WOOD. 1994. Population dynamics of black-
browed and grey-headed albatrosses Diomedea melanophris and D. chrysostoma at Bird Island, South
Georgia. Ibis 136: 50–71.
PRINCE, P. A., J. P. CROXALL, P. N. TRATHAN, AND A. G. WOOD. 1997. The pelagic distribution of
South Georgia albatrosses and their relationships with fisheries. Pp. 137–167 in Albatross Biology and
Conservation (G. Robertson and R. Gales, Eds.). Surrey Beatty & Sons, Sydney, Australia.
RICKLEFS, R. E. 1990. Seabirds life histories and the marine environment: some speculations. Colonial
Waterbirds 13: 1–6.
SCHAFFER, W. M. 1974. Optimal reproductive effort in fluctuating environments. American Naturalist 108:
783–790.
SCHREIBER, R. W., AND E. A. SCHREIBER. 1984. Central Pacific seabirds and the El Nino Southern
Oscillation: 1982 to 1983 perspectives. Science 225: 713–716.
SEBER, G. A. F. 1973. The estimation of animal abundance and related parameters. Griffin, London.
STEARNS, S. 1976. Life history tactics: a review of the ideas. Quarterly Review of Biology 51: 3–47.
STEARNS, S. 1992. The Evolution of Life Histories. Oxford University Press, Oxford.
TICKELL, W. L. N., AND R. PINDER. 1975. Breeding biology of the black-browed albatross, Diomedea
melanophris, and grey-headed albatross, D. chrysostoma, at Bird Island, South Georgia. Ibis 117:
433–452.
VEIT, R. D. R., AND P. A. PRINCE. 1997. Individual and population level dispersal of black-browed
albatrosses Diomedea melanophris and grey-headed albatrosses D. chrysostoma in response to Antarctic
krill. Aredea 85: 129–134.
WAUGH, S. M., P. A. PRINCE, AND H. WEIMERSKIRCH. 1999. Geographical variation in morphometry
of black-browed and grey-headed albatrosses Diomedea melanophrys and D. chrysostoma. Polar Biology
22: 189–194.
WAUGH, S., H. WEIMERSKIRCH, Y. CHEREL, U. SHANKAR, P. A. PRINCE, AND P. SAGAR. 1999.
The exploitation of the marine environment by two sympatric albatrosses in the Pacific Southern Ocean.
Marine Ecology Progress Series 177: 243–254.
WAUGH, S., H. WEIMERSKIRCH, P. MOORE, AND P. SAGAR 1999. Population dynamics of New Zealand
Black-browed and Grey-headed Albatross Diomedea melanophrys impavida and D. chrysostoma at
Campbell island, New Zealand, 1942–1996. Ibis 141: 216–225.
WEIMERSKIRCH, H. 1998. Foraging strategies of southern albatrosses and their relationship with fisheries.
Pp. 168–179 in Albatross Biology and Conservation (G. Robertson and R. Gales, Eds.). Surrey, Beatty
& Sons, Sydney, Australia.
WEIMERSKIRCH, H., AND P. JOUVENTIN. 1998. Changes in population size and demographic parameters
of 6 albatross species breeding in the French sub-antarctic slands. Pp. 84–91 in Albatross Biology and
Conservation (G. Robertson and R. Gales, Eds.). Surrey Beatty & Sons, Sydney, Australia.
© 2002 by CRC Press LLC
Seabird Demography and Its Relationship with the Marine Environment 135
WEIMERSKIRCH, H., T. MOUGEY, AND X. HINDERMEYER. 1997. Foraging and provisioning strategies
of black-browed albatrosses in relation to the requirements of the chick: natural variation and experimental
study. Behavioral Ecology 8: 635–643.
WESTERN, D. 1979. Size, life history and ecology in mammals. East Africa Wildlife Journal 17: 185–204.
WILLIAMS, G. C. 1966. Natural selection, the cost of reproduction and a refinement of Lack’s principle.
American Naturalist 100: 687–690.
© 2002 by CRC Press LLC
Wilson’s Storm-petrel Feeding on the Wing
© 2002 by CRC Press LLC